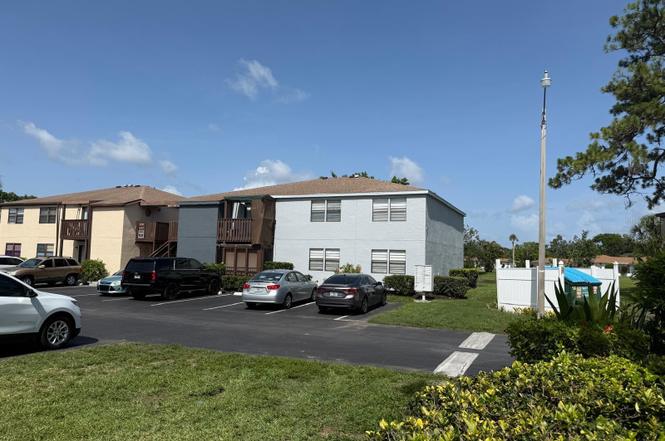
5026 Water Oak Dr #114 · South Bradenton, FL
Flood risk 1/10 · Minimal
- FEMA flood zone
- X (unshaded)
- Chance of flooding over 30 yrs
- 0.0%
- Est. flood insurance / yr
- $507 – $1,088
Fire risk 1/10 · Minimal
- Est. fire insurance / yr
- $947 – $1,759
Heat risk 10/10 · Severe
- Hot days now (above 107°F)
- 7 days/yr
- Hot days in 30 yrs
- 28 days/yr
Wind risk 10/10 · Severe
- Chance of severe wind over 30 yrs
- 99.0%
Air-quality risk 3/10 · Minor
- Unhealthy air days now
- 2 days/yr
- Unhealthy air days in 30 yrs
- 2 days/yr
Risk factors via First Street. Map © Google.
Why this score? — see what drove the C grade
The composite is a weighted blend of 9 inputs, each scored 0–100. Each bar is that input's sub-score; the figure is the points it added to the 100-point composite (weight × sub-score).
- Cash flow +19.5/30.0
- 1% rule +10.0/10.0
- ARV discount +7.5/15.0
- DSCR +6.2/10.0
- Schools +4.4/10.0
- Livability +3.9/5.0
- Condition / age +2.5/5.0
- Rent growth +1.1/5.0
- Appreciation +0.0/10.0
$125,000
🖨 Deal sheet (PDF) 📄 Offer letter ✓ Due diligence
Listing remarks MLS
Beautiful lake views in this 2 bedroom/2 bathroom Condo in West Bradenton. This location is minutes from State College of Florida, IMG Academy, shopping, and the Beaches. Water Heater replaced in 2020 and Air Handler replaced in 2016. Basic cable included and pool is seconds from the unit. No age restrictions.
Key facts
- Lake views
- Walk-in closet
- Pool
Tags
Property features AI
Finance
- Financial info: Lease restrictions apply
- HOA & community: Monthly association required; Association approval required; Association covers cable TV, internet, pool, common area taxes, insurance, maintenance (structure and grounds), trash, and escrow reserves fund; Pets allowed (max 20 lbs); Sidewalks in community
Exterior
- Utilities: Public water; Public sewer; Cable connected; Electricity connected
- Home design: Residential condominium; One story; Faces west; Entry on first floor (unit on floor 1); Condo includes land
- Construction: Block and stucco construction; Shingle roof; Slab foundation; Built as part of building number 5026
- Exterior features: Sidewalk
Interior
- Kitchen: Dishwasher; Range; Refrigerator
- Bedrooms: 2 bedrooms
- Flooring: Ceramic tile
- Bathrooms: 2 full bathrooms
- Heating & cooling: Central heating; Central air conditioning
- Interior features: Ceiling fans
- Laundry & utility: Laundry room
Neighborhood map
What this means for you Summary
Snapshot
- This is a 2-bed/2.0-bath condo listed at $125k.
Deal economics
- At list price, monthly cash flow is $142 ($2k/yr) — positive.
- The deal already cash-flows at list — no discount required.
- Meets the 1% rule at list price ($2k rent vs $125k).
- Cap rate 7.7% vs local median 4.1% in South Bradenton — top-decile yield for the area; either an underpriced asset or a hidden risk that comps aren't pricing in. Stress-test before assuming the spread holds.
Location & tenants
- Location reads 77/100 on livability (#195 in FL, #3,092 nationally) — a middle-class / working-renter tenant base. Strengths: cost of living A+, housing A+, health & safety A+; Watch: amenities C-, crime D+, commute F.
- Manatee (suburban): math 54% / reading 50% proficiency, ranked #26 of 73 in FL (top 36%) — acceptable for families but not a draw, mixed tenant base, ~2y average lease.
- Market conditions: Rents falling (-5.5%/yr); 361 active listings in the ZIP; 40 comparable units currently listed for rent nearby; rentals at typical pace (median 21d on market — plan ~3-4 weeks tenant-placement turnaround); 7,472 units permitted in Manatee County in 2024 (1,782 in 5+ unit buildings).
- At $1,904/mo this rent would consume 51% of the median local household income ($45k/yr) (locally 1474% of renters already pay >50% of income on rent) — very limited rent-growth headroom before tenants either downsize or default.
Forward outlook
- Local home prices are declining (-3.0%/yr); year-one equity from $864 of loan paydown is wiped out by about $4k of value loss. Plan a longer hold.
- Manatee County population projected at +43% by 2050 — long-run rental-demand tailwind backs the buy-and-hold thesis.
Negotiation context
- Only 3 days on market — expect competitive offers; lowballing is unlikely to land.
- 5 sale attempts since 21y ago with the ask held roughly flat each time — persistent listings suggest the price (not the market) is what's stuck; bring a comps-based counter.
- Current owner paid $100k; 25% above their basis — modest negotiation headroom, anchor on the comps not their cost.
Risks & watch-outs
- Watch-outs: HOA is 28% of rent.
- Climate carrying-cost: severe wind risk, 99% chance of damaging wind over 30y; extreme-heat days projected 7→28/yr by 2055 (HVAC capex compounding) — expect insurance premiums to compound above CPI over the hold.
Questions for the listing agent
- What does the HOA fee cover, when was the last increase, and are there any pending special assessments or reserve-fund shortfalls?
- Any open or pending special assessments — roof, HVAC, plumbing, elevator, façade? What's the per-unit balance and payoff schedule, and is the seller paying it off at close or rolling it to the buyer?
- Is there a deadline driving the sale (1031 exchange, divorce, estate, relocation)? That informs how much negotiation room exists.
- Schools are B-rated — typically a magnet for longer-tenancy family renters. What's the average tenant stay here, and is there a school-zone premium baked into asking?
- Crime grade is D in this area — have there been break-ins, vandalism, or insurance claims at this property in the last 3 years? What carrier currently insures it and at what premium?
- What's the average days-on-market for RENTAL listings here right now (not sales)? A rising rental-DOM trend means longer vacancies and softer asking-rent achievability than the comps imply.
- What's the recent tenant-quality profile in this submarket — average credit score on applications, eviction rate, late-payment / NSF rate, and stable-employment percentage? A property-management company in the area should have these aggregated.
- How much new apartment / multifamily construction is in the pipeline within 1–3 miles? Heavy new supply (>2% of stock underway) typically softens rents 12–24 months out; light construction supports rent growth.
Investment metrics
- 1% rule
- 1.52% ✓
- Cap rate
- 7.65%
- Cash-on-cash
- 4.86%
- DSCR
- 1.22
- GRM
- 5.5
CMA / ARV
No comps found within radius.
Projected returns pro-forma
-3.0% appreciation · 0.0% rent growth · sell at horizon
- IRR
- -13.7%
- Equity multiple
- 0.53×
- Total profit
- $-16,475
- Equity at exit
- $18,638
- IRR
- -14.4%
- Equity multiple
- 0.34×
- Total profit
- $-22,927
- Equity at exit
- $10,808
Cash invested: $35,000 (down + closing). Projections, not guarantees.
Landlord ↔ Tenant lean methodology
- Overall (STATE)
- 87 Strongly Landlord-Friendly
- State Florida
- 87 Strongly Landlord-Friendly · R+3
- County
- — inherits STATE
- City
- — inherits STATE
ZIP-level market 34207
- Rents YoY
- -5.5%
- Active inventory
- 361
- Price-to-rent
- 5.5×
Monthly cashflow live
- Estimated rent
- $1,904 high interval (Pro) →
- Mortgage (P&I)
- −$656
- Tax from tax record
- −$130 /mo · $1,559/yr
- Insurance
- −$52
- HOA
- −$525
- Vacancy / Maint / Mgmt
- −$400
- Net cashflow
- $142
Break-even live
Sensitivity live
| Price | -10% $212 | -5% $177 | +0% $142 | +5% $106 | +10% $71 |
|---|---|---|---|---|---|
| Rent | -10% $-9 | -5% $66 | +0% $142 | +5% $217 | +10% $292 |
| Rate | -1.0pp $205 | -0.5pp $174 | base $142 | +0.5pp $109 | +1.0pp $76 |
UW: 25.0% down · 7.5% · 30yr · 1.5% tax · 5.0% vac · 8.0% maint · 8.0% mgmt
Financing live
Cash to close
- Down payment
- $31,250
- Closing costs
- $3,750
- Reserves months
- —
- Total cash needed
- —
Loan-product check · same deal, 3 products live
Conventional
25% down · 7.5% · 30yr
- Down + closing
- —
- Monthly P&I
- —
- Monthly cashflow
- —
- DSCR
- —
- Eligible?
- —
Personal DTI + credit; lowest rate.
DSCR
20% down · 8.5% · 30yr
- Down + closing
- —
- Monthly P&I
- —
- Monthly cashflow
- —
- DSCR
- —
- Eligible?
- —
No personal income docs; deal must DSCR.
Hard money
10% down · 12.0% · 12mo
- Down + closing
- —
- Monthly P&I
- —
- Monthly cashflow
- —
- DSCR
- —
- Eligible?
- —
Short-term bridge; refi at stabilization.
Rent comps 40 comps
| Address | Beds | Baths | Sqft | Rent | $/sqft | DOM | Units | Dist |
|---|---|---|---|---|---|---|---|---|
| 5026 Water Oak Dr #104 Bradenton, FL | 3.0 | 2.0 | 960 | $2,200 | $2.29 | 24d | 1 | 0.02mi |
| 5062 Live Oak Cir Unit 5026 Bradenton, FL | 2.0 | 2.0 | 896 | $1,545 | $1.72 | 16d | 1 | 0.04mi |
| 5059 Live Oak Cir Unit 5059 Bradenton, FL | 2.0 | 2.0 | 896 | $1,900 | $2.12 | 16d | 1 | 0.09mi |
| 5027 31st St W Bradenton, FL | 2.0 | 2.0 | 972 | $3,600 | $3.70 | 22d | 1 | 0.15mi |
| 2835 50th Ave W Bradenton, FL | 1.0–2.0 | 1.0–2.0 | 850 | $1,610 | $1.89 | 4d | 16 | 0.16mi |
| 2803 52nd Avenue Dr W Unit 2803 Bradenton, FL | 2.0 | 1.0 | 750 | $1,599 | $2.13 | 24d | 1 | 0.20mi |
| 3278 51st Avenue Dr W Unit 1 Bradenton, FL | 2.0 | 1.0 | 850 | $1,600 | $1.88 | 24d | 1 | 0.25mi |
| 4812 27th St W Bradenton, FL | 2.0 | 2.0 | 912 | $1,599 | $1.75 | 12d | 1 | 0.26mi |
| 4812 27th St W Unit 4812 Bradenton, FL | 2.0 | 2.0 | 912 | $1,545 | $1.69 | 12d | 1 | 0.26mi |
| 3277 51st Avenue Dr W Bradenton, FL | 3.0 | 2.0 | 995 | $1,760 | $1.77 | 4d | 1 | 0.27mi |
| 4906 25th St W #101 Bradenton, FL | 2.0 | 1.5 | 1070 | $1,550 | $1.45 | 24d | 1 | 0.28mi |
| 4705 27th St W Unit A Bradenton, FL | 2.0 | 1.0 | 750 | $1,325 | $1.77 | 3d | 1 | 0.38mi |
| 5310 26th St W Bradenton, FL | 1.0–2.0 | 1.0 | 789 | $1,450 | $1.84 | 4d | 4 | 0.39mi |
| 5310 26th St W Bradenton, FL | 1.0–2.0 | 1.0 | 789 | $1,450 | $1.84 | 12d | 5 | 0.39mi |
| 5310 26th St W Bradenton, FL | 1.0–2.0 | 1.0 | 789 | $1,550 | $1.96 | 20d | 5 | 0.39mi |
| 206 Lakewood Dr Unit 206 Bradenton, FL | 2.0 | 2.0 | 940 | $2,700 | $2.87 | 24d | 1 | 0.41mi |
| 5400 26th St W Bradenton, FL | 1.0–2.0 | 1.0–2.0 | 902 | $1,651 | $1.83 | 24d | 1 | 0.43mi |
| 5001 22nd St W Unit B Bradenton, FL | 2.0 | 1.0 | 729 | $1,700 | $2.33 | 16d | 1 | 0.46mi |
| 184 Pineneedle Dr Bradenton, FL | 2.0 | 2.0 | 940 | $2,100 | $2.23 | 24d | 1 | 0.50mi |
| 4906 21st St W Bradenton, FL | 2.0 | 1.0 | 918 | $1,700 | $1.85 | 16d | 1 | 0.50mi |
| 2004 49th Ave W Unit 2002 Bradenton, FL | 2.0 | 2.0 | 1021 | $1,950 | $1.91 | 24d | 1 | 0.56mi |
| 3401 54th Dr W Bradenton, FL | 2.0–3.0 | 2.0–3.0 | 1293 | $3,300 | $2.55 | 4d | 3 | 0.63mi |
| 2305 46th Ave W Bradenton, FL | 1.0–2.0 | 1.0–2.0 | 1005 | $1,837 | $1.83 | 2d | 10 | 0.63mi |
| 3506 54th Dr W Bradenton, FL | 1.0–2.0 | 1.0–2.0 | 953 | $2,800 | $2.94 | 4d | 2 | 0.68mi |
| 4515 26th St W Bradenton, FL | 1.0–2.0 | 1.0–2.0 | 806 | $1,510 | $1.87 | 2d | 14 | 0.69mi |
| 3605 54th Dr W Bradenton, FL | 2.0 | 2.0 | 1166 | $3,738 | $3.21 | 4d | 2 | 0.69mi |
| 3604 54th Dr W Bradenton, FL | 2.0 | 2.0 | 1114 | $4,050 | $3.64 | 4d | 3 | 0.70mi |
| 586 Lakeside Dr Unit 586 Bradenton, FL | 2.0 | 2.0 | 940 | $3,200 | $3.40 | 24d | 1 | 0.76mi |
| 4148 53rd Ave W Bradenton, FL | 1.0–3.0 | 1.0–2.0 | 989 | $2,550 | $2.58 | 2d | 1 | 0.89mi |
| 4148 53rd Ave W Unit 0314 Bradenton, FL | 2.0 | 2.0 | 1071 | $1,967 | $1.84 | 24d | 1 | 0.89mi |
| 4148 53rd Ave W Bradenton, FL | 1.0–2.0 | 1.0–2.0 | 899 | $2,412 | $2.68 | 22d | 10 | 0.89mi |
| 4148 53rd Ave W Unit 1210 Bradenton, FL | 2.0 | 2.0 | 1071 | $1,932 | $1.80 | 4d | 1 | 0.89mi |
| 5513 18th St W Bradenton, FL | 2.0 | 1.0 | 1000 | $1,499 | $1.50 | 24d | 1 | 0.95mi |
| 4444 17th St W Unit B Bradenton, FL | 2.0 | 1.0 | 850 | $2,200 | $2.59 | 24d | 1 | 0.95mi |
| 3848 59th Ave W Bradenton, FL | 2.0 | 2.0 | 912 | $1,395 | $1.53 | 24d | 1 | 0.97mi |
| 4449 46th Ave W Unit 4449 Bradenton, FL | 2.0 | 1.0 | 1110 | $3,200 | $2.88 | 24d | 1 | 0.99mi |
| 3851 59th Ave W Unit 3851 Bradenton, FL | 2.0 | 2.0 | 912 | $1,500 | $1.64 | 24d | 1 | 0.99mi |
| 3843 59th Ave W Bradenton, FL | 2.0 | 2.0 | 912 | $1,200 | $1.32 | 24d | 1 | 0.99mi |
| 5531 16th St W Unit 5537 Bradenton, FL | 2.0 | 1.0 | 750 | $1,650 | $2.20 | 4d | 1 | 1.01mi |
| 3774 59th Ave W Unit 3774 Bradenton, FL | 2.0 | 2.0 | 912 | $1,350 | $1.48 | 24d | 1 | 1.01mi |
HOA detail condo
- Monthly dues
- $525 · $6,300/yr
- Likely covers
- watercablepool
- Assessments
- None detected in remarks — confirm with the listing agent.
Listing history 4 events
-
2026-06-18days on market $125,000 Active 3 DOM
-
2026-06-17days on market $125,000 Active 2 DOM
-
2026-06-15remarks 535-char remark
-
2026-06-15$125,000 Active 1 DOM
ⓘ Source: listings_history table (triggers on properties + properties_extension) + one-shot
backfill from property_details.listing_events for pre-trigger history.
Tax reassessment forecast FL · Resets to sale price
- Current annual tax
- $1,559 · $130/mo
- Projected year-2 tax
- $1,559 · $130/mo
- Expected delta
- $0/yr ($0/mo · 0.0%)
ⓘ Screening estimate from a state-policy table — verify with the county assessor before closing.
Climate risk First Street
- Flood 1/10 Low FEMA zone X (unshaded) · 0% chance over 30 yrs
- Wildfire 1/10 Low
- Heat 10/10 Extreme 7 d/yr ≥107°F today · 28 d/yr by 30 yrs out
- Wind 10/10 Extreme 99% chance of damaging wind over 30 yrs
- Air quality 3/10 Moderate 2 unhealthy d/yr today · 2 by 30 yrs out
Nearby sold comps map
Loading sold comps map…
Walkable amenities ~0.75 mi
Loading nearby amenities…
Taxation est. · year 1
- Rental income
- $22,849
- − Mortgage interest
- −$7,002
- − Property taxes
- −$1,559
- − Insurance
- −$625
- − Repairs & maintenance
- −$1,828
- − Management
- −$1,828
- − HOA
- −$6,300
- − Depreciation
- −$3,636
- Taxable income
- $71
- Est. tax owed @ 24.0%
- −$17
- After-tax cash flow
- $1,684/yr
For passive investors: Depreciation is non-cash, so a rental often shows a tax loss while cash-flowing — sheltering income. Rental losses are passive: they offset passive income freely, and up to $25,000/yr can offset ordinary (W-2) income if you actively participate and your MAGI is under $100k (phasing out to $0 by $150k); unused losses carry forward. On sale, claimed depreciation is recaptured at up to 25%, and gains may owe capital-gains tax (a 1031 exchange can defer both). Figures are a year-1 estimate at your 24.0% rate — not tax advice; consult a CPA.
Schools (NCES district)
- District
- Manatee
- NCES district ID
- 1201230
- Math proficiency
- 54% ▼ -6.00%
- Reading proficiency
- 50% ▼ -2.00%
- Median HH income
- $49,607
- Composite
- 44.43/100
- National rank
- #2806
- State rank
- #26 of 73 in FL
Livability — South Bradenton
- Score
- 77/100
- State rank
- #195
- US rank
- #3092
Category grades
Schools grade is shown separately in the Schools card above.
Census & demographics
- Census place
- South Bradenton, FL
- County
- Manatee County · 416,364 people
- Metro
- North Port-Sarasota-Bradenton, FL
- Population (ZIP)
- 34,081
- Household income
- $45,010
- Rent vs Own
- Severe rent burden
- 1474.0
Population outlook (Manatee County) Hauer SSP2
- Today (2025)
- 447,342 people
- By 2030
- 488,911 · +9.3%
- By 2040
- 567,934 · +27.0%
- By 2050
- 637,995 · +42.6%
- By 2075
- 781,970 · +74.8%
- By 2100
- 848,272 · +89.6%
Race, ethnicity, and origin ACS 2023
- Neighborhood character
- Diverse neighborhood (Simpson 0.57)
- Race & ethnicity
- White 58% Hispanic / Latino 29% Two or more races 13% Black 7%
- Hispanic origin (detail)
- Mexican 12% Puerto Rican 4% Cuban 3% Dominican 1%
- Common ancestry
- Lithuanian 3% Romanian 2% Slovak 2%
- Foreign-born
- 16% · Canada, Jamaica
- Languages at home
- 74% English-only · Spanish 22% Other Indo-European 1% French/Haitian/Cajun 1%
Political lean MEDSL · Manatee
- 2024 margin
- Strong R (+23.5) · D 37.9% · R 61.4%
- 2008→2024 swing
- -16.5pp toward R · 2008: -7.0pp · 2024: -23.5pp
- All cycles
- 2024: R+23.5 2020: R+16.1 2016: R+17.1 2012: R+12.5 2008: R+7.0
Not yet ingested
- Civics
- —
Market trends
- HPI YoY
- ▼ -305.32%
- Current HPI
- 369.9899
- Rent YoY
- ▼ -5.50%
- Metro
- North Port-Sarasota-Bradenton, FL
- State GDP YoY
- ▲ 3.28%
- F500 in state
- 36
Industry mix (Fortune 500 HQ in FL)
| Industry | F500 HQs | Revenue |
|---|---|---|
| Industrial Technology | 2 | $29B |
|
||
| Insurance | 2 | $17B |
|
||
| Retail | 1 | $60B |
|
||
| Technology Distribution | 1 | $58B |
|
||
| Homebuilding | 1 | $35B |
|
||
| Technology Manufacturing | 1 | $35B |
|
||
Price history
+204.9% since first listed19 events — show timeline
- 2026-06-15 Listed $125,000 Stellar MLS as Distributed by MLS Grid
- 2026-04-11 Price Changed $135,000 Stellar MLS as Distributed by MLS Grid
- 2026-03-31 Listing Removed — Stellar MLS as Distributed by MLS Grid
- 2026-01-10 Price Changed $145,000 Stellar MLS as Distributed by MLS Grid
- 2026-01-10 Relisted — Stellar MLS as Distributed by MLS Grid
- 2025-12-19 Listing Removed — Stellar MLS as Distributed by MLS Grid
- 2025-06-26 Listed $155,000 Stellar MLS as Distributed by MLS Grid
- 2021-11-01 Sold (Public Records) $100,000 Public Records
- 2021-10-29 Sold (MLS) $100,000 Stellar MLS as Distributed by MLS Grid
- 2021-09-15 Pending — Stellar MLS as Distributed by MLS Grid
- 2021-09-14 Price Changed $105,000 Stellar MLS as Distributed by MLS Grid
- 2021-09-10 Listed $120,000 Stellar MLS as Distributed by MLS Grid
- 2007-02-26 Sold (Public Records) $155,000 Public Records
- 2005-06-21 Sold (Public Records) $125,000 Public Records
- 2005-06-15 Sold (MLS) $125,000 Stellar MLS as Distributed by MLS Grid
- 2005-03-31 Listed $125,000 Stellar MLS as Distributed by MLS Grid
- 2003-06-12 Sold (Public Records) $64,000 Public Records
- 1999-06-29 Sold (Public Records) $45,000 Public Records
- 1996-12-17 Sold (Public Records) $41,000 Public Records
Property tax history
+17.0%/yrLatest (2025): $1,559 · -15.1% YoY. Source: county tax records.
Cash-flow waterfall
monthlySold comps — $/sqft
last 12 mo · ≤1 miLoading sold comps…