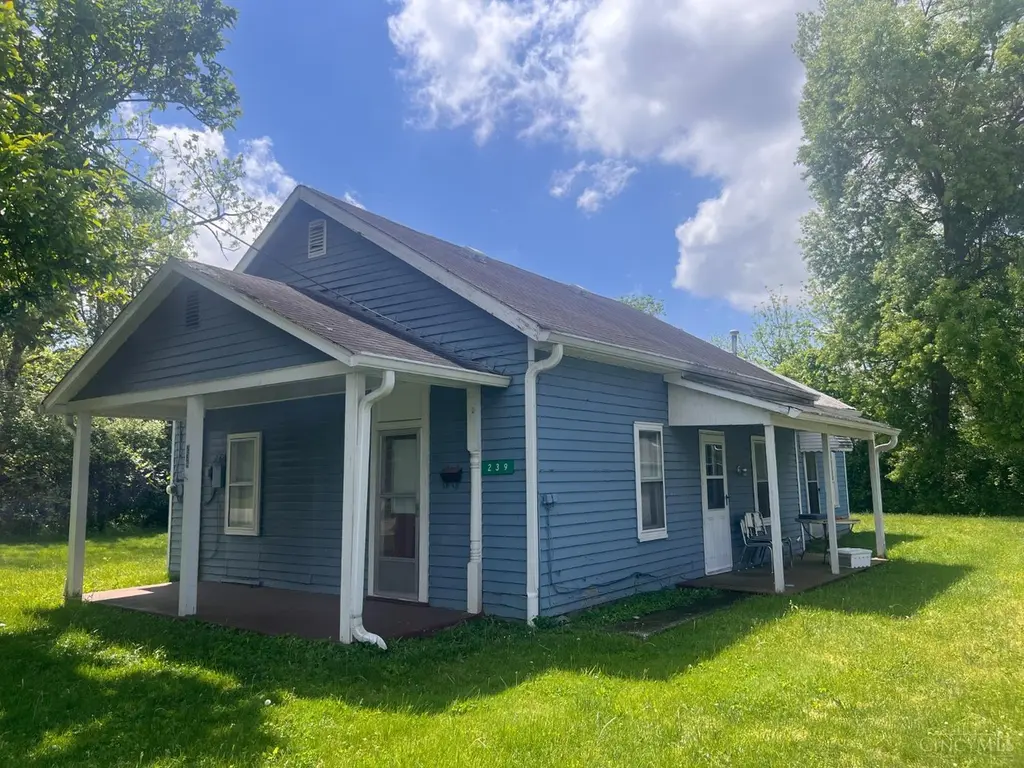
239 S Main St · Bethel, OH
Flood risk 1/10 · Minimal
- FEMA flood zone
- X (unshaded)
- Chance of flooding over 30 yrs
- 0.0%
- Est. flood insurance / yr
- $507 – $1,088
Fire risk 2/10 · Minimal
- Est. fire insurance / yr
- $713 – $1,323
Heat risk 4/10 · Minor
- Hot days now (above 101°F)
- 7 days/yr
- Hot days in 30 yrs
- 19 days/yr
Wind risk 2/10 · Minimal
- Chance of severe wind over 30 yrs
- 1.0%
Air-quality risk 2/10 · Minimal
- Unhealthy air days now
- 1 days/yr
- Unhealthy air days in 30 yrs
- 3 days/yr
Risk factors via First Street. Map © Google.
Why this score? — see what drove the B grade
The composite is a weighted blend of 9 inputs, each scored 0–100. Each bar is that input's sub-score; the figure is the points it added to the 100-point composite (weight × sub-score).
- Cash flow +30.0/30.0
- 1% rule +10.0/10.0
- DSCR +10.0/10.0
- ARV discount +7.5/15.0
- Schools +5.5/10.0
- Livability +3.3/5.0
- Rent growth +2.5/5.0
- Condition / age +2.5/5.0
- Appreciation +0.0/10.0
$79,900
🖨 Deal sheet 📄 Offer letter ✓ Due diligence
Listing remarks
Said to be the oldest home in Bethel, this diamond in the rough is affordable and ready for the right vision to be applied to it. Part of the Millman Homestead, the property is well known as the former carriage house belonging the owners of the Blue Haven which operated in the Village for decades.
Key facts
- 0.39 acre lot
- Built 1910
- Listed 42 days
Property features AI
Finance
- Other: Residential zoning; Located near State Route 125 in Bethel
- HOA & community: No HOA
Exterior
- Utilities: Public water; Public sewer; Natural gas
- Home design: Ranch-style single family home; One story; Stone foundation
- Construction: Other construction materials
- Exterior features: Wood windows; Shingle roof
Interior
- Bedrooms: Two bedrooms on the main level
- Bathrooms: One full bathroom on the main level
- Heating & cooling: Forced air heating; Electric water heater
- Interior features: Four total rooms; Crawl space basement
Neighborhood map
What this means for you Summary
Snapshot
- This is a 3-bed/1.0-bath single-family listed at $80k.
Deal economics
- At list price, monthly cash flow is $519 ($6k/yr) — positive.
- The deal already cash-flows at list — no discount required.
- Meets the 1% rule at list price ($1k rent vs $80k).
- Recommended offer: $78k (3.0% below list) — sets the bar for market timing.
- Cap rate 14.1% vs local median 3.1% in Bethel — top-decile yield for the area; either an underpriced asset or a hidden risk that comps aren't pricing in. Stress-test before assuming the spread holds.
Location & tenants
- Location reads 66/100 on livability (#685 in OH) — a middle-class / working-renter tenant base. Strengths: crime A+, cost of living A+, housing A+; Watch: amenities F, commute F, employment F.
- Bethel-Tate Local (town): math 61% / reading 67% proficiency, ranked #224 of 656 in OH (top 34%) — acceptable for families but not a draw, mixed tenant base, ~2y average lease.
- Market conditions: 26 active listings in the ZIP; 4 comparable units currently listed for rent nearby; rentals lingering (median 44d on market — plan ~5-8 weeks vacancy on turnover, expect pricing pressure); 50% of comp listings sitting > 30 days — soft ceiling on asking rent; 996 units permitted in Clermont County in 2024 (210 in 5+ unit buildings).
Forward outlook
- Local home prices are declining (-3.0%/yr); year-one equity from $552 of loan paydown is wiped out by about $2k of value loss. Plan a longer hold.
- At projected returns (-3.0% appreciation + 3.0% rent growth), your $22k cash investment doubles in ~5 years — after that, you're playing with house money.
Negotiation context
- It's been on market 42 days — a 3% lower offer ($78k) is reasonable based on typical stale-listing flexibility.
- Current owner paid $15k; list at $80k implies a 433% gain — meaningful room to come down on a strong offer.
Risks & watch-outs
- Watch-outs: built in 1910 — expect roof / HVAC / electrical / plumbing capex.
Questions for the listing agent
- It's been on market 42 days. Have you received any prior offers? Is the seller open to a 3% concession, seller financing, or rate buy-down credit?
- Built in 1910 — when were the roof, HVAC, electrical panel, plumbing, and water heater last replaced?
- Is there a deadline driving the sale (1031 exchange, divorce, estate, relocation)? That informs how much negotiation room exists.
- Schools are B-rated — typically a magnet for longer-tenancy family renters. What's the average tenant stay here, and is there a school-zone premium baked into asking?
- What's the average days-on-market for RENTAL listings here right now (not sales)? A rising rental-DOM trend means longer vacancies and softer asking-rent achievability than the comps imply.
- What's the recent tenant-quality profile in this submarket — average credit score on applications, eviction rate, late-payment / NSF rate, and stable-employment percentage? A property-management company in the area should have these aggregated.
- How much new for-sale + rental construction is in the pipeline within 1–3 miles? Heavy new supply typically softens prices + rents 12–24 months out; constrained supply supports both.
Investment metrics
- 1% rule
- 1.64% ✓
- Cap rate
- 14.09%
- Cash-on-cash
- 27.83%
- DSCR
- 2.24
- GRM
- 5.1
CMA / ARV
- ARV (median comp)
- $207,251
- List price
- $79,900
- Delta
- -61.45%
- Verdict
- UNDERPRICED
- Comps
- 20 within 1.0 mi
Show comp detail 12 sales within ~0.75 mi
| Address | Dist | Beds/Ba | Sqft | Sold | Price | $/sf | Match |
|---|---|---|---|---|---|---|---|
| 242 S Main St | 0.03mi | 3/2.0 | 1,038 (-1%) | 6mo | $232,000 | $224 | 88 |
| 225 N Ash St | 0.08mi | 2/1.0 (-1) | 1,080 (+3%) | 9mo | $160,000 | $148 | 80 |
| 226 N Ash St | 0.06mi | 2/1.0 (-1) | 1,152 (+10%) | 6mo | $179,000 | $155 | 71 |
| 239 N East St | 0.22mi | 2/1.5 (-1) | 1,020 (-3%) | 10mo | $185,000 | $181 | 70 |
| 316 N Ash St | 0.48mi | 3/1.0 | 1,092 (+4%) | 8mo | $185,000 | $169 | 65 |
| 236 N East St | 0.25mi | 3/1.0 | 904 (-14%) | 6mo | $199,900 | $221 | 60 |
| 310 S Union St | 0.48mi | 3/1.0 | 1,157 (+10%) | 3mo | $178,000 | $154 | 59 |
| 315 Faith Way | 0.71mi | 3/2.0 | 1,068 (+2%) | 8mo | $240,000 | $225 | 53 |
| 314 Faith Way | 0.68mi | 3/2.0 | 1,097 (+4%) | 6mo | $245,000 | $223 | 52 |
| 231 Rich St | 0.54mi | 3/2.0 | 960 (-9%) | 7mo | $200,000 | $208 | 50 |
| 517 S Union St | 0.71mi | 3/1.0 | 960 (-9%) | 9mo | $211,500 | $220 | 45 |
| 2662 Spring St | 0.66mi | 2/1.0 (-1) | 960 (-9%) | 9mo | $180,000 | $188 | 42 |
Match score weights: distance 35% · size 25% · config 20% · recency 20%. Top-matched comps best support the ARV.
Projected returns pro-forma
-3.0% appreciation · 3.0% rent growth · sell at horizon
- IRR
- 21.9%
- Equity multiple
- 1.90×
- Total profit
- $20,097
- Equity at exit
- $11,913
- IRR
- 30.0%
- Equity multiple
- 3.68×
- Total profit
- $60,042
- Equity at exit
- $6,908
Cash invested: $22,372 (down + closing). Projections, not guarantees.
Landlord ↔ Tenant lean methodology
- Overall (STATE)
- 73 Landlord-Friendly
- State Ohio
- 73 Landlord-Friendly · R+6
- County
- — inherits STATE
- City
- — inherits STATE
ZIP-level market 45106
- Home prices YoY
- -16.2%
- Active inventory
- 26
- Price-to-rent
- 5.1×
Monthly cashflow live
- Estimated rent
- $1,309 medium interval (Pro) →
- Mortgage (P&I)
- −$419
- Tax from tax record
- −$63 /mo · $755/yr
- Insurance
- −$33
- HOA
- −$0
- Vacancy / Maint / Mgmt
- −$275
- Net cashflow
- $519
Break-even live
UW: 25.0% down · 7.5% · 30yr · 1.5% tax · 5.0% vac · 8.0% maint · 8.0% mgmt
Financing live
Cash to close
- Down payment
- $19,975
- Closing costs
- $2,397
- Reserves months
- —
- Total cash needed
- —
Loan-product check · same deal, 3 products live
Conventional
25% down · 7.5% · 30yr
- Down + closing
- —
- Monthly P&I
- —
- Monthly cashflow
- —
- DSCR
- —
- Eligible?
- —
Personal DTI + credit; lowest rate.
DSCR
20% down · 8.5% · 30yr
- Down + closing
- —
- Monthly P&I
- —
- Monthly cashflow
- —
- DSCR
- —
- Eligible?
- —
No personal income docs; deal must DSCR.
Hard money
10% down · 12.0% · 12mo
- Down + closing
- —
- Monthly P&I
- —
- Monthly cashflow
- —
- DSCR
- —
- Eligible?
- —
Short-term bridge; refi at stabilization.
Rent comps 4 comps
| Address | Beds | Baths | Sqft | Rent | $/sqft | DOM | Units | Dist |
|---|---|---|---|---|---|---|---|---|
| 258 E Plane St Unit 9 Bethel, OH | 2.0 | 2.0 | 1000 | $1,050 | $1.05 | 2d | 1 | 0.43mi |
| 127 Rich St Bethel, OH | 3.0 | 1.0 | 1200 | $1,800 | $1.50 | 44d | 1 | 0.56mi |
| 544 S Charity St Unit 2 Bethel, OH | 2.0 | 1.0 | 750 | $1,250 | $1.67 | 44d | 1 | 0.78mi |
| 546 S Charity St Unit 4 Bethel, OH | 2.0 | 1.0 | 750 | $1,150 | $1.53 | 3d | 1 | 0.78mi |
Listing history 14 events
-
2026-06-18days on market $79,900 Active 42 DOM
-
2026-06-17days on market $79,900 Active 41 DOM
-
2026-06-16days on market $79,900 Active 40 DOM
-
2026-06-15days on market $79,900 Active 39 DOM
-
2026-06-13days on market $79,900 Active 37 DOM
-
2026-06-09days on market $79,900 Active 33 DOM
-
2026-06-08days on market $79,900 Active 32 DOM
-
2026-06-07pricedays on market $79,900 Active 31 DOM
-
2026-06-03days on market $89,900 Active 27 DOM
-
2026-06-02days on market $89,900 Active 26 DOM
-
2026-06-01days on market $89,900 Active 25 DOM
-
2026-05-31days on market $89,900 Active 24 DOM
-
2026-05-08$89,900 Active 299-char remark
-
1987-11-23soldstatus $15,000
ⓘ Source: listings_history table (triggers on properties + properties_extension) + one-shot
backfill from property_details.listing_events for pre-trigger history.
Tax reassessment forecast OH · Partial reset (capped growth)
- Current annual tax
- $755 · $63/mo
- Projected year-2 tax
- $1,001 · $83/mo
- Expected delta
- +$245/yr (+$20/mo · 32.5%)
ⓘ Screening estimate from a state-policy table — verify with the county assessor before closing.
Climate risk First Street
- Flood 1/10 Low FEMA zone X (unshaded) · 0% chance over 30 yrs
- Wildfire 2/10 Low
- Heat 4/10 Moderate 7 d/yr ≥101°F today · 19 d/yr by 30 yrs out
- Wind 2/10 Low 100% chance of damaging wind over 30 yrs
- Air quality 2/10 Low 1 unhealthy d/yr today · 3 by 30 yrs out
Nearby sold comps map
Loading sold comps map…
Walkable amenities ~0.75 mi
Loading nearby amenities…
Taxation est. · year 1
- Rental income
- $15,708
- − Mortgage interest
- −$4,476
- − Property taxes
- −$755
- − Insurance
- −$400
- − Repairs & maintenance
- −$1,257
- − Management
- −$1,257
- − Depreciation
- −$2,324
- Taxable income
- $5,240
- Est. tax owed @ 24.0%
- −$1,258
- After-tax cash flow
- $4,969/yr
For passive investors: Depreciation is non-cash, so a rental often shows a tax loss while cash-flowing — sheltering income. Rental losses are passive: they offset passive income freely, and up to $25,000/yr can offset ordinary (W-2) income if you actively participate and your MAGI is under $100k (phasing out to $0 by $150k); unused losses carry forward. On sale, claimed depreciation is recaptured at up to 25%, and gains may owe capital-gains tax (a 1031 exchange can defer both). Figures are a year-1 estimate at your 24.0% rate — not tax advice; consult a CPA.
Schools (NCES district)
- District
- Bethel-Tate Local
- NCES district ID
- 3904631
- Math proficiency
- 61% ▼ -11.00%
- Reading proficiency
- 67% ▼ -3.00%
- Median HH income
- $53,342
- Composite
- 54.7/100
- National rank
- #1326
- State rank
- #224 of 656 in OH
Livability — Bethel
- Score
- 66/100
- State rank
- #685
- US rank
- #12038
Category grades
Schools grade is shown separately in the Schools card above.
Census & demographics
- Census place
- Bethel, OH
- County
- Clermont · 218,829 people
- Metro
- Cincinnati, OH-KY-IN
- Population (ZIP)
- 11,096
- Household income
- $68,458
- Rent vs Own
- Severe rent burden
- 29.0
Population outlook (Clermont County) Hauer SSP2
- Today (2025)
- 210,162 people
- By 2030
- 212,463 · +1.1%
- By 2040
- 212,504 · +1.1%
- By 2050
- 205,957 · -2.0%
- By 2075
- 182,728 · -13.1%
- By 2100
- 143,986 · -31.5%
Race, ethnicity, and origin ACS 2023
- Neighborhood character
- Predominantly White (95%)
- Race & ethnicity
- White 95% Two or more races 3% Hispanic / Latino 2%
- Common ancestry
- Italian 3% Slovak 3% Serbian 2%
- Foreign-born
- 1% · Canada
- Languages at home
- 98% English-only · Other Indo-European 1% German/W. Germanic 1%
Political lean MEDSL · Clermont
- 2024 margin
- Solid R (+35.8) · D 31.7% · R 67.4%
- 2008→2024 swing
- -3.4pp toward R · 2008: -32.4pp · 2024: -35.8pp
- All cycles
- 2024: R+35.8 2020: R+36.6 2016: R+41.3 2012: R+35.5 2008: R+32.4
Not yet ingested
- Civics
- —
Market trends
- HPI YoY
- ▼ -62.74%
- Current HPI
- 324.3695
- Rent YoY
- —
- Metro
- —
- State GDP YoY
- ▲ 1.98%
- F500 in state
- 48
Industry mix (Fortune 500 HQ in OH)
| Industry | F500 HQs | Revenue |
|---|---|---|
| Insurance | 3 | $145B |
|
||
| Industrial Machinery | 3 | $49B |
|
||
| Financial Services | 3 | $24B |
|
||
| Consumer Goods | 2 | $93B |
|
||
| Aerospace / Defense | 2 | $47B |
|
||
| Utilities | 2 | $33B |
|
||
Price history
+432.7% since first listed3 events — show timeline
- 2026-06-03 Price Changed $79,900 Cincy MLS
- 2026-05-08 Listed $89,900 Cincy MLS
- 1987-11-23 Sold (Public Records) $15,000 Public Records
Property tax history
+4.3%/yrLatest (2025): $755 · -0.3% YoY. Source: county tax records.
Cash-flow waterfall
monthlySold comps — $/sqft
last 12 mo · ≤1 miLoading sold comps…