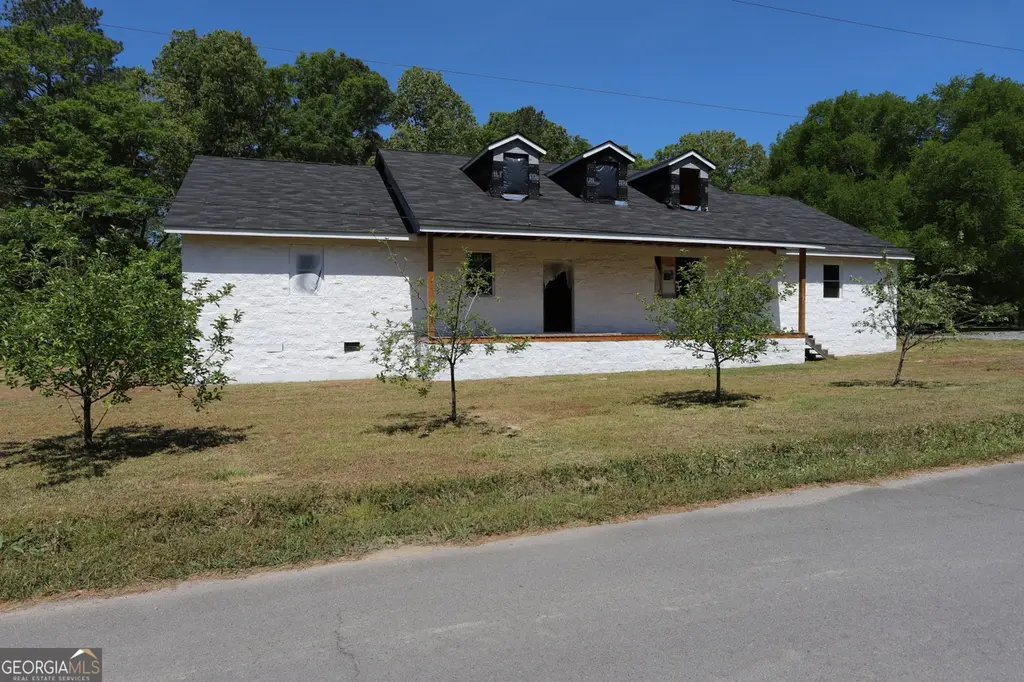
271 Cemetery Rd · Lyerly, GA
Flood risk No data
- FEMA flood zone
- —
- Chance of flooding over 30 yrs
- —
- Est. flood insurance / yr
- —
Fire risk No data
- Est. fire insurance / yr
- —
Heat risk No data
- Hot days now (above threshold)
- —
- Hot days in 30 yrs
- —
Wind risk No data
- Chance of severe wind over 30 yrs
- —
Air-quality risk No data
- Unhealthy air days now
- —
- Unhealthy air days in 30 yrs
- —
Risk factors via First Street. Map © Google.
Why this score? — see what drove the C+ grade
The composite is a weighted blend of 9 inputs, each scored 0–100. Each bar is that input's sub-score; the figure is the points it added to the 100-point composite (weight × sub-score).
- Cash flow +24.8/30.0
- DSCR +8.0/10.0
- ARV discount +7.5/15.0
- 1% rule +5.8/10.0
- Appreciation +5.8/10.0
- Livability +3.1/5.0
- Rent growth +2.5/5.0
- Condition / age +2.5/5.0
- Schools +1.8/10.0
$144,900
🖨 Deal sheet 📄 Offer letter ✓ Due diligence
Listing remarks MLS
Turn potential into value in Lyerly, GA. This partially completed home (construction started in 2023) offers a strong head start with a masonry exterior, unfinished hardwood in the home ready for installation, and roughly 90% of the wiring completed. Ideal for a custom build-out or investment project in a great location. Call today to book your private showing.
Key facts
- Investment project
- Unfinished hardwood
- Great location
Tags
Neighborhood map
What this means for you Summary
Snapshot
- This is a 7-bed/1.0-bath other listed at $145k.
Deal economics
- At list price, monthly cash flow is $305 ($4k/yr) — positive.
- The deal already cash-flows at list — no discount required.
- Meets the 1% rule at list price ($2k rent vs $145k).
- Recommended offer: $136k (6.0% below list) — sets the bar for market timing.
Location & tenants
- Location reads 62/100 on livability (#299 in GA) — a middle-class / working-renter tenant base. Strengths: cost of living A+, housing A-; Watch: schools F, crime F, amenities F.
- Chattooga County (rural): math 18% / reading 26% proficiency, ranked #140 of 174 in GA (top 80%) — low school quality limits family demand, transient renter base, plan for 1-2y turnover; 70% free/reduced lunch — lower-income household profile, screen leases tightly.
- Market conditions: 24 active listings in the ZIP; 2 units permitted in Chattooga County in 2024 (0 in 5+ unit buildings).
Forward outlook
- In year one you build about $3k of equity ($1k loan paydown + $2k appreciation (1.6% local appreciation)).
- Chattooga County population projected at -19% by 2050 — secular population decline; favor cash flow + early exit over multi-decade hold.
- At projected returns (1.6% appreciation + 3.0% rent growth), your $41k cash investment doubles in ~6 years — after that, you're playing with house money.
- By year 10, paydown + projected appreciation supports a ~$33k cash-out refi (75% LTV) — recoverable capital for the next deal without selling this one.
Negotiation context
- It's been on market 63 days — a 6% lower offer ($136k) is reasonable based on typical stale-listing flexibility.
- 6 sale attempts since 2y ago with the ask held roughly flat each time — persistent listings suggest the price (not the market) is what's stuck; bring a comps-based counter.
- Current owner paid $120k; 21% above their basis — modest negotiation headroom, anchor on the comps not their cost.
Questions for the listing agent
- It's been on market 63 days. Have you received any prior offers? Is the seller open to a 6% concession, seller financing, or rate buy-down credit?
- Why hasn't it sold? Are there any deal-killer items the seller is aware of (foundation, flood, title, zoning, code violations)?
- Is there a deadline driving the sale (1031 exchange, divorce, estate, relocation)? That informs how much negotiation room exists.
- Schools are F-rated, which usually means shorter tenancies and higher turnover. Who's the typical renter profile here, and what's been the actual vacancy rate?
- Crime grade is F in this area — have there been break-ins, vandalism, or insurance claims at this property in the last 3 years? What carrier currently insures it and at what premium?
- What's the average days-on-market for RENTAL listings here right now (not sales)? A rising rental-DOM trend means longer vacancies and softer asking-rent achievability than the comps imply.
- What's the recent tenant-quality profile in this submarket — average credit score on applications, eviction rate, late-payment / NSF rate, and stable-employment percentage? A property-management company in the area should have these aggregated.
- How much new for-sale + rental construction is in the pipeline within 1–3 miles? Heavy new supply typically softens prices + rents 12–24 months out; constrained supply supports both.
Investment metrics
- 1% rule
- 1.08% ✓
- Cap rate
- 8.82%
- Cash-on-cash
- 9.03%
- DSCR
- 1.40
- GRM
- 7.7
CMA / ARV
No comps found within radius.
Projected returns pro-forma
1.61% appreciation · 3.0% rent growth · sell at horizon
- IRR
- 12.4%
- Equity multiple
- 1.65×
- Total profit
- $26,538
- Equity at exit
- $54,155
- IRR
- 15.5%
- Equity multiple
- 2.99×
- Total profit
- $80,834
- Equity at exit
- $75,745
Cash invested: $40,572 (down + closing). Projections, not guarantees.
Landlord ↔ Tenant lean methodology
- Overall (STATE)
- 90 Strongly Landlord-Friendly
- State Georgia
- 90 Strongly Landlord-Friendly · R+3
- County
- — inherits STATE
- City
- — inherits STATE
ZIP-level market 30730
- Home prices YoY
- 1.6%
- Active inventory
- 24
- Price-to-rent
- 7.7×
Monthly cashflow live
- Estimated rent
- $1,559 medium interval (Pro) →
- Mortgage (P&I)
- −$760
- Tax from tax record
- −$106 /mo · $1,269/yr
- Insurance
- −$60
- HOA
- −$0
- Vacancy / Maint / Mgmt
- −$327
- Net cashflow
- $305
Break-even live
UW: 25.0% down · 7.5% · 30yr · 1.5% tax · 5.0% vac · 8.0% maint · 8.0% mgmt
Financing live
Cash to close
- Down payment
- $36,225
- Closing costs
- $4,347
- Reserves months
- —
- Total cash needed
- —
Loan-product check · same deal, 3 products live
Conventional
25% down · 7.5% · 30yr
- Down + closing
- —
- Monthly P&I
- —
- Monthly cashflow
- —
- DSCR
- —
- Eligible?
- —
Personal DTI + credit; lowest rate.
DSCR
20% down · 8.5% · 30yr
- Down + closing
- —
- Monthly P&I
- —
- Monthly cashflow
- —
- DSCR
- —
- Eligible?
- —
No personal income docs; deal must DSCR.
Hard money
10% down · 12.0% · 12mo
- Down + closing
- —
- Monthly P&I
- —
- Monthly cashflow
- —
- DSCR
- —
- Eligible?
- —
Short-term bridge; refi at stabilization.
Listing history 50 events
-
2026-06-19days on market $144,900 Active 63 DOM
-
2026-06-18days on market $144,900 Active 62 DOM
-
2026-06-17days on market $144,900 Active 61 DOM
-
2026-06-16days on market $144,900 Active 60 DOM
-
2026-06-15days on market $144,900 Active 59 DOM
-
2026-06-14days on market $144,900 Active 57 DOM
-
2026-06-13days on market $144,900 Active 56 DOM
-
2026-06-10days on market $144,900 Active 54 DOM
-
2026-06-09days on market $144,900 Active 53 DOM
-
2026-06-08days on market $144,900 Active 52 DOM
-
2026-06-07statusdays on market $144,900 Active 51 DOM
-
2026-06-05pricestatusdays on market $144,900 Price Change 48 DOM
-
2026-06-03days on market $149,900 Active 47 DOM
-
2026-06-02days on market $149,900 Active 46 DOM
-
2026-06-01days on market $149,900 Active 45 DOM
-
2026-05-31days on market $149,900 Active 44 DOM
-
2026-05-30days on market $149,900 Active 43 DOM
-
2026-04-14$149,900 New 363-char remark
Show marketing remark (363 chars)
Turn potential into value in Lyerly, GA. This partially completed home (construction started in 2023) offers a strong head start with a masonry exterior, unfinished hardwood in the home ready for installation, and roughly 90% of the wiring completed. Ideal for a custom build-out or investment project in a great location. Call today to book your private showing.
-
2025-07-10historical
-
2025-02-09price $169,900
-
2025-02-05price $169,900
-
2024-12-02$179,000 New
-
2024-12-02$179,000 Active
-
2024-09-10soldstatus $120,000
-
2024-09-06status Pending
-
2024-09-06status Under Contract
-
2024-09-06status Under Contract
-
2024-09-06soldstatus $120,000 Closed
-
2024-09-06soldstatus $120,000 Sold
-
2024-08-27price $149,995
-
2024-08-27price $149,995
-
2024-08-27price $149,995
-
2024-08-27price $149,995
-
2024-08-18price $169,995
-
2024-08-18price $169,995
-
2024-08-18price $169,995
-
2024-08-18price $169,995
-
2024-08-01price $174,500
-
2024-08-01price $174,500
-
2024-08-01price $174,500
-
2024-08-01price $174,500
-
2024-07-19price $189,995
-
2024-07-19price $189,995
-
2024-07-09price $199,995
-
2024-07-09price $199,995
-
2024-06-22price $229,900
-
2024-06-22price $229,900
-
2024-06-03$249,900 Active
-
2024-05-29$189,995 New
-
2024-05-29$249,900 New
ⓘ Source: listings_history table (triggers on properties + properties_extension) + one-shot
backfill from property_details.listing_events for pre-trigger history.
Tax reassessment forecast GA · Resets to sale price
- Current annual tax
- $1,269 · $106/mo
- Projected year-2 tax
- $1,333 · $111/mo
- Expected delta
- +$64/yr (+$5/mo · 5.0%)
ⓘ Screening estimate from a state-policy table — verify with the county assessor before closing.
Nearby sold comps map
Loading sold comps map…
Walkable amenities ~0.75 mi
Loading nearby amenities…
Taxation est. · year 1
- Rental income
- $18,704
- − Mortgage interest
- −$8,117
- − Property taxes
- −$1,269
- − Insurance
- −$724
- − Repairs & maintenance
- −$1,496
- − Management
- −$1,496
- − Depreciation
- −$4,215
- Taxable income
- $1,385
- Est. tax owed @ 24.0%
- −$332
- After-tax cash flow
- $3,331/yr
For passive investors: Depreciation is non-cash, so a rental often shows a tax loss while cash-flowing — sheltering income. Rental losses are passive: they offset passive income freely, and up to $25,000/yr can offset ordinary (W-2) income if you actively participate and your MAGI is under $100k (phasing out to $0 by $150k); unused losses carry forward. On sale, claimed depreciation is recaptured at up to 25%, and gains may owe capital-gains tax (a 1031 exchange can defer both). Figures are a year-1 estimate at your 24.0% rate — not tax advice; consult a CPA.
Schools (NCES district)
- District
- Chattooga County
- NCES district ID
- 1301080
- Math proficiency
- 18% ▼ -15.00%
- Reading proficiency
- 26% ▼ -9.00%
- Median HH income
- $33,123
- Composite
- 17.93/100
- National rank
- #8996
- State rank
- #140 of 174 in GA
Livability — Lyerly
- Score
- 62/100
- State rank
- #299
- US rank
- #16248
Category grades
Schools grade is shown separately in the Schools card above.
Census & demographics
- Census place
- Lyerly, GA
- Population (ZIP)
- 2,104
Population outlook (Chattooga County) Hauer SSP2
- Today (2025)
- 23,451 people
- By 2030
- 22,595 · -3.7%
- By 2040
- 20,808 · -11.3%
- By 2050
- 19,079 · -18.6%
- By 2075
- 15,131 · -35.5%
- By 2100
- 10,904 · -53.5%
Race, ethnicity, and origin ACS 2023
- Neighborhood character
- Predominantly White (89%)
- Race & ethnicity
- White 89% Two or more races 6% Black 5%
- Common ancestry
- Slovak 2% Italian 1% Iranian 1%
- Foreign-born
- 0% · South Korea
Political lean MEDSL · Chattooga
- 2024 margin
- Solid R (+64.2) · D 17.7% · R 81.9%
- 2008→2024 swing
- -28.4pp toward R · 2008: -35.8pp · 2024: -64.2pp
- All cycles
- 2024: R+64.2 2020: R+61.8 2016: R+58.8 2012: R+41.3 2008: R+35.8
Not yet ingested
- Civics
- —
Market trends
- HPI YoY
- ▲ 1.61%
- Current HPI
- 101.1495
- Rent YoY
- —
- Metro
- —
- State GDP YoY
- ▲ 2.66%
- F500 in state
- 28
Industry mix (Fortune 500 HQ in GA)
| Industry | F500 HQs | Revenue |
|---|---|---|
| Paper / Packaging | 2 | $29B |
|
||
| Retail | 1 | $160B |
|
||
| Transportation / Logistics | 1 | $91B |
|
||
| Airlines | 1 | $62B |
|
||
| Consumer Goods | 1 | $47B |
|
||
| Utilities | 1 | $25B |
|
||
Price history
-21.1% since first listed33 events — show timeline
- 2026-04-14 Listed $149,900 GAMLS
- 2025-07-10 Listing Removed — GAMLS
- 2025-02-09 Price Changed $169,900 FMLS
- 2025-02-05 Price Changed $169,900 GAMLS
- 2024-12-02 Listed $179,000 FMLS
- 2024-12-02 Listed $179,000 GAMLS
- 2024-09-10 Sold (Public Records) $120,000 Public Records
- 2024-09-06 Pending — FMLS
- 2024-09-06 Pending — GAMLS
- 2024-09-06 Pending — GAMLS
- 2024-09-06 Sold (MLS) $120,000 GAMLS
- 2024-09-06 Sold (MLS) $120,000 FMLS
- 2024-08-27 Price Changed $149,995 FMLS
- 2024-08-27 Price Changed $149,995 FMLS
- 2024-08-27 Price Changed $149,995 GAMLS
- 2024-08-27 Price Changed $149,995 GAMLS
- 2024-08-18 Price Changed $169,995 FMLS
- 2024-08-18 Price Changed $169,995 FMLS
- 2024-08-18 Price Changed $169,995 GAMLS
- 2024-08-18 Price Changed $169,995 GAMLS
- 2024-08-01 Price Changed $174,500 FMLS
- 2024-08-01 Price Changed $174,500 FMLS
- 2024-08-01 Price Changed $174,500 GAMLS
- 2024-08-01 Price Changed $174,500 GAMLS
- 2024-07-19 Price Changed $189,995 FMLS
- 2024-07-19 Price Changed $189,995 GAMLS
- 2024-07-09 Price Changed $199,995 FMLS
- 2024-07-09 Price Changed $199,995 GAMLS
- 2024-06-22 Price Changed $229,900 FMLS
- 2024-06-22 Price Changed $229,900 GAMLS
- 2024-06-03 Listed $249,900 FMLS
- 2024-05-29 Listed $249,900 GAMLS
- 2024-05-29 Listed $189,995 GAMLS
Property tax history
+24.0%/yrLatest (2025): $1,269 · +1734.0% YoY. Source: county tax records.
Cash-flow waterfall
monthlySold comps — $/sqft
last 12 mo · ≤1 miLoading sold comps…