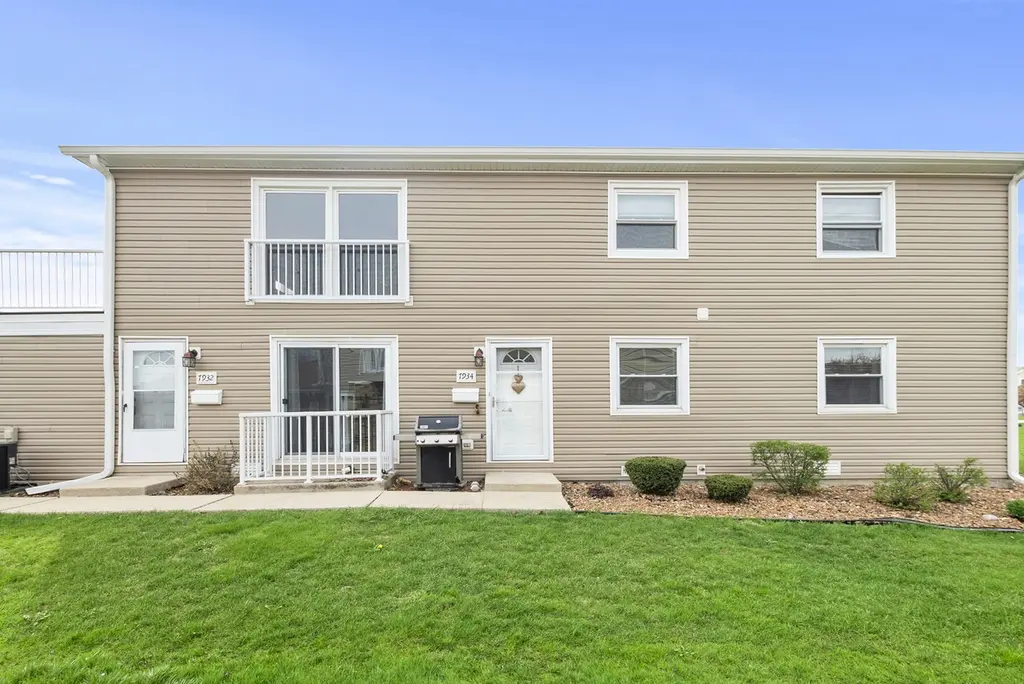
7934 164th Pl #7934 · Tinley Park, IL
Flood risk 1/10 · Minimal
- FEMA flood zone
- X (unshaded)
- Chance of flooding over 30 yrs
- 0.0%
- Est. flood insurance / yr
- $507 – $1,088
Fire risk 1/10 · Minimal
- Est. fire insurance / yr
- $804 – $1,492
Heat risk 3/10 · Minor
- Hot days now (above 102°F)
- 7 days/yr
- Hot days in 30 yrs
- 15 days/yr
Wind risk 2/10 · Minimal
- Chance of severe wind over 30 yrs
- —
Air-quality risk 4/10 · Minor
- Unhealthy air days now
- 4 days/yr
- Unhealthy air days in 30 yrs
- 5 days/yr
Risk factors via First Street. Map © Google.
Why this score? — see what drove the C- grade
The composite is a weighted blend of 9 inputs, each scored 0–100. Each bar is that input's sub-score; the figure is the points it added to the 100-point composite (weight × sub-score).
- Cash flow +19.5/30.0
- ARV discount +7.5/15.0
- 1% rule +6.6/10.0
- DSCR +6.2/10.0
- Livability +3.7/5.0
- Schools +3.4/10.0
- Rent growth +2.5/5.0
- Condition / age +2.5/5.0
- Appreciation +0.0/10.0
$219,000
🖨 Deal sheet 📄 Offer letter ✓ Due diligence
Listing remarks MLS
DESIRABLE 1ST FLOOR 3 BEDROOM, 1 BATH CONDO WITH ATTACHED 1 CAR GARAGE. SPACIOUS LAYOUT INCLUDES NEW KITCHEN CABINETS/COUNTERTOPS/HARDWARE AND FIXTURES. NEWER FURNACE. EASTERN EXPOSURE W/JULIET BALCONY IN LIVING ROOM. PROPERTY IS VERY MODERN AND MOVE-IN READY!
Key facts
- $244 HOA
- Garage
- Listed 63 days
Property features AI
Finance
- Other: Four-unit building; Not currently leased; Built before 1978: No
- HOA & community: Monthly association fee of $244; HOA covers insurance, exterior maintenance, lawn care, and snow removal; Pets allowed (cats and dogs permitted)
Exterior
- Parking: Attached garage (1 garage space); Two total parking spaces
- Utilities: Public water; Public sewer; Electric service with circuit breakers
- Home design: Attached single (condo); Entry level: 1
- Construction: Vinyl siding
- Exterior features: Common lot/grounds
Interior
- Kitchen: Range; Microwave; Dishwasher; Refrigerator; Eating area / table space
- Bedrooms: Three bedrooms (all on the main level)
- Flooring: Carpet in living room and bedrooms
- Bathrooms: One full bathroom
- Heating & cooling: Natural gas forced air heating; Central air conditioning
- Interior features: Five total rooms
- Laundry & utility: Washer; Dryer; Dedicated laundry room
Neighborhood map
What this means for you Summary
Snapshot
- This is a 3-bed/1.0-bath condo listed at $219k.
Deal economics
- At list price, monthly cash flow is $248 ($3k/yr) — positive.
- The deal already cash-flows at list — no discount required.
- Meets the 1% rule at list price ($3k rent vs $219k).
- Recommended offer: $206k (6.0% below list) — sets the bar for market timing.
- Cap rate 7.7% vs local median 4.3% in Tinley Park — top-decile yield for the area; either an underpriced asset or a hidden risk that comps aren't pricing in. Stress-test before assuming the spread holds.
Location & tenants
- Location reads 74/100 on livability (#246 in IL, #4,453 nationally) — a middle-class / working-renter tenant base. Strengths: commute A+, employment A+, housing A+; Watch: amenities F, health & safety F.
- Cons Hsd 230 (suburban): math 35% / reading 39% proficiency, ranked #146 of 620 in IL (top 24%) — families likely to look elsewhere, expect single-tenant / working-renter base with shorter leases.
- Market conditions: 151 active listings in the ZIP; 7 comparable units currently listed for rent nearby; rentals leasing fast (median 8d on market — plan ~1-2 weeks tenant-placement turnaround); solid renter incomes; 6,272 units permitted in Cook County in 2024 (4,658 in 5+ unit buildings).
- This rent runs 32% of the median local income ($95k/yr) — at the standard rent-burdened threshold; future hikes will face affordability resistance.
Forward outlook
- Local home prices are declining (-3.0%/yr); year-one equity from $2k of loan paydown is wiped out by about $7k of value loss. Plan a longer hold.
Negotiation context
- It's been on market 63 days — a 6% lower offer ($206k) is reasonable based on typical stale-listing flexibility.
- 2 sale attempts since 10y ago; this cycle's ask has dropped $16k (7%) from the opening price — seller is motivated, your offer sets the floor, not the list.
- Current owner paid $104k; list at $219k implies a 112% gain — meaningful room to come down on a strong offer.
Questions for the listing agent
- It's been on market 63 days. Have you received any prior offers? Is the seller open to a 6% concession, seller financing, or rate buy-down credit?
- What does the HOA fee cover, when was the last increase, and are there any pending special assessments or reserve-fund shortfalls?
- Any open or pending special assessments — roof, HVAC, plumbing, elevator, façade? What's the per-unit balance and payoff schedule, and is the seller paying it off at close or rolling it to the buyer?
- Why hasn't it sold? Are there any deal-killer items the seller is aware of (foundation, flood, title, zoning, code violations)?
- Is there a deadline driving the sale (1031 exchange, divorce, estate, relocation)? That informs how much negotiation room exists.
- What's the average days-on-market for RENTAL listings here right now (not sales)? A rising rental-DOM trend means longer vacancies and softer asking-rent achievability than the comps imply.
- What's the recent tenant-quality profile in this submarket — average credit score on applications, eviction rate, late-payment / NSF rate, and stable-employment percentage? A property-management company in the area should have these aggregated.
- How much new apartment / multifamily construction is in the pipeline within 1–3 miles? Heavy new supply (>2% of stock underway) typically softens rents 12–24 months out; light construction supports rent growth.
Investment metrics
- 1% rule
- 1.16% ✓
- Cap rate
- 7.65%
- Cash-on-cash
- 4.86%
- DSCR
- 1.22
- GRM
- 7.2
CMA / ARV
No comps found within radius.
Projected returns pro-forma
-3.0% appreciation · 3.0% rent growth · sell at horizon
- IRR
- -8.6%
- Equity multiple
- 0.68×
- Total profit
- $-19,478
- Equity at exit
- $32,654
- IRR
- 1.0%
- Equity multiple
- 1.07×
- Total profit
- $4,176
- Equity at exit
- $18,935
Cash invested: $61,320 (down + closing). Projections, not guarantees.
Landlord ↔ Tenant lean methodology
- Overall (STATE)
- 43 Moderately Tenant-Leaning
- State Illinois
- 43 Moderately Tenant-Leaning · D+7
- County
- — inherits STATE
- City
- — inherits STATE
ZIP-level market 60477
- Active inventory
- 151
- Price-to-rent
- 7.2×
Monthly cashflow live
- Estimated rent
- $2,539 high interval (Pro) →
- Mortgage (P&I)
- −$1,148
- Tax est. 1.5%
- −$274 /mo · $3,285/yr
- Insurance
- −$91
- HOA
- −$244
- Vacancy / Maint / Mgmt
- −$533
- Net cashflow
- $248
Break-even live
UW: 25.0% down · 7.5% · 30yr · 1.5% tax · 5.0% vac · 8.0% maint · 8.0% mgmt
Financing live
Cash to close
- Down payment
- $54,750
- Closing costs
- $6,570
- Reserves months
- —
- Total cash needed
- —
Loan-product check · same deal, 3 products live
Conventional
25% down · 7.5% · 30yr
- Down + closing
- —
- Monthly P&I
- —
- Monthly cashflow
- —
- DSCR
- —
- Eligible?
- —
Personal DTI + credit; lowest rate.
DSCR
20% down · 8.5% · 30yr
- Down + closing
- —
- Monthly P&I
- —
- Monthly cashflow
- —
- DSCR
- —
- Eligible?
- —
No personal income docs; deal must DSCR.
Hard money
10% down · 12.0% · 12mo
- Down + closing
- —
- Monthly P&I
- —
- Monthly cashflow
- —
- DSCR
- —
- Eligible?
- —
Short-term bridge; refi at stabilization.
Rent comps 7 comps
| Address | Beds | Baths | Sqft | Rent | $/sqft | DOM | Units | Dist |
|---|---|---|---|---|---|---|---|---|
| 16450 Cherry Hill Ave Tinley Park, IL | 3.0 | 2.0 | 1370 | $3,100 | $2.26 | 7d | 1 | 0.84mi |
| 16180 Apple Ln #2 Tinley Park, IL | 3.0 | 2.5 | 1250 | $2,900 | $2.32 | 5d | 1 | 0.86mi |
| 15834 Orlan Brook Dr Unit 3E Orland Park, IL | 2.0 | 1.0 | 1000 | $1,800 | $1.80 | 17d | 1 | 1.18mi |
| 16851 Harlem Ave Tinley Park, IL | 1.0–2.0 | 1.0–2.0 | 857 | $3,065 | $3.58 | 1d | 24 | 1.20mi |
| 15826 Farm Hill Dr Orland Park, IL | 3.0 | 1.5 | 1500 | $2,500 | $1.67 | 10d | 1 | 1.31mi |
| 15502 Orlan Brook Dr #222 Orland Park, IL | 2.0 | 2.0 | 1069 | $2,500 | $2.34 | 7d | 1 | 1.44mi |
| 15502 Orlan Brook Dr #222 Orland Park, IL | 2.0 | 2.0 | 1069 | $2,700 | $2.53 | 24d | 1 | 1.44mi |
HOA detail condo
- Monthly dues
- $244 · $2,928/yr
- Assessments
- None detected in remarks — confirm with the listing agent.
Listing history 20 events
-
2026-06-18days on market $219,000 Active 63 DOM
-
2026-06-17statusdays on market $219,000 Active 62 DOM
-
2026-06-16days on market $219,000 Contingent - Continue to Show 61 DOM
-
2026-06-15days on market $219,000 Contingent - Continue to Show 60 DOM
-
2026-06-13statusdays on market $219,000 Contingent - Continue to Show 58 DOM
-
2026-06-09days on market $219,000 Active 54 DOM
-
2026-06-08days on market $219,000 Active 53 DOM
-
2026-06-07days on market $219,000 Active 52 DOM
-
2026-06-04days on market $219,000 Active 49 DOM
-
2026-06-03days on market $219,000 Active 48 DOM
-
2026-06-02days on market $219,000 Active 47 DOM
-
2026-06-02price $219,000 Active 46 DOM
-
2026-06-01days on market $225,000 Active 46 DOM
-
2026-05-31days on market $225,000 Active 45 DOM
-
2026-05-13price $225,000
-
2026-04-23price $229,000
-
2026-04-16$235,000 Active
-
2016-06-13soldstatus $103,500 Closed Sale 260-char remark
Show marketing remark (260 chars)
DESIRABLE 1ST FLOOR 3 BEDROOM, 1 BATH CONDO WITH ATTACHED 1 CAR GARAGE. SPACIOUS LAYOUT INCLUDES NEW KITCHEN CABINETS/COUNTERTOPS/HARDWARE AND FIXTURES. NEWER FURNACE. EASTERN EXPOSURE W/JULIET BALCONY IN LIVING ROOM. PROPERTY IS VERY MODERN AND MOVE-IN READY!
-
2016-05-02status Contingent (Do Not Show) 260-char remark
Show marketing remark (260 chars)
DESIRABLE 1ST FLOOR 3 BEDROOM, 1 BATH CONDO WITH ATTACHED 1 CAR GARAGE. SPACIOUS LAYOUT INCLUDES NEW KITCHEN CABINETS/COUNTERTOPS/HARDWARE AND FIXTURES. NEWER FURNACE. EASTERN EXPOSURE W/JULIET BALCONY IN LIVING ROOM. PROPERTY IS VERY MODERN AND MOVE-IN READY!
-
2016-04-08$103,500 New 260-char remark
Show marketing remark (260 chars)
DESIRABLE 1ST FLOOR 3 BEDROOM, 1 BATH CONDO WITH ATTACHED 1 CAR GARAGE. SPACIOUS LAYOUT INCLUDES NEW KITCHEN CABINETS/COUNTERTOPS/HARDWARE AND FIXTURES. NEWER FURNACE. EASTERN EXPOSURE W/JULIET BALCONY IN LIVING ROOM. PROPERTY IS VERY MODERN AND MOVE-IN READY!
ⓘ Source: listings_history table (triggers on properties + properties_extension) + one-shot
backfill from property_details.listing_events for pre-trigger history.
Climate risk First Street
- Flood 1/10 Low FEMA zone X (unshaded) · 0% chance over 30 yrs
- Wildfire 1/10 Low
- Heat 3/10 Moderate 7 d/yr ≥102°F today · 15 d/yr by 30 yrs out
- Wind 2/10 Low
- Air quality 4/10 Moderate 4 unhealthy d/yr today · 5 by 30 yrs out
Nearby sold comps map
Loading sold comps map…
Walkable amenities ~0.75 mi
Loading nearby amenities…
Taxation est. · year 1
- Rental income
- $30,469
- − Mortgage interest
- −$12,267
- − Property taxes
- −$3,285
- − Insurance
- −$1,095
- − Repairs & maintenance
- −$2,438
- − Management
- −$2,438
- − HOA
- −$2,928
- − Depreciation
- −$6,371
- Taxable loss
- −$352
- Est. tax savings @ 24.0%
- +$85
- After-tax cash flow
- $3,065/yr
For passive investors: Depreciation is non-cash, so a rental often shows a tax loss while cash-flowing — sheltering income. Rental losses are passive: they offset passive income freely, and up to $25,000/yr can offset ordinary (W-2) income if you actively participate and your MAGI is under $100k (phasing out to $0 by $150k); unused losses carry forward. On sale, claimed depreciation is recaptured at up to 25%, and gains may owe capital-gains tax (a 1031 exchange can defer both). Figures are a year-1 estimate at your 24.0% rate — not tax advice; consult a CPA.
Schools (NCES district)
- District
- Cons Hsd 230
- NCES district ID
- 1708400
- Math proficiency
- 35% ▼ -8.00%
- Reading proficiency
- 39% ▼ -6.00%
- Median HH income
- $73,953
- Composite
- 34.29/100
- National rank
- #5244
- State rank
- #146 of 620 in IL
Livability — Tinley Park
- Score
- 74/100
- State rank
- #246
- US rank
- #4453
Category grades
Schools grade is shown separately in the Schools card above.
Census & demographics
- Census place
- Tinley Park, IL
- County
- Cook County · 4,486,803 people
- City population
- 35,976
- Metro
- Chicago-Naperville-Elgin, IL-IN-WI
- Population (ZIP)
- 35,976
- Household income
- $94,927
- Rent vs Own
- Severe rent burden
- 753.0
Population outlook (Cook County) Hauer SSP2
- Today (2025)
- 5,347,519 people
- By 2030
- 5,357,703 · +0.2%
- By 2040
- 5,324,924 · -0.4%
- By 2050
- 5,230,762 · -2.2%
- By 2075
- 4,785,735 · -10.5%
- By 2100
- 4,188,836 · -21.7%
Race, ethnicity, and origin ACS 2023
- Neighborhood character
- Predominantly White (74%)
- Race & ethnicity
- White 74% Hispanic / Latino 12% Two or more races 9% Black 7% Asian 3%
- Hispanic origin (detail)
- Mexican 9% Puerto Rican 2%
- Common ancestry
- Romanian 14% Iranian 3% Lithuanian 2%
- Foreign-born
- 9% · Canada, China
- Languages at home
- 85% English-only · Spanish 6% Arabic 5% Other Indo-European 1%
Political lean MEDSL · Cook
- 2024 margin
- Solid D (+42.0) · D 70.4% · R 28.4% · Other 1.2%
- 2008→2024 swing
- -11.4pp toward R · 2008: 53.4pp · 2024: 42.0pp
- All cycles
- 2024: D+42.0 2020: D+50.3 2016: D+53.0 2012: D+49.4 2008: D+53.4
Not yet ingested
- Civics
- —
Market trends
- HPI YoY
- ▼ -272.64%
- Current HPI
- 190.7548
- Rent YoY
- —
- Metro
- Chicago-Naperville-Elgin, IL-IN-WI
- State GDP YoY
- ▲ 1.59%
- F500 in state
- 60
Industry mix (Fortune 500 HQ in IL)
| Industry | F500 HQs | Revenue |
|---|---|---|
| Insurance | 4 | $201B |
|
||
| Consumer Goods | 4 | $87B |
|
||
| Industrial Machinery | 3 | $64B |
|
||
| Healthcare | 2 | $55B |
|
||
| Retail / Pharmacy | 1 | $148B |
|
||
| Agriculture / Food | 1 | $86B |
|
||
Price history
+117.4% since first listed6 events — show timeline
- 2026-05-13 Price Changed $225,000 MRED as Distributed by MLS Grid
- 2026-04-23 Price Changed $229,000 MRED as Distributed by MLS Grid
- 2026-04-16 Listed $235,000 MRED as Distributed by MLS Grid
- 2016-06-13 Sold (MLS) $103,500 MRED as Distributed by MLS Grid
- 2016-05-02 Pending — MRED as Distributed by MLS Grid
- 2016-04-08 Listed $103,500 MRED as Distributed by MLS Grid
Cash-flow waterfall
monthlySold comps — $/sqft
last 12 mo · ≤1 miLoading sold comps…