304 Zion Ct · San Rafael, CA
Flood risk No data
- FEMA flood zone
- —
- Chance of flooding over 30 yrs
- —
- Est. flood insurance / yr
- —
Fire risk No data
- Est. fire insurance / yr
- —
Heat risk No data
- Hot days now (above threshold)
- —
- Hot days in 30 yrs
- —
Wind risk No data
- Chance of severe wind over 30 yrs
- —
Air-quality risk No data
- Unhealthy air days now
- —
- Unhealthy air days in 30 yrs
- —
Risk factors via First Street. Map © Google.
Why this score? — see what drove the C+ grade
The composite is a weighted blend of 9 inputs, each scored 0–100. Each bar is that input's sub-score; the figure is the points it added to the 100-point composite (weight × sub-score).
- Cash flow +25.3/30.0
- DSCR +8.3/10.0
- ARV discount +8.1/15.0
- 1% rule +6.6/10.0
- Schools +4.6/10.0
- Condition / age +4.0/5.0
- Livability +3.3/5.0
- Rent growth +2.9/5.0
- Appreciation +0.0/10.0
$347,000
🖨 Deal sheet 📄 Offer letter ✓ Due diligence
Listing remarks
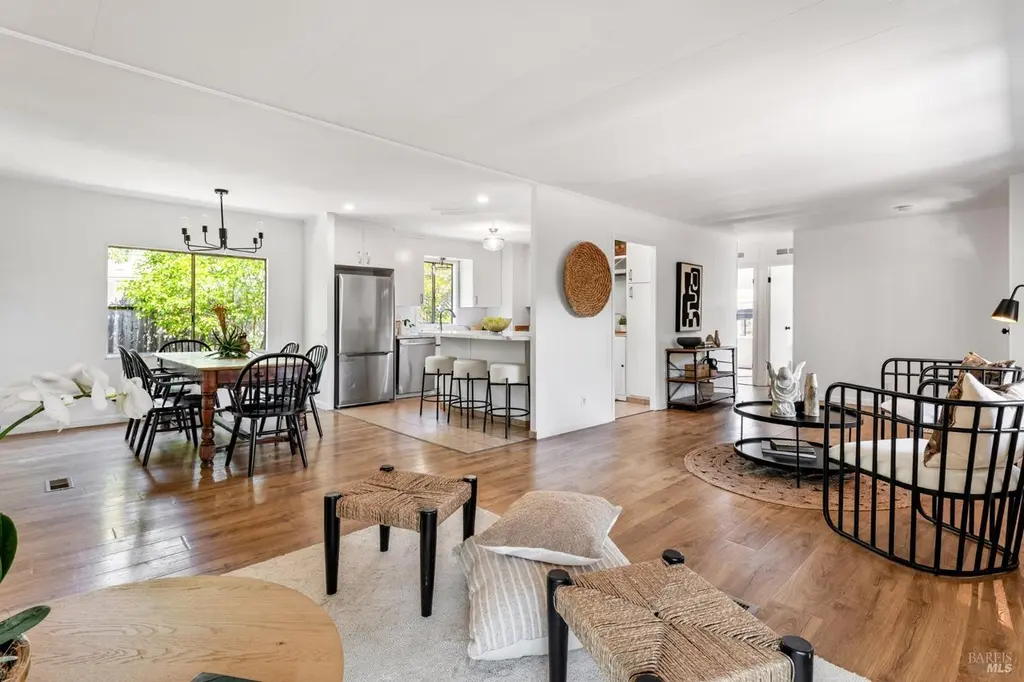
Spacious and inviting double-wide mobile home tucked away on a quiet cul-de-sac in desirable North San Rafael. This well-maintained residence offers approximately 1,400 sq ft of comfortable living space with 3 bedrooms and 2 bathrooms, featuring an open-concept living and dining area filled with natural light. The functional floor plan includes a generous primary suite, ample storage, and seamless indoor-outdoor flow for relaxed Marin living. Situated on a larger-than-average lot within the community, the property offers added outdoor space, privacy, and flexibility rarely found in the complex. Located in the highly sought-after Contempo Marin community, residents enjoy resort-style ameniti
Key facts
- Indoor-outdoor flow
- Quiet cul-de-sac
- Open-concept living
Tags
Property features AI
Finance
- HOA & community: No homeowners association; Not a senior community; Located in Contempo Marin park; Land lease (yes) with monthly land lease amount of $1,806
Exterior
- Parking: Covered off-street parking for 2
- Utilities: Natural gas connected; Public sewer
- Home design: Manufactured in-park (double wide); Updated/remodeled condition
- Construction: Manufacturer: Lancer (Lancer HM); Skirt: wood/unknown
- Exterior features: Covered patio; Porch; Carport awning; Fenced yard; Garden
Interior
- Kitchen: Dishwasher; Free standing gas range; Free standing refrigerator
- Bedrooms: 3 bedrooms
- Bathrooms: 2 full bathrooms with double sinks, shower stall(s), and tub with shower over
- Heating & cooling: Central heating; No cooling
- Interior features: Updated/remodeled interior; Great room; Kitchen/family combo
- Laundry & utility: Stacked washer and dryer included
Neighborhood map
What this means for you Summary
Snapshot
- This is a 3-bed/2.0-bath manufactured listed at $347k. Condition is rated good.
Deal economics
- At list price, monthly cash flow is $788 ($9k/yr) — positive.
- The deal already cash-flows at list — no discount required.
- Meets the 1% rule at list price ($4k rent vs $347k).
- Recommended offer: $342k (1.5% below list) — sets the bar for market timing.
- Cap rate 9.0% vs local median 1.7% in San Rafael — top-decile yield for the area; either an underpriced asset or a hidden risk that comps aren't pricing in. Stress-test before assuming the spread holds.
Location & tenants
- Location reads 66/100 on livability (#358 in CA) — a middle-class / working-renter tenant base. Strengths: commute A+, employment A+, health & safety B+; Watch: schools C-, crime F, amenities F.
- San Rafael City High (urban): math 43% / reading 56% proficiency, ranked #126 of 517 in CA (top 24%) — families likely to look elsewhere, expect single-tenant / working-renter base with shorter leases.
- Market conditions: Rents rising (+1.6%/yr); 121 active listings in the ZIP; 18 comparable units currently listed for rent nearby; rentals leasing fast (median 3d on market — plan ~1-2 weeks tenant-placement turnaround); high-income renter base; 149 units permitted in Marin County in 2024 (5 in 5+ unit buildings).
- This rent runs 34% of the median local income ($142k/yr) — at the standard rent-burdened threshold; future hikes will face affordability resistance.
Forward outlook
- Local home prices are declining (-3.0%/yr); year-one equity from $2k of loan paydown is wiped out by about $10k of value loss. Plan a longer hold.
- Marin County population projected at +9% by 2050 — modest demand growth; plan on rents tracking national, not racing it.
Negotiation context
- It's been on market 15 days — a 2% lower offer ($342k) is reasonable based on typical stale-listing flexibility.
Questions for the listing agent
- Built in 1974 — when were the roof, HVAC, electrical panel, plumbing, and water heater last replaced?
- Is there a deadline driving the sale (1031 exchange, divorce, estate, relocation)? That informs how much negotiation room exists.
- Crime grade is F in this area — have there been break-ins, vandalism, or insurance claims at this property in the last 3 years? What carrier currently insures it and at what premium?
- What's the average days-on-market for RENTAL listings here right now (not sales)? A rising rental-DOM trend means longer vacancies and softer asking-rent achievability than the comps imply.
- What's the recent tenant-quality profile in this submarket — average credit score on applications, eviction rate, late-payment / NSF rate, and stable-employment percentage? A property-management company in the area should have these aggregated.
- How much new for-sale + rental construction is in the pipeline within 1–3 miles? Heavy new supply typically softens prices + rents 12–24 months out; constrained supply supports both.
Investment metrics
- 1% rule
- 1.16% ✓
- Cap rate
- 9.02%
- Cash-on-cash
- 9.74%
- DSCR
- 1.43
- GRM
- 7.2
CMA / ARV
- ARV (on-the-fly)
- $351,360
- Comps found
- 12
Show comp detail 12 sales within ~0.75 mi
| Address | Dist | Beds/Ba | Sqft | Sold | Price | $/sf | Match |
|---|---|---|---|---|---|---|---|
| 304 Zion Ct | 0.00mi | 3/2.0 | 1,440 (0%) | 1mo | $275,000 | $191 | 100 |
| 275 Carlsbad Ct | 0.06mi | 4/2.0 (+1) | 1,440 (0%) | 4mo | $380,000 | $264 | 89 |
| 290 Yosemite Rd | 0.03mi | 2/2.0 (-1) | 1,440 (0%) | 15mo | $340,000 | $236 | 81 |
| 243 Teton Ct | 0.14mi | 3/2.0 | 1,344 (-7%) | 6mo | $180,000 | $134 | 77 |
| 337 Acadia Ln | 0.16mi | 3/2.0 | 1,352 (-6%) | 10mo | $190,000 | $141 | 74 |
| 37 Yosemite Rd | 0.19mi | 3/2.0 | 1,560 (+8%) | 9mo | $460,000 | $295 | 70 |
| 239 Teton Ct | 0.19mi | 3/2.0 | 1,620 (+12%) | 2mo | $505,000 | $312 | 69 |
| 352 Acadia Ln | 0.11mi | 2/2.0 (-1) | 1,536 (+7%) | 17mo | $375,000 | $244 | 65 |
| 45 Yosemite Rd | 0.09mi | 3/2.0 | 1,236 (-14%) | 10mo | $409,000 | $331 | 64 |
| 20 Yosemite Rd | 0.33mi | 3/2.0 | 1,344 (-7%) | 17mo | $280,000 | $208 | 59 |
| 223 Olympic Way | 0.22mi | 3/2.0 | 1,236 (-14%) | 10mo | $350,000 | $283 | 58 |
| 210 Olympic Way | 0.28mi | 2/2.0 (-1) | 1,536 (+7%) | 20mo | $267,000 | $174 | 55 |
Match score weights: distance 35% · size 25% · config 20% · recency 20%. Top-matched comps best support the ARV.
Projected returns pro-forma
-3.0% appreciation · 1.62% rent growth · sell at horizon
- IRR
- -3.2%
- Equity multiple
- 0.88×
- Total profit
- $-11,477
- Equity at exit
- $51,739
- IRR
- 4.9%
- Equity multiple
- 1.34×
- Total profit
- $32,865
- Equity at exit
- $30,002
Cash invested: $97,160 (down + closing). Projections, not guarantees.
Landlord ↔ Tenant lean methodology
- Overall (STATE)
- 18 Strongly Tenant-Friendly
- State California
- 18 Strongly Tenant-Friendly · D+13
- County
- — inherits STATE
- City
- — inherits STATE
ZIP-level market 94903
- Rents YoY
- 1.6%
- Active inventory
- 121
- Price-to-rent
- 7.2×
Monthly cashflow live
- Estimated rent
- $4,034 high interval (Pro) →
- Mortgage (P&I)
- −$1,820
- Tax est. 1.5%
- −$434 /mo · $5,205/yr
- Insurance
- −$145
- HOA
- −$0
- Vacancy / Maint / Mgmt
- −$847
- Net cashflow
- $788
Break-even live
UW: 25.0% down · 7.5% · 30yr · 1.5% tax · 5.0% vac · 8.0% maint · 8.0% mgmt
Financing live
Cash to close
- Down payment
- $86,750
- Closing costs
- $10,410
- Reserves months
- —
- Total cash needed
- —
Loan-product check · same deal, 3 products live
Conventional
25% down · 7.5% · 30yr
- Down + closing
- —
- Monthly P&I
- —
- Monthly cashflow
- —
- DSCR
- —
- Eligible?
- —
Personal DTI + credit; lowest rate.
DSCR
20% down · 8.5% · 30yr
- Down + closing
- —
- Monthly P&I
- —
- Monthly cashflow
- —
- DSCR
- —
- Eligible?
- —
No personal income docs; deal must DSCR.
Hard money
10% down · 12.0% · 12mo
- Down + closing
- —
- Monthly P&I
- —
- Monthly cashflow
- —
- DSCR
- —
- Eligible?
- —
Short-term bridge; refi at stabilization.
Rent comps 18 comps
| Address | Beds | Baths | Sqft | Rent | $/sqft | DOM | Units | Dist |
|---|---|---|---|---|---|---|---|---|
| 255 Channing Way San Rafael, CA | 2.0 | 1.0 | 1000 | $3,195 | $3.19 | 1d | 1 | 0.21mi |
| 300 Channing Way San Rafael, CA | 2.0 | 1.0 | 722 | $3,127 | $4.33 | 1d | 7 | 0.29mi |
| 108 Professional Center Pkwy San Rafael, CA | 3.0 | 2.0 | 1200 | $3,195 | $2.66 | 1d | 1 | 0.29mi |
| 95 Professional Center Pkwy San Rafael, CA | 1.0–2.0 | 1.0–2.0 | 1040 | $3,850 | $3.70 | 1d | 4 | 0.31mi |
| 10 Professional Center Pkwy #26 San Rafael, CA | 2.0 | 1.5 | 1107 | $3,300 | $2.98 | 24d | 1 | 0.46mi |
| 100 Marin Center Dr #64 San Rafael, CA | 2.0 | 1.5 | 1112 | $3,325 | $2.99 | 5d | 1 | 0.48mi |
| 219 Mark Twain Ave San Rafael, CA | 3.0 | 2.0 | 1601 | $5,850 | $3.65 | 2d | 1 | 0.51mi |
| 267 Orris Ter San Rafael, CA | 3.0 | 2.0 | 1432 | $5,000 | $3.49 | 24d | 1 | 0.73mi |
| 2500 Deer Valley Rd San Rafael, CA | 1.0–3.0 | 1.0–2.0 | 932 | $4,267 | $4.58 | 1d | 7 | 0.81mi |
| 1001 Cresta Way San Rafael, CA | 1.0–3.0 | 1.0–2.0 | 1025 | $4,681 | $4.57 | 1d | 21 | 0.87mi |
| 20 North Ave San Rafael, CA | 1.0–2.0 | 1.0 | 796 | $3,625 | $4.55 | 1d | 3 | 0.94mi |
| 41 Pine Tree Ct San Rafael, CA | 3.0 | 2.5 | 1587 | $5,500 | $3.47 | 10d | 1 | 0.97mi |
| 53 Labrea Way San Rafael, CA | 3.0 | 2.0 | 1220 | $5,800 | $4.75 | 17d | 1 | 0.97mi |
| 124 Merrydale Rd San Rafael, CA | 2.0 | 1.0 | 950 | $2,800 | $2.95 | 12d | 1 | 1.06mi |
| 175 Nova Albion Way San Rafael, CA | 2.0 | 1.0–2.0 | 704 | $3,550 | $5.04 | 1d | 7 | 1.07mi |
| 33 San Pablo Ave San Rafael, CA | 1.0–2.0 | 1.0–2.0 | 1581 | $4,995 | $3.16 | 1d | 3 | 1.11mi |
| 868 Las Pavadas Ave San Rafael, CA | 4.0 | 2.0 | 1595 | $5,500 | $3.45 | 22d | 1 | 1.33mi |
| 648 Tanbark Ter San Rafael, CA | 3.0 | 2.0 | 1332 | $5,250 | $3.94 | 19d | 1 | 1.44mi |
Listing history 4 events
-
2026-05-22status Pending
-
2026-05-13historical Contingent (Show)
-
2026-05-13status Pending
-
2026-05-07$347,000 Active
ⓘ Source: listings_history table (triggers on properties + properties_extension) + one-shot
backfill from property_details.listing_events for pre-trigger history.
Nearby sold comps map
Loading sold comps map…
Walkable amenities ~0.75 mi
Loading nearby amenities…
Taxation est. · year 1
- Rental income
- $48,402
- − Mortgage interest
- −$19,437
- − Property taxes
- −$5,205
- − Insurance
- −$1,735
- − Repairs & maintenance
- −$3,872
- − Management
- −$3,872
- − Depreciation
- −$10,095
- Taxable income
- $4,186
- Est. tax owed @ 24.0%
- −$1,005
- After-tax cash flow
- $8,457/yr
For passive investors: Depreciation is non-cash, so a rental often shows a tax loss while cash-flowing — sheltering income. Rental losses are passive: they offset passive income freely, and up to $25,000/yr can offset ordinary (W-2) income if you actively participate and your MAGI is under $100k (phasing out to $0 by $150k); unused losses carry forward. On sale, claimed depreciation is recaptured at up to 25%, and gains may owe capital-gains tax (a 1031 exchange can defer both). Figures are a year-1 estimate at your 24.0% rate — not tax advice; consult a CPA.
Condition & rehab AI · 12 photos
This well-maintained and updated mobile home offers a spacious and inviting living space with modern finishes and a functional floor plan. It is ready for immediate occupancy and can be further enhanced with minor updates to increase its value.
Value-add opportunities
- Resale Paint touch-ups — Fresh paint enhances the home's curb appeal and can make it more attractive to potential buyers
- Both Landscaping improvements — Enhanced landscaping can improve the home's curb appeal and add value for both resale and rental
- Resale Kitchen appliances — Upgrading to more modern or energy-efficient appliances can increase the home's appeal and value
- Resale Bathroom updates — Updating bathrooms with modern fixtures and finishes can significantly increase the home's resale value
Renovation cost estimate screening
Value-add ROI direction
- Resale Paint touch-ups — Fresh paint enhances the home's curb appeal and can make it more attractive to potential buyers ↑
- Both Landscaping improvements — Enhanced landscaping can improve the home's curb appeal and add value for both resale and rental ↑
- Resale Kitchen appliances — Upgrading to more modern or energy-efficient appliances can increase the home's appeal and value ↑
- Resale Bathroom updates — Updating bathrooms with modern fixtures and finishes can significantly increase the home's resale value ↑
ⓘ Cost ranges are severity-bucket heuristics (US national rule-of-thumb). Get contractor quotes + a written scope before underwriting a rehab budget.
Schools (NCES district)
- District
- San Rafael City High
- NCES district ID
- 0635110
- Math proficiency
- 43% ▲ 8.00%
- Reading proficiency
- 56% ▲ 4.00%
- Median HH income
- $84,104
- Composite
- 45.58/100
- National rank
- #2594
- State rank
- #126 of 517 in CA
Livability — San Rafael
- Score
- 66/100
- State rank
- #358
- US rank
- #12194
Category grades
Schools grade is shown separately in the Schools card above.
Census & demographics
- Census place
- San Rafael, CA
- County
- Marin County · 243,328 people
- City population
- 71,922
- Metro
- San Francisco-Oakland-Berkeley, CA
- Population (ZIP)
- 30,615
- Household income
- $142,083
- Rent vs Own
- Severe rent burden
- 1414.0
Population outlook (Marin County) Hauer SSP2
- Today (2025)
- 276,379 people
- By 2030
- 282,942 · +2.4%
- By 2040
- 292,937 · +6.0%
- By 2050
- 300,449 · +8.7%
- By 2075
- 316,946 · +14.7%
- By 2100
- 303,948 · +10.0%
Race, ethnicity, and origin ACS 2023
- Neighborhood character
- Predominantly White (65%)
- Race & ethnicity
- White 65% Hispanic / Latino 19% Two or more races 10% Asian 6% Black 4%
- Hispanic origin (detail)
- Mexican 10% Puerto Rican 2%
- Common ancestry
- Italian 4% Lithuanian 3% Scotch-Irish 2%
- Foreign-born
- 21% · Canada, China, South Korea
- Languages at home
- 77% English-only · Spanish 11% Other Indo-European 3% Korean 1%
Political lean MEDSL · Marin
- 2024 margin
- Solid D (+63.9) · D 80.6% · R 16.7% · Other 2.7%
- 2008→2024 swing
- +6.2pp toward D · 2008: 57.7pp · 2024: 63.9pp
- All cycles
- 2024: D+63.9 2020: D+66.5 2016: D+62.9 2012: D+50.5 2008: D+57.7
Not yet ingested
- Civics
- —
Market trends
- HPI YoY
- ▼ -893.58%
- Current HPI
- 303.8086
- Rent YoY
- ▲ 1.62%
- Metro
- San Francisco-Oakland-Berkeley, CA
- State GDP YoY
- ▲ 3.21%
- F500 in state
- 116
Industry mix (Fortune 500 HQ in CA)
| Industry | F500 HQs | Revenue |
|---|---|---|
| Technology | 27 | $1,492B |
|
||
| Financial Services | 3 | $174B |
|
||
| Retail | 3 | $44B |
|
||
| Insurance | 3 | $26B |
|
||
| Media / Entertainment | 2 | $115B |
|
||
| Pharmaceuticals / Biotech | 2 | $62B |
|
||
Price history
4 events — show timeline
- 2026-05-22 Pending — BAREIS
- 2026-05-13 Contingent — BAREIS
- 2026-05-13 Pending — BAREIS
- 2026-05-07 Listed $347,000 BAREIS
Cash-flow waterfall
monthlySold comps — $/sqft
last 12 mo · ≤1 miLoading sold comps…