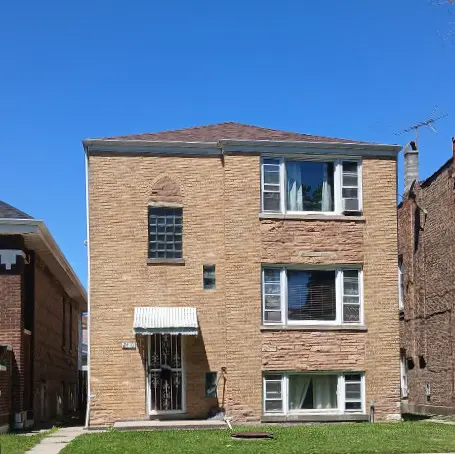
 Triplex
2410 S 60th Ct · Cicero, IL
Flood risk 3/10 · Minor
- FEMA flood zone
- X (unshaded)
- Chance of flooding over 30 yrs
- 0.2%
- Est. flood insurance / yr
- $473 – $860
Fire risk 1/10 · Minimal
- Est. fire insurance / yr
- $804 – $1,492
Heat risk 3/10 · Minor
- Hot days now (above 100°F)
- 7 days/yr
- Hot days in 30 yrs
- 14 days/yr
Wind risk 2/10 · Minimal
- Chance of severe wind over 30 yrs
- 1.0%
Air-quality risk 4/10 · Minor
- Unhealthy air days now
- 3 days/yr
- Unhealthy air days in 30 yrs
- 5 days/yr
Risk factors via First Street. Map © Google.
Why this score? — see what drove the D grade
The composite is a weighted blend of 9 inputs, each scored 0–100. Each bar is that input's sub-score; the figure is the points it added to the 100-point composite (weight × sub-score).
- Cash flow +14.8/30.0
- ARV discount +7.5/15.0
- DSCR +4.5/10.0
- 1% rule +4.2/10.0
- Livability +4.1/5.0
- Rent growth +3.1/5.0
- Condition / age +2.5/5.0
- Schools +1.1/10.0
- Appreciation +0.0/10.0
$389,900
🖨 Deal sheet 📄 Offer letter ✓ Due diligence
Multi-family units
County records classify this as Multi-Family (5+ Unit). Listing-text estimate: 3 units. estimate disagrees with records
5+ unit building — per-unit beds/baths from public records are typically unavailable; the breakdown below (if shown) is an estimate from the listing text.
Listing remarks
YELLOW BRICK 3 UNIT IN THE HEART OF CICERO, TWO UNITS OFFER LIVING ROOM, DINING ROOM, KITCHEN AND TWO LARGE SIZE BEDROOMS WITH FULL BATH. GARDEN UNIT OFFERS LIVING ROOM, KITCHEN, TWO BEDROOMS AND FULL BATH. PROPERTY NEEDS SOME TLC, BEING SOLD AS-IS, PERFECT FOR AN INVESTOR LOOKING TO ADD TO THEIR PORTFOLIO, OR FIRST TIME HOME BUYER LOOKING TO PUT IN SOME SWEAT EQUITY. WALKING DISTANCE TO SCHOOLS AND PUBLIC TRANSPORTATION AND MINUTES FROM I55 AND I290 MAKES THIS A SHORT COMMUTE INTO DOWNTOWN CHICAGO AND SURROUNDING SUBURBS. COME TAKE A LOOK AT WHAT THIS BUILDING HAS TO OFFER.
Key facts
- 3,750 sq ft lot
- 2 garage spots
- Built 1954
Neighborhood map
What this means for you Summary
Snapshot
- This is a 3 × 2-bed/1.0-bath units multifamily listed at $390k.
Deal economics
- At list price, monthly cash flow is $105 ($1k/yr) — positive. Per door: $35/mo.
- The deal already cash-flows at list — no discount required.
- To meet the 1% rule (rent ≥ 1% of price), the offer needs to be $359k (7.8% below list).
- Recommended offer: $359k (7.8% below list) — sets the bar for 1% rule.
- Cap rate 6.6% vs local median 4.6% in Cicero — top-decile yield for the area; either an underpriced asset or a hidden risk that comps aren't pricing in. Stress-test before assuming the spread holds.
Location & tenants
- Location reads 82/100 on livability (#77 in IL, #1,276 nationally) — a professional / high-income tenant draw. Strengths: commute A+, cost of living A+, housing A+.
- J S Morton Hsd 201 (suburban): math 9% / reading 14% proficiency, ranked #557 of 620 in IL (top 90%) — low school quality limits family demand, transient renter base, plan for 1-2y turnover.
- Zoned schools: J Sterling Morton East High Sch (math 7% / reading 11%, grade F, #580 of 693 statewide, top 84%, 3,445 students, 0% FRL).
- Market conditions: Rents rising (+2.4%/yr); 103 active listings in the ZIP; 28 comparable units currently listed for rent nearby; rentals at typical pace (median 17d on market — plan ~3-4 weeks tenant-placement turnaround); 6,272 units permitted in Cook County in 2024 (4,658 in 5+ unit buildings).
- At $3,594/mo this rent would consume 61% of the median local household income ($71k/yr) (locally 2178% of renters already pay >50% of income on rent) — very limited rent-growth headroom before tenants either downsize or default.
Forward outlook
- Local home prices are declining (-3.0%/yr); year-one equity from $3k of loan paydown is wiped out by about $12k of value loss. Plan a longer hold.
Negotiation context
- Only 1 days on market — expect competitive offers; lowballing is unlikely to land.
- Current owner paid $170k; list at $390k implies a 129% gain — meaningful room to come down on a strong offer.
Risks & watch-outs
- Watch-outs: built in 1954 — expect roof / HVAC / electrical / plumbing capex.
Questions for the listing agent
- Can we see the unit-by-unit rent roll, current vacancy, and any below-market leases? What's the average tenancy length?
- What capital expenditures (roof, boiler, parking lot, exteriors) have been made in the last 5 years, and what's planned in the next 2?
- Built in 1954 — when were the roof, HVAC, electrical panel, plumbing, and water heater last replaced?
- Is there a deadline driving the sale (1031 exchange, divorce, estate, relocation)? That informs how much negotiation room exists.
- Schools are F-rated, which usually means shorter tenancies and higher turnover. Who's the typical renter profile here, and what's been the actual vacancy rate?
- The area grade is low — what's the realistic commute time and amenity access for the typical tenant pool here? Any planned neighborhood developments (good or bad) we should know about?
- What's the average days-on-market for RENTAL listings here right now (not sales)? A rising rental-DOM trend means longer vacancies and softer asking-rent achievability than the comps imply.
- What's the recent tenant-quality profile in this submarket — average credit score on applications, eviction rate, late-payment / NSF rate, and stable-employment percentage? A property-management company in the area should have these aggregated.
- How much new apartment / multifamily construction is in the pipeline within 1–3 miles? Heavy new supply (>2% of stock underway) typically softens rents 12–24 months out; light construction supports rent growth.
Investment metrics
- 1% rule
- 0.92% ✗
- Cap rate
- 6.62%
- Cash-on-cash
- 1.16%
- DSCR
- 1.05
- GRM
- 9.0
CMA / ARV
No comps found within radius.
Projected returns pro-forma
-3.0% appreciation · 2.43% rent growth · sell at horizon
- IRR
- -15.1%
- Equity multiple
- 0.46×
- Total profit
- $-58,442
- Equity at exit
- $58,135
- IRR
- -7.5%
- Equity multiple
- 0.54×
- Total profit
- $-50,245
- Equity at exit
- $33,711
Cash invested: $109,172 (down + closing). Projections, not guarantees.
Landlord ↔ Tenant lean methodology
- Overall (STATE)
- 43 Moderately Tenant-Leaning
- State Illinois
- 43 Moderately Tenant-Leaning · D+7
- County
- — inherits STATE
- City
- — inherits STATE
ZIP-level market 60804
- Rents YoY
- 2.4%
- Active inventory
- 103
- Price-to-rent
- 27.1×
Monthly cashflow live
- Estimated rent
- $3,594 medium interval (Pro) →
- Mortgage (P&I)
- −$2,045
- Tax from tax record
- −$527 /mo · $6,321/yr
- Insurance
- −$162
- HOA
- −$0
- Vacancy / Maint / Mgmt
- −$755
- Net cashflow
- $105
Break-even live
3-unit breakdown (identical units grouped — click to expand)
| Units | Beds | Baths | Est. rent |
|---|---|---|---|
| 3× units | 2 | 1 | $3,594 |
| #1 | 2 | 1 | $1,198 |
| #2 | 2 | 1 | $1,198 |
| #3 | 2 | 1 | $1,198 |
| Total (3 units) | $3,594 | ||
UW: 25.0% down · 7.5% · 30yr · 1.5% tax · 5.0% vac · 8.0% maint · 8.0% mgmt
Financing live
Cash to close
- Down payment
- $97,475
- Closing costs
- $11,697
- Reserves months
- —
- Total cash needed
- —
Loan-product check · same deal, 3 products live
Conventional
25% down · 7.5% · 30yr
- Down + closing
- —
- Monthly P&I
- —
- Monthly cashflow
- —
- DSCR
- —
- Eligible?
- —
Personal DTI + credit; lowest rate.
DSCR
20% down · 8.5% · 30yr
- Down + closing
- —
- Monthly P&I
- —
- Monthly cashflow
- —
- DSCR
- —
- Eligible?
- —
No personal income docs; deal must DSCR.
Hard money
10% down · 12.0% · 12mo
- Down + closing
- —
- Monthly P&I
- —
- Monthly cashflow
- —
- DSCR
- —
- Eligible?
- —
Short-term bridge; refi at stabilization.
Rent comps 28 comps
| Address | Beds | Baths | Sqft | Rent | $/sqft | DOM | Units | Dist |
|---|---|---|---|---|---|---|---|---|
| 1900 S Harvey Ave Unit 2W Berwyn, IL | 2.0 | 1.0 | 1300 | $1,800 | $1.38 | 6d | 1 | 0.56mi |
| 5529 W 22nd Pl #2 Cicero, IL | 3.0 | 1.0 | 1400 | $1,900 | $1.36 | 24d | 1 | 0.65mi |
| 1906 Ridgeland Ave Unit 1st Berwyn, IL | 3.0 | 1.0 | 1000 | $2,350 | $2.35 | 10d | 1 | 0.67mi |
| 1542 S 60th Ct Cicero, IL | 3.0 | 1.0 | 1390 | $2,300 | $1.65 | 11d | 1 | 0.78mi |
| 1822 Gunderson Ave #1 Berwyn, IL | 2.0 | 1.0 | 900 | $1,750 | $1.94 | 20d | 1 | 0.82mi |
| 5400 W 23rd St Unit 2 Cicero, IL | 2.0 | 1.0 | 1000 | $2,000 | $2.00 | 24d | 1 | 0.84mi |
| 2125 Wesley Ave Unit 2 Berwyn, IL | 3.0 | 1.0 | 1000 | $2,200 | $2.20 | 24d | 1 | 0.86mi |
| 2729 Wesley Ave Berwyn, IL | 3.0 | 2.0 | 1390 | $1,000 | $0.72 | 14d | 1 | 0.91mi |
| 1447 Cuyler Ave Berwyn, IL | 3.0 | 1.5 | 1400 | $2,900 | $2.07 | 3d | 1 | 0.97mi |
| 1846 Wesley Ave Berwyn, IL | 3.0 | 1.0 | 1200 | $2,300 | $1.92 | 6d | 1 | 0.98mi |
| 1337 S Austin Blvd Unit 2 Cicero, IL | 3.0 | 1.0 | 1500 | $2,450 | $1.63 | 5d | 1 | 1.05mi |
| 1809 Euclid Ave Berwyn, IL | 3.0 | 2.5 | 1176 | $2,900 | $2.47 | 24d | 1 | 1.06mi |
| 1845 S Oak Park Ave Unit 2 Berwyn, IL | 3.0 | 1.0 | 1322 | $1,650 | $1.25 | 24d | 1 | 1.07mi |
| 1928 Grove Ave Unit 2 Berwyn, IL | 2.0 | 1.0 | 1000 | $1,900 | $1.90 | 24d | 1 | 1.11mi |
| 1801 S Oak Park Ave Unit 1 Berwyn, IL | 3.0 | 1.0 | 1304 | $2,300 | $1.76 | 5d | 1 | 1.12mi |
| 1341 Ridgeland Ave #2 Berwyn, IL | 3.0 | 1.0 | 960 | $2,150 | $2.24 | 17d | 1 | 1.12mi |
| 1628 Euclid Ave Unit 1 Berwyn, IL | 3.0 | 1.0 | 1500 | $2,100 | $1.40 | 24d | 1 | 1.14mi |
| 5309 30th Pl Unit 1 Cicero, IL | 2.0 | 1.0 | 950 | $2,000 | $2.11 | 15d | 1 | 1.16mi |
| 5134 W 21st St #2 Cicero, IL | 2.0 | 1.0 | 715 | $1,700 | $2.38 | 15d | 1 | 1.20mi |
| 1226 S 60th Ct Unit 2 Cicero, IL | 2.0 | 2.0 | 975 | $2,800 | $2.87 | 24d | 1 | 1.21mi |
| 5108 W 21st Pl Cicero, IL | 2.0 | 1.0 | 875 | $1,295 | $1.48 | 7d | 1 | 1.23mi |
| 1220 S Lombard Ave Unit 2 Berwyn, IL | 3.0 | 1.0 | 1300 | $1,650 | $1.27 | 24d | 1 | 1.23mi |
| 1419 Wesley Ave Unit 1 Berwyn, IL | 3.0 | 1.0 | 1000 | $1,800 | $1.80 | 24d | 1 | 1.26mi |
| 2119 S 51st Ave Unit 1 Cicero, IL | 2.0 | 1.0 | 1100 | $1,625 | $1.48 | 2d | 1 | 1.26mi |
| 3020 S Laramie Ave Unit 2F Cicero, IL | 3.0 | 1.0 | 1000 | $1,800 | $1.80 | 3d | 1 | 1.28mi |
| 3200 Oak Park Ave Berwyn, IL | 2.0 | 2.0 | 1075 | $2,200 | $2.05 | 24d | 1 | 1.30mi |
| 5701 W Roosevelt Rd Unit 3W Cicero, IL | 2.0 | 1.0 | 900 | $1,500 | $1.67 | 24d | 1 | 1.33mi |
| 4916 W 29th St Unit 2 Cicero, IL | 3.0 | 1.0 | 900 | $1,750 | $1.94 | 14d | 1 | 1.46mi |
Listing history 5 events
-
2026-06-18remarks 581-char remark
-
2026-06-18pricestatusdays on market $389,900 Active 1 DOM
-
2026-06-18days on market Active (Private) 3 DOM
-
2026-06-17days on market Active (Private) 2 DOM
-
2026-06-16Active (Private) 1 DOM
ⓘ Source: listings_history table (triggers on properties + properties_extension) + one-shot
backfill from property_details.listing_events for pre-trigger history.
Tax reassessment forecast IL · Partial reset (capped growth)
- Current annual tax
- $6,321 · $527/mo
- Projected year-2 tax
- $7,586 · $632/mo
- Expected delta
- +$1,265/yr (+$105/mo · 20.0%)
ⓘ Screening estimate from a state-policy table — verify with the county assessor before closing.
Climate risk First Street
- Flood 3/10 Moderate FEMA zone X (unshaded) · 20% chance over 30 yrs
- Wildfire 1/10 Low
- Heat 3/10 Moderate 7 d/yr ≥100°F today · 14 d/yr by 30 yrs out
- Wind 2/10 Low 100% chance of damaging wind over 30 yrs
- Air quality 4/10 Moderate 3 unhealthy d/yr today · 5 by 30 yrs out
Nearby sold comps map
Loading sold comps map…
Walkable amenities ~0.75 mi
Loading nearby amenities…
Taxation est. · year 1
- Rental income
- $43,128
- − Mortgage interest
- −$21,840
- − Property taxes
- −$6,321
- − Insurance
- −$1,950
- − Repairs & maintenance
- −$3,450
- − Management
- −$3,450
- − Depreciation
- −$11,343
- Taxable loss
- −$5,226
- Est. tax savings @ 24.0%
- +$1,254
- After-tax cash flow
- $2,519/yr
For passive investors: Depreciation is non-cash, so a rental often shows a tax loss while cash-flowing — sheltering income. Rental losses are passive: they offset passive income freely, and up to $25,000/yr can offset ordinary (W-2) income if you actively participate and your MAGI is under $100k (phasing out to $0 by $150k); unused losses carry forward. On sale, claimed depreciation is recaptured at up to 25%, and gains may owe capital-gains tax (a 1031 exchange can defer both). Figures are a year-1 estimate at your 24.0% rate — not tax advice; consult a CPA.
Schools (NCES district)
- District
- J S Morton Hsd 201
- NCES district ID
- 1726880
- Math proficiency
- 9% ▲ 1.00%
- Reading proficiency
- 14% ▼ -1.00%
- Median HH income
- $48,698
- Composite
- 10.73/100
- National rank
- #9768
- State rank
- #557 of 620 in IL
Livability — Cicero
- Score
- 82/100
- State rank
- #77
- US rank
- #1276
Category grades
Schools grade is shown separately in the Schools card above.
Census & demographics
- Census place
- Cicero, IL
- County
- Cook County · 4,486,803 people
- City population
- 82,797
- Metro
- Chicago-Naperville-Elgin, IL-IN-WI
- Population (ZIP)
- 82,797
- Household income
- $70,842
- Rent vs Own
- Severe rent burden
- 2178.0
Population outlook (Cook County) Hauer SSP2
- Today (2025)
- 5,347,519 people
- By 2030
- 5,357,703 · +0.2%
- By 2040
- 5,324,924 · -0.4%
- By 2050
- 5,230,762 · -2.2%
- By 2075
- 4,785,735 · -10.5%
- By 2100
- 4,188,836 · -21.7%
Race, ethnicity, and origin ACS 2023
- Neighborhood character
- Predominantly Hispanic (89%)
- Race & ethnicity
- Hispanic / Latino 89% Two or more races 17% White 7% Black 3% Native American 2%
- Hispanic origin (detail)
- Mexican 80% Puerto Rican 3%
- Common ancestry
- Romanian 2%
- Foreign-born
- 40% · Canada, Jamaica
- Languages at home
- 18% English-only · Spanish 80%
Political lean MEDSL · Cook
- 2024 margin
- Solid D (+42.0) · D 70.4% · R 28.4% · Other 1.2%
- 2008→2024 swing
- -11.4pp toward R · 2008: 53.4pp · 2024: 42.0pp
- All cycles
- 2024: D+42.0 2020: D+50.3 2016: D+53.0 2012: D+49.4 2008: D+53.4
Not yet ingested
- Civics
- —
Market trends
- HPI YoY
- ▼ -165.38%
- Current HPI
- 262.83
- Rent YoY
- ▲ 2.43%
- Metro
- Chicago-Naperville-Elgin, IL-IN-WI
- State GDP YoY
- ▲ 1.59%
- F500 in state
- 60
Industry mix (Fortune 500 HQ in IL)
| Industry | F500 HQs | Revenue |
|---|---|---|
| Insurance | 4 | $201B |
|
||
| Consumer Goods | 4 | $87B |
|
||
| Industrial Machinery | 3 | $64B |
|
||
| Healthcare | 2 | $55B |
|
||
| Retail / Pharmacy | 1 | $148B |
|
||
| Agriculture / Food | 1 | $86B |
|
||
Price history
1 event — show timeline
- 1996-06-26 Sold (Public Records) $170,000 Public Records
Property tax history
+1.9%/yrLatest (2023): $6,321 · +13.4% YoY. Source: county tax records.
Cash-flow waterfall
monthlySold comps — $/sqft
last 12 mo · ≤1 miLoading sold comps…