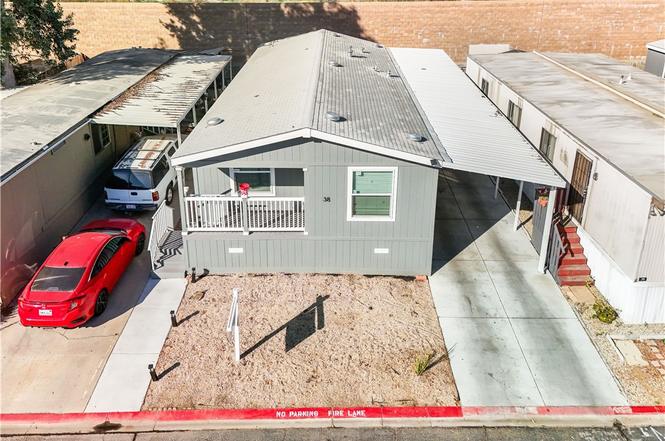
350 E San Jacinto #38 · Perris, CA
Flood risk 4/10 · Minor
- FEMA flood zone
- X (unshaded)
- Chance of flooding over 30 yrs
- 0.2%
- Est. flood insurance / yr
- $507 – $1,088
Fire risk 8/10 · Major
- Est. fire insurance / yr
- $659 – $1,223
Heat risk 7/10 · Major
- Hot days now (above 104°F)
- 7 days/yr
- Hot days in 30 yrs
- 19 days/yr
Wind risk 1/10 · Minimal
- Chance of severe wind over 30 yrs
- —
Air-quality risk 5/10 · Moderate
- Unhealthy air days now
- 8 days/yr
- Unhealthy air days in 30 yrs
- 10 days/yr
Risk factors via First Street. Map © Google.
Why this score? — see what drove the B- grade
The composite is a weighted blend of 9 inputs, each scored 0–100. Each bar is that input's sub-score; the figure is the points it added to the 100-point composite (weight × sub-score).
- Cash flow +30.0/30.0
- DSCR +10.0/10.0
- 1% rule +8.3/10.0
- ARV discount +7.5/15.0
- Rent growth +4.4/5.0
- Livability +3.4/5.0
- Schools +3.0/10.0
- Condition / age +2.5/5.0
- Appreciation +0.0/10.0
$199,900
🖨 Deal sheet 📄 Offer letter ✓ Due diligence
Listing remarks
Welcome to this manufactured home located in the desirable Lake Perris Village community. Built in 2004, this spacious residence offers approximately 1,176 square feet of comfortable living space with 3 bedrooms and 2 full bathrooms. The open-concept floor plan features a bright living area, functional kitchen with ample cabinetry, and a dining area perfect for everyday living and entertaining. The primary suite includes a private bathroom, while the additional bedrooms provide flexibility for family, guests, or a home office. Additional features include indoor laundry, central heating and air conditioning, covered parking, and a private outdoor area. Conveniently located near schools, shop
Key facts
- Functional kitchen
- Covered parking
- Private outdoor area
Tags
Property features AI
Finance
- Other: Manager approval required; Park name: Perris Lake Village; Elevation units listed in feet; Lot characterized as 0-1 unit per acre
- HOA & community: Land lease through the park (approximately $1,060 monthly)
Exterior
- Parking: Located in Perris Lake Village mobile home park
- Utilities: Public sewer; District/public water
- Home design: Single-story mobile home; Mobile home dimensions approximately 48 by 24; Mobile home remains on site
- Construction: Year built per public records; Public records listed living area
- Exterior features: Association swimming pool; Community park
Interior
- Bathrooms: Two full bathrooms
- Interior features: One-level living; Entry located in the living area
- Laundry & utility: In-unit laundry area
Neighborhood map
What this means for you Summary
Snapshot
- This is a 3-bed/2.0-bath manufactured listed at $200k.
Deal economics
- At list price, monthly cash flow is $845 ($10k/yr) — positive.
- The deal already cash-flows at list — no discount required.
- Meets the 1% rule at list price ($3k rent vs $200k).
- Cap rate 11.4% vs local median 3.7% in Perris — top-decile yield for the area; either an underpriced asset or a hidden risk that comps aren't pricing in. Stress-test before assuming the spread holds.
Location & tenants
- Location reads 67/100 on livability (#322 in CA) — a middle-class / working-renter tenant base. Strengths: housing A+, commute B; Watch: crime C-, health & safety D, schools F.
- Perris Union High (suburban): math 21% / reading 48% proficiency, ranked #282 of 517 in CA (top 54%) — families likely to look elsewhere, expect single-tenant / working-renter base with shorter leases; 72% free/reduced lunch — lower-income household profile, screen leases tightly.
- Market conditions: Rents rising fast (+7.7%/yr); 136 active listings in the ZIP; 11 comparable units currently listed for rent nearby; rentals leasing fast (median 2d on market — plan ~1-2 weeks tenant-placement turnaround); solid renter incomes; 9,195 units permitted in Riverside County in 2024 (1,512 in 5+ unit buildings).
- This rent runs 35% of the median local income ($92k/yr) — at the standard rent-burdened threshold; future hikes will face affordability resistance.
Forward outlook
- Local home prices are declining (-3.0%/yr); year-one equity from $1k of loan paydown is wiped out by about $6k of value loss. Plan a longer hold.
- Riverside County population projected at +22% by 2050 — long-run rental-demand tailwind backs the buy-and-hold thesis.
- At projected returns (-3.0% appreciation + 7.7% rent growth), your $56k cash investment doubles in ~6 years — after that, you're playing with house money.
Negotiation context
- Only 3 days on market — expect competitive offers; lowballing is unlikely to land.
Risks & watch-outs
- Climate carrying-cost: severe wildfire risk; extreme-heat days projected 7→19/yr by 2055 (HVAC capex compounding) — expect insurance premiums to compound above CPI over the hold.
Questions for the listing agent
- Is there a deadline driving the sale (1031 exchange, divorce, estate, relocation)? That informs how much negotiation room exists.
- Schools are F-rated, which usually means shorter tenancies and higher turnover. Who's the typical renter profile here, and what's been the actual vacancy rate?
- What's the average days-on-market for RENTAL listings here right now (not sales)? A rising rental-DOM trend means longer vacancies and softer asking-rent achievability than the comps imply.
- What's the recent tenant-quality profile in this submarket — average credit score on applications, eviction rate, late-payment / NSF rate, and stable-employment percentage? A property-management company in the area should have these aggregated.
- How much new for-sale + rental construction is in the pipeline within 1–3 miles? Heavy new supply typically softens prices + rents 12–24 months out; constrained supply supports both.
Investment metrics
- 1% rule
- 1.33% ✓
- Cap rate
- 11.36%
- Cash-on-cash
- 18.11%
- DSCR
- 1.81
- GRM
- 6.2
CMA / ARV
- ARV (on-the-fly)
- $128,184
- Comps found
- 12
Show comp detail 12 sales within ~0.75 mi
| Address | Dist | Beds/Ba | Sqft | Sold | Price | $/sf | Match |
|---|---|---|---|---|---|---|---|
| 350 E San Jacinto Ave #108 | 0.00mi | 3/2.0 | 1,152 (-2%) | 3mo | $145,000 | $126 | 94 |
| 350 E San Jacinto | 0.00mi | 3/2.0 | 1,120 (-5%) | 4mo | $35,000 | $31 | 89 |
| 350 E San Jacinto #163 | 0.00mi | 3/2.0 | 1,248 (+6%) | 4mo | $120,000 | $96 | 86 |
| 350 E San Jacinto Ave #9 | 0.00mi | 3/2.0 | 1,152 (-2%) | 18mo | $159,900 | $139 | 82 |
| 350 E San Jacinto Ave #27 | 0.00mi | 3/2.0 | 1,272 (+8%) | 10mo | $180,000 | $142 | 78 |
| 350 E San Jacinto Ave #170 | 0.14mi | 3/2.0 | 1,176 (0%) | 19mo | $128,000 | $109 | 78 |
| 350 E San Jacinto Ave #121 | 0.00mi | 3/2.0 | 1,344 (+14%) | 4mo | $120,000 | $89 | 72 |
| 350 E San Jacinto Ave #207 | 0.00mi | 3/2.0 | 1,344 (+14%) | 10mo | $144,000 | $107 | 68 |
| 350 E San Jacinto Ave #208 | 0.00mi | 3/2.0 | 1,344 (+14%) | 15mo | $160,000 | $119 | 63 |
| 350 E San Jacunto #195 | 0.00mi | 3/2.0 | 1,344 (+14%) | 17mo | $140,000 | $104 | 62 |
| 350 E San Jacinto Ave #127 | 0.00mi | 3/2.0 | 1,344 (+14%) | 18mo | $222,557 | $166 | 61 |
| 350 E San Jacinto Ave #145 | 0.00mi | 2/2.0 (-1) | 1,000 (-15%) | 12mo | $96,600 | $97 | 60 |
Match score weights: distance 35% · size 25% · config 20% · recency 20%. Top-matched comps best support the ARV.
Projected returns pro-forma
-3.0% appreciation · 7.69% rent growth · sell at horizon
- IRR
- 14.6%
- Equity multiple
- 1.62×
- Total profit
- $34,564
- Equity at exit
- $29,806
- IRR
- 26.5%
- Equity multiple
- 3.84×
- Total profit
- $158,874
- Equity at exit
- $17,284
Cash invested: $55,972 (down + closing). Projections, not guarantees.
Landlord ↔ Tenant lean methodology
- Overall (STATE)
- 18 Strongly Tenant-Friendly
- State California
- 18 Strongly Tenant-Friendly · D+13
- County
- — inherits STATE
- City
- — inherits STATE
ZIP-level market 92571
- Home prices YoY
- -9.4%
- Rents YoY
- 7.7%
- Active inventory
- 136
- Price-to-rent
- 6.2×
Monthly cashflow live
- Estimated rent
- $2,668 high interval (Pro) →
- Mortgage (P&I)
- −$1,048
- Tax from tax record
- −$132 /mo · $1,580/yr
- Insurance
- −$83
- HOA
- −$0
- Vacancy / Maint / Mgmt
- −$560
- Net cashflow
- $845
Break-even live
UW: 25.0% down · 7.5% · 30yr · 1.5% tax · 5.0% vac · 8.0% maint · 8.0% mgmt
Financing live
Cash to close
- Down payment
- $49,975
- Closing costs
- $5,997
- Reserves months
- —
- Total cash needed
- —
Loan-product check · same deal, 3 products live
Conventional
25% down · 7.5% · 30yr
- Down + closing
- —
- Monthly P&I
- —
- Monthly cashflow
- —
- DSCR
- —
- Eligible?
- —
Personal DTI + credit; lowest rate.
DSCR
20% down · 8.5% · 30yr
- Down + closing
- —
- Monthly P&I
- —
- Monthly cashflow
- —
- DSCR
- —
- Eligible?
- —
No personal income docs; deal must DSCR.
Hard money
10% down · 12.0% · 12mo
- Down + closing
- —
- Monthly P&I
- —
- Monthly cashflow
- —
- DSCR
- —
- Eligible?
- —
Short-term bridge; refi at stabilization.
Rent comps 11 comps
| Address | Beds | Baths | Sqft | Rent | $/sqft | DOM | Units | Dist |
|---|---|---|---|---|---|---|---|---|
| 342 Wilkerson Ave Perris, CA | 2.0 | 2.0 | 920 | $1,595 | $1.73 | 1d | 1 | 0.28mi |
| 290 Wilson Ave Perris, CA | 1.0–3.0 | 1.0–2.0 | 875 | $1,950 | $2.23 | 1d | 7 | 0.34mi |
| 768 Wilson Ave Perris, CA | 3.0 | 2.5 | 1500 | $4,500 | $3.00 | 2d | 1 | 0.54mi |
| 1093 Johns Rd Perris, CA | 3.0 | 2.0 | 1100 | $2,500 | $2.27 | 15d | 1 | 0.84mi |
| 154 E 11th St Perris, CA | 3.0 | 2.0 | 1423 | $3,333 | $2.34 | 1d | 1 | 0.94mi |
| 876 S D St Perris, CA | 2.0 | 2.5 | 1300 | $2,395 | $1.84 | 1d | 1 | 0.98mi |
| 1355 S Perris Blvd Perris, CA | 2.0 | 1.0 | 962 | $1,975 | $2.05 | 1d | 1 | 1.01mi |
| 1687 Sycamore St Perris, CA | 3.0 | 2.0 | 1100 | $7,500 | $6.82 | 1d | 1 | 1.44mi |
| 1188 Witt St Perris, CA | 2.0 | 1.0 | 900 | $2,800 | $3.11 | 1d | 1 | 1.45mi |
| 2036 Orchard Dr Perris, CA | 2.0 | 2.0 | 1005 | $2,095 | $2.08 | 2d | 1 | 1.48mi |
| 2036 Orchard Dr Perris, CA | 2.0 | 2.0 | 1005 | $2,095 | $2.08 | 1d | 1 | 1.48mi |
Listing history 4 events
-
2026-06-18days on market $199,900 Active 3 DOM
-
2026-06-17days on market $199,900 Active 2 DOM
-
2026-06-16remarks 699-char remark
-
2026-06-16$199,900 Active 1 DOM
ⓘ Source: listings_history table (triggers on properties + properties_extension) + one-shot
backfill from property_details.listing_events for pre-trigger history.
Tax reassessment forecast CA · Resets to sale price
- Current annual tax
- $1,580 · $132/mo
- Projected year-2 tax
- $1,580 · $132/mo
- Expected delta
- $0/yr ($0/mo · 0.0%)
ⓘ Screening estimate from a state-policy table — verify with the county assessor before closing.
Climate risk First Street
- Flood 4/10 Moderate FEMA zone X (unshaded) · 20% chance over 30 yrs
- Wildfire 8/10 Severe
- Heat 7/10 Severe 7 d/yr ≥104°F today · 19 d/yr by 30 yrs out
- Wind 1/10 Low
- Air quality 5/10 Major 8 unhealthy d/yr today · 10 by 30 yrs out
Nearby sold comps map
Loading sold comps map…
Walkable amenities ~0.75 mi
Loading nearby amenities…
Taxation est. · year 1
- Rental income
- $32,021
- − Mortgage interest
- −$11,198
- − Property taxes
- −$1,580
- − Insurance
- −$1,000
- − Repairs & maintenance
- −$2,562
- − Management
- −$2,562
- − Depreciation
- −$5,815
- Taxable income
- $7,305
- Est. tax owed @ 24.0%
- −$1,753
- After-tax cash flow
- $8,384/yr
For passive investors: Depreciation is non-cash, so a rental often shows a tax loss while cash-flowing — sheltering income. Rental losses are passive: they offset passive income freely, and up to $25,000/yr can offset ordinary (W-2) income if you actively participate and your MAGI is under $100k (phasing out to $0 by $150k); unused losses carry forward. On sale, claimed depreciation is recaptured at up to 25%, and gains may owe capital-gains tax (a 1031 exchange can defer both). Figures are a year-1 estimate at your 24.0% rate — not tax advice; consult a CPA.
Schools (NCES district)
- District
- Perris Union High
- NCES district ID
- 0630210
- Math proficiency
- 21% ▲ 2.00%
- Reading proficiency
- 48% ▲ 5.00%
- Median HH income
- $49,210
- Composite
- 29.75/100
- National rank
- #6439
- State rank
- #282 of 517 in CA
Livability — Perris
- Score
- 67/100
- State rank
- #322
- US rank
- #10902
Category grades
Schools grade is shown separately in the Schools card above.
Census & demographics
- Census place
- Perris, CA
- County
- Riverside County · 2,287,001 people
- City population
- 118,178
- Metro
- Riverside-San Bernardino-Ontario, CA
- Population (ZIP)
- 60,096
- Household income
- $92,309
- Rent vs Own
- Severe rent burden
- 1152.0
Population outlook (Riverside County) Hauer SSP2
- Today (2025)
- 2,664,475 people
- By 2030
- 2,802,692 · +5.2%
- By 2040
- 3,050,904 · +14.5%
- By 2050
- 3,256,783 · +22.2%
- By 2075
- 3,655,058 · +37.2%
- By 2100
- 3,766,594 · +41.4%
Race, ethnicity, and origin ACS 2023
- Neighborhood character
- Predominantly Hispanic (78%)
- Race & ethnicity
- Hispanic / Latino 78% Two or more races 18% Black 9% White 8% Asian 3% Native American 1%
- Hispanic origin (detail)
- Mexican 70%
- Common ancestry
- Lithuanian 1%
- Foreign-born
- 30% · Canada, Jamaica
- Languages at home
- 34% English-only · Spanish 62% Tagalog/Filipino 1%
Political lean MEDSL · Riverside
- 2024 margin
- Toss-up / Even · D 48.0% · R 49.3% · Other 2.6%
- 2008→2024 swing
- -3.6pp toward R · 2008: 2.3pp · 2024: -1.3pp
- All cycles
- 2024: R+1.3 2020: D+8.0 2016: D+4.3 2012: R+0.4 2008: D+2.3
Not yet ingested
- Civics
- —
Market trends
- HPI YoY
- ▼ -43.87%
- Current HPI
- 421.3426
- Rent YoY
- ▲ 7.69%
- Metro
- Riverside-San Bernardino-Ontario, CA
- State GDP YoY
- ▲ 3.21%
- F500 in state
- 116
Industry mix (Fortune 500 HQ in CA)
| Industry | F500 HQs | Revenue |
|---|---|---|
| Technology | 27 | $1,492B |
|
||
| Financial Services | 3 | $174B |
|
||
| Retail | 3 | $44B |
|
||
| Insurance | 3 | $26B |
|
||
| Media / Entertainment | 2 | $115B |
|
||
| Pharmaceuticals / Biotech | 2 | $62B |
|
||
Price history
1 event — show timeline
- 2026-06-15 Listed $199,900 CRMLS
Cash-flow waterfall
monthlySold comps — $/sqft
last 12 mo · ≤1 miLoading sold comps…