6062 Amberly Ave Unit F53 · Orlando, FL
Flood risk No data
- FEMA flood zone
- —
- Chance of flooding over 30 yrs
- —
- Est. flood insurance / yr
- —
Fire risk No data
- Est. fire insurance / yr
- —
Heat risk No data
- Hot days now (above threshold)
- —
- Hot days in 30 yrs
- —
Wind risk No data
- Chance of severe wind over 30 yrs
- —
Air-quality risk No data
- Unhealthy air days now
- —
- Unhealthy air days in 30 yrs
- —
Risk factors via First Street. Map © Google.
Why this score? — see what drove the D grade
The composite is a weighted blend of 9 inputs, each scored 0–100. Each bar is that input's sub-score; the figure is the points it added to the 100-point composite (weight × sub-score).
- Cash flow +12.5/30.0
- ARV discount +7.5/15.0
- 1% rule +6.2/10.0
- Livability +4.3/5.0
- Schools +4.1/10.0
- DSCR +3.7/10.0
- Condition / age +2.5/5.0
- Rent growth +2.3/5.0
- Appreciation +0.0/10.0
$149,000
🖨 Deal sheet (PDF) 📄 Offer letter ✓ Due diligence
Listing remarks
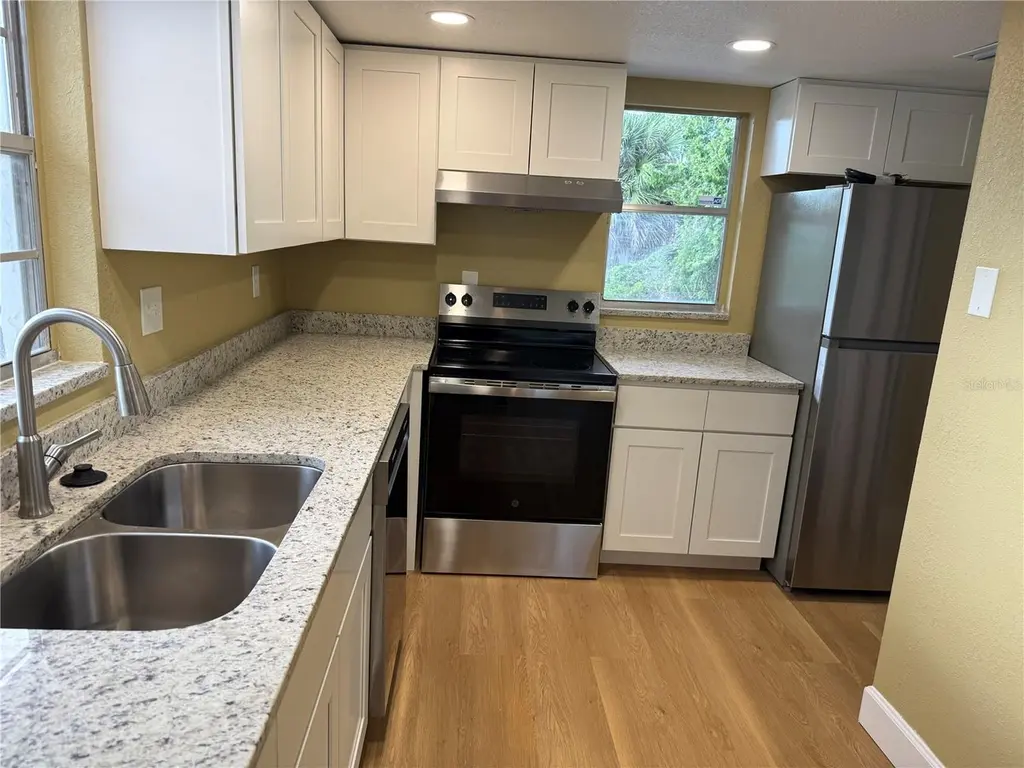
BEAUTIFULLY REMODELED, FRESHLY PAINTED AND UPGRADED THROUGHOUT! This GORGEOUS 2 Bedroom, 2 Bedroom Bathrooms CONDO is located in the Villa Marquis Community. The Kitchen now Boast an OPEN Plan with Brand New Kitchen Cabinets, GRANITE COUNTERTOPS. ALL NEW KITCHEN APPLIANCES. ALL NEW VINYL FLOOTRING. NEW A/C. Check out the VAULTED CEILINGS with Recessed Lights. RELAX on your own PRIVATE BALCONY overlooking a PEACEFUL and SERENE views. THE NEWLY REMODELED BATHROOMS will also Spark your interest. This community is Centrally Located Close to an abundance of Restaurants, Shopping. Just a Few Miles from the Airport, UCF, and MAJOR ATTRACTIONS.
Key facts
- Private balcony
- Stone counter tops
- Vaulted ceilings
Tags
Property features AI
Finance
- Other: Lot on paved road within a 3.8-acre parcel; Zoning R-3B/AN
- Financial info: Lease restrictions apply
- HOA & community: Monthly HOA $305.76; includes pool and insurance; Association approval required; Association: Lisa Moore / Sentry Management; Community clubhouse, deed restrictions and pool; Pets allowed (cats and dogs)
Exterior
- Utilities: Public water; Public sewer; Public utilities
- Home design: Condominium; Residential property; 2 total stories; Unit on 2nd floor; Faces east; One-level interior layout
- Construction: Block, concrete and stucco construction; Shingle roof; Block foundation; Built on 2-story building
- Exterior features: Balcony; Heated spa
Interior
- Kitchen: Dishwasher; Range; Range hood; Refrigerator; Disposal; Exhaust fan; Stone counters
- Bedrooms: 2 bedrooms
- Bathrooms: 2 full bathrooms
- Heating & cooling: Electric heating; Central air conditioning
- Interior features: Cathedral ceilings; Ceiling fans; High ceilings; Living room/dining room combo; Stone counters; Walk-in closet(s)
- Laundry & utility: Washer; Dryer; Laundry closet; Electric water heater
Neighborhood map
What this means for you Summary
Snapshot
- This is a 2-bed/2.0-bath condo listed at $149k.
Deal economics
- At list price, monthly cash flow is $-23 ($-273/yr) — negative.
- To cash-flow at today's rent, offer at most $145k (2.7% below list).
- Meets the 1% rule at list price ($2k rent vs $149k).
- Recommended offer: $145k (2.7% below list) — sets the bar for cash-flow.
- Cap rate 6.1% vs local median 3.0% in Orlando — top-decile yield for the area; either an underpriced asset or a hidden risk that comps aren't pricing in. Stress-test before assuming the spread holds.
Location & tenants
- Location reads 86/100 on livability (#12 in FL, #360 nationally) — a professional / high-income tenant draw. Strengths: amenities A+, commute A+, housing A+.
- Orange (suburban): math 46% / reading 51% proficiency, ranked #43 of 73 in FL (top 59%) — families likely to look elsewhere, expect single-tenant / working-renter base with shorter leases.
- Zoned schools: Chickasaw Elementary (math 32% / reading 45%, grade F, #1,575 of 2,144 statewide, top 74%, 507 students, 74% FRL); Roberto Clemente Middle (math 31% / reading 36%, grade F, #428 of 571 statewide, top 76%, 951 students, 63% FRL); Colonial High (math 16% / reading 33%, grade F, #505 of 667 statewide, top 79%, 3,442 students, 62% FRL).
- Zoned-school proficiency averages 32% at this address vs 48% district-wide (-16 pts) — the specific schools serving this property underperform the Orange average; the district grade overstates school quality for this exact location.
- Market conditions: Rents soft (-0.7%/yr); 379 active listings in the ZIP; 40 comparable units currently listed for rent nearby; rentals at typical pace (median 24d on market — plan ~3-4 weeks tenant-placement turnaround); 8,053 units permitted in Orange County in 2024 (3,133 in 5+ unit buildings).
- This rent runs 35% of the median local income ($57k/yr) — at the standard rent-burdened threshold; future hikes will face affordability resistance.
Forward outlook
- Local home prices are declining (-3.0%/yr); year-one equity from $1k of loan paydown is wiped out by about $4k of value loss. Plan a longer hold.
- Orange County population projected at +52% by 2050 — long-run rental-demand tailwind backs the buy-and-hold thesis.
Negotiation context
- Only 9 days on market — expect competitive offers; lowballing is unlikely to land.
- Current owner paid $64k; list at $149k implies a 133% gain — meaningful room to come down on a strong offer.
Questions for the listing agent
- What do current leases actually rent for vs. the listed asking? Can we see a recent rent roll and the last 12 months of T-12 income?
- Built in 1973 — when were the roof, HVAC, electrical panel, plumbing, and water heater last replaced?
- What does the HOA fee cover, when was the last increase, and are there any pending special assessments or reserve-fund shortfalls?
- Any open or pending special assessments — roof, HVAC, plumbing, elevator, façade? What's the per-unit balance and payoff schedule, and is the seller paying it off at close or rolling it to the buyer?
- Is there a deadline driving the sale (1031 exchange, divorce, estate, relocation)? That informs how much negotiation room exists.
- Schools are B-rated — typically a magnet for longer-tenancy family renters. What's the average tenant stay here, and is there a school-zone premium baked into asking?
- The area grade is low — what's the realistic commute time and amenity access for the typical tenant pool here? Any planned neighborhood developments (good or bad) we should know about?
- What's the average days-on-market for RENTAL listings here right now (not sales)? A rising rental-DOM trend means longer vacancies and softer asking-rent achievability than the comps imply.
- What's the recent tenant-quality profile in this submarket — average credit score on applications, eviction rate, late-payment / NSF rate, and stable-employment percentage? A property-management company in the area should have these aggregated.
- How much new apartment / multifamily construction is in the pipeline within 1–3 miles? Heavy new supply (>2% of stock underway) typically softens rents 12–24 months out; light construction supports rent growth.
Investment metrics
- 1% rule
- 1.12% ✓
- Cap rate
- 6.11%
- Cash-on-cash
- -0.66%
- DSCR
- 0.97
- GRM
- 7.4
CMA / ARV
No comps found within radius.
Projected returns pro-forma
-3.0% appreciation · 0.0% rent growth · sell at horizon
- IRR
- -21.7%
- Equity multiple
- 0.27×
- Total profit
- $-30,266
- Equity at exit
- $22,216
- IRR
- -29.6%
- Equity multiple
- -0.11×
- Total profit
- $-46,228
- Equity at exit
- $12,883
Cash invested: $41,720 (down + closing). Projections, not guarantees.
Landlord ↔ Tenant lean methodology
- Overall (STATE)
- 87 Strongly Landlord-Friendly
- State Florida
- 87 Strongly Landlord-Friendly · R+3
- County
- — inherits STATE
- City
- — inherits STATE
ZIP-level market 32822
- Home prices YoY
- -21.1%
- Rents YoY
- -0.7%
- Active inventory
- 379
- Price-to-rent
- 7.4×
Monthly cashflow live
- Estimated rent
- $1,667 high interval (Pro) →
- Mortgage (P&I)
- −$781
- Tax from tax record
- −$191 /mo · $2,297/yr
- Insurance
- −$62
- HOA
- −$305
- Vacancy / Maint / Mgmt
- −$350
- Net cashflow
- $-23
Break-even live
Sensitivity live
| Price | -10% $62 | -5% $19 | +0% $-23 | +5% $-65 | +10% $-107 |
|---|---|---|---|---|---|
| Rent | -10% $-154 | -5% $-89 | +0% $-23 | +5% $43 | +10% $109 |
| Rate | -1.0pp $52 | -0.5pp $15 | base $-23 | +0.5pp $-61 | +1.0pp $-101 |
UW: 25.0% down · 7.5% · 30yr · 1.5% tax · 5.0% vac · 8.0% maint · 8.0% mgmt
Financing live
Cash to close
- Down payment
- $37,250
- Closing costs
- $4,470
- Reserves months
- —
- Total cash needed
- —
Loan-product check · same deal, 3 products live
Conventional
25% down · 7.5% · 30yr
- Down + closing
- —
- Monthly P&I
- —
- Monthly cashflow
- —
- DSCR
- —
- Eligible?
- —
Personal DTI + credit; lowest rate.
DSCR
20% down · 8.5% · 30yr
- Down + closing
- —
- Monthly P&I
- —
- Monthly cashflow
- —
- DSCR
- —
- Eligible?
- —
No personal income docs; deal must DSCR.
Hard money
10% down · 12.0% · 12mo
- Down + closing
- —
- Monthly P&I
- —
- Monthly cashflow
- —
- DSCR
- —
- Eligible?
- —
Short-term bridge; refi at stabilization.
Rent comps 40 comps
| Address | Beds | Baths | Sqft | Rent | $/sqft | DOM | Units | Dist |
|---|---|---|---|---|---|---|---|---|
| 1854 Caralee Blvd #3 Orlando, FL | 2.0 | 1.0 | 850 | $1,700 | $2.00 | 25d | 1 | 0.03mi |
| 1847 Caralee Blvd #4 Orlando, FL | 2.0 | 1.0 | 850 | $1,650 | $1.94 | 5d | 1 | 0.05mi |
| 1724 Townhall Ln Orlando, FL | 2.0 | 1.5 | 1018 | $1,595 | $1.57 | 23d | 1 | 0.08mi |
| 6254 S Bend Sq #173 Orlando, FL | 2.0 | 2.5 | 1104 | $1,699 | $1.54 | 25d | 1 | 0.08mi |
| 6231 Yorktown Dr #140 Orlando, FL | 3.0 | 2.5 | 1307 | $1,890 | $1.45 | 5d | 1 | 0.11mi |
| 1610 Little River Dr #20 Orlando, FL | 3.0 | 2.5 | 1307 | $1,800 | $1.38 | 25d | 1 | 0.13mi |
| 1718 Silver Creek Ct #102 Orlando, FL | 2.0 | 1.5 | 1032 | $1,850 | $1.79 | 23d | 1 | 0.16mi |
| 1732 Hidden Creek Blvd #108 Orlando, FL | 2.0 | 2.5 | 1104 | $1,550 | $1.40 | 19d | 1 | 0.16mi |
| 6203 Curry Ford Rd Orlando, FL | 1.0–3.0 | 1.0–2.0 | 1011 | $1,720 | $1.70 | 15d | 1 | 0.16mi |
| 1600 Bending Brook Way Orlando, FL | 2.0 | 2.5 | 1227 | $1,745 | $1.42 | 22d | 1 | 0.17mi |
| 1600 Bending Brook Way Orlando, FL | 2.0 | 2.5 | 1227 | $1,695 | $1.38 | 15d | 1 | 0.17mi |
| 6299 Arlington Ct #212 Orlando, FL | 2.0 | 1.5 | 1032 | $1,680 | $1.63 | 25d | 1 | 0.17mi |
| 6104 Curry Ford Rd #207 Orlando, FL | 2.0 | 2.0 | 1051 | $1,600 | $1.52 | 25d | 1 | 0.18mi |
| 6104 Curry Ford Rd #108 Orlando, FL | 2.0 | 2.0 | 1051 | $1,500 | $1.43 | 9d | 1 | 0.18mi |
| 1701 Shady Ridge Ct #247 Orlando, FL | 2.0 | 2.5 | 1104 | $1,600 | $1.45 | 25d | 1 | 0.21mi |
| 6110 Curry Ford Rd #117 Orlando, FL | 1.0 | 1.0 | 742 | $1,175 | $1.58 | 25d | 1 | 0.22mi |
| 5914 Mausser Dr Orlando, FL | 1.0–4.0 | 1.0–2.5 | 1052 | $1,771 | $1.68 | 0d | 14 | 0.23mi |
| 2536 Woodgate Blvd #107 Orlando, FL | 2.0 | 2.0 | 930 | $1,650 | $1.77 | 23d | 1 | 0.23mi |
| 6118 Curry Ford Rd Orlando, FL | 1.0 | 1.0 | 742 | $1,175 | $1.58 | 25d | 1 | 0.26mi |
| 6122 Curry Ford Rd #241 Orlando, FL | 1.0 | 1.0 | 742 | $1,325 | $1.79 | 25d | 1 | 0.30mi |
| 2508 Woodgate Blvd #207 Orlando, FL | 2.0 | 2.0 | 930 | $1,600 | $1.72 | 23d | 1 | 0.31mi |
| 1382 Hendren Dr Orlando, FL | 3.0 | 2.0 | 1175 | $2,150 | $1.83 | 25d | 1 | 0.33mi |
| 2568 Woodgate Blvd Orlando, FL | 1.0–2.0 | 1.0–2.0 | 790 | $1,500 | $1.90 | 6d | 1 | 0.37mi |
| 6020 Village Cir N Orlando, FL | 2.0 | 1.5 | 825 | $1,390 | $1.68 | 25d | 1 | 0.39mi |
| 1303 Candlewyck Dr Orlando, FL | 2.0 | 1.0 | 904 | $1,500 | $1.66 | 25d | 1 | 0.39mi |
| 6077 Village Cir #6077 Orlando, FL | 2.0 | 2.0 | 1022 | $1,800 | $1.76 | 25d | 1 | 0.39mi |
| 6032 Village Cir N #6032 Orlando, FL | 2.0 | 2.0 | 1022 | $1,800 | $1.76 | 25d | 1 | 0.39mi |
| 6083 Village Cir S Orlando, FL | 3.0 | 2.5 | 1128 | $1,695 | $1.50 | 9d | 1 | 0.41mi |
| 6065 Village Cir #6065 Orlando, FL | 2.0 | 1.5 | 860 | $1,425 | $1.66 | 9d | 1 | 0.41mi |
| 6043 Village Cir #6043 Orlando, FL | 2.0 | 1.5 | 860 | $1,550 | $1.80 | 19d | 1 | 0.42mi |
| 2365 Oak Park Way #109 Orlando, FL | 2.0 | 2.0 | 953 | $1,350 | $1.42 | 12d | 1 | 0.44mi |
| 2365 Oak Park Way Orlando, FL | 2.0 | 2.0 | 953 | $1,350 | $1.42 | 0d | 1 | 0.44mi |
| 2439 Oak Park Way #217 Orlando, FL | 2.0 | 2.0 | 953 | $1,650 | $1.73 | 4d | 1 | 0.47mi |
| 2451 Oak Park Way #120 Orlando, FL | 2.0 | 2.0 | 953 | $1,700 | $1.78 | 6d | 1 | 0.48mi |
| 5762 Folkstone Ln Orlando, FL | 1.0–3.0 | 1.0–2.0 | 1081 | $1,967 | $1.82 | 0d | 16 | 0.49mi |
| 6031 Scotchwood Gln #204 Orlando, FL | 2.0 | 2.0 | 846 | $1,650 | $1.95 | 0d | 1 | 0.50mi |
| 2683 Oak Park Way #214 Orlando, FL | 2.0 | 2.0 | 950 | $1,700 | $1.79 | 25d | 1 | 0.50mi |
| 6031 Scotchwood Gln Orlando, FL | 2.0 | 2.0 | 846 | $1,625 | $1.92 | 25d | 2 | 0.51mi |
| 6007 Scotchwood Gln #31 Orlando, FL | 2.0 | 2.5 | 1343 | $1,695 | $1.26 | 9d | 1 | 0.52mi |
| 1198 Calanda Ave Orlando, FL | 3.0 | 2.0 | 1151 | $2,390 | $2.08 | 25d | 1 | 0.53mi |
HOA detail condo
- Monthly dues
- $305 · $3,660/yr
- Assessments
- None detected in remarks — confirm with the listing agent.
Listing history 9 events
-
2026-06-21days on market $149,000 Active 9 DOM
-
2026-06-18price $149,000 Active 6 DOM
-
2026-06-18days on market $159,000 Active 6 DOM
-
2026-06-17days on market $159,000 Active 5 DOM
-
2026-06-16days on market $159,000 Active 4 DOM
-
2026-06-15days on market $159,000 Active 3 DOM
-
2026-06-13remarks 644-char remark
-
2026-06-13remarks 619-char remark
-
2026-06-13$159,000 Active 1 DOM
ⓘ Source: listings_history table (triggers on properties + properties_extension) + one-shot
backfill from property_details.listing_events for pre-trigger history.
Tax reassessment forecast FL · Resets to sale price
- Current annual tax
- $2,297 · $191/mo
- Projected year-2 tax
- $2,297 · $191/mo
- Expected delta
- $0/yr ($0/mo · 0.0%)
ⓘ Screening estimate from a state-policy table — verify with the county assessor before closing.
Nearby sold comps map
Loading sold comps map…
Walkable amenities ~0.75 mi
Loading nearby amenities…
Taxation est. · year 1
- Rental income
- $20,006
- − Mortgage interest
- −$8,346
- − Property taxes
- −$2,297
- − Insurance
- −$745
- − Repairs & maintenance
- −$1,600
- − Management
- −$1,600
- − HOA
- −$3,660
- − Depreciation
- −$4,335
- Taxable loss
- −$2,577
- Est. tax savings @ 24.0%
- +$619
- After-tax cash flow
- $345/yr
For passive investors: Depreciation is non-cash, so a rental often shows a tax loss while cash-flowing — sheltering income. Rental losses are passive: they offset passive income freely, and up to $25,000/yr can offset ordinary (W-2) income if you actively participate and your MAGI is under $100k (phasing out to $0 by $150k); unused losses carry forward. On sale, claimed depreciation is recaptured at up to 25%, and gains may owe capital-gains tax (a 1031 exchange can defer both). Figures are a year-1 estimate at your 24.0% rate — not tax advice; consult a CPA.
Schools (NCES district)
- District
- Orange
- NCES district ID
- 1201440
- Math proficiency
- 46% ▼ -9.00%
- Reading proficiency
- 51% ▼ -2.00%
- Median HH income
- $49,350
- Composite
- 41.47/100
- National rank
- #3461
- State rank
- #43 of 73 in FL
Livability — Orlando
- Score
- 86/100
- State rank
- #12
- US rank
- #360
Category grades
Schools grade is shown separately in the Schools card above.
Census & demographics
- Census place
- Orlando, FL
- County
- Orange County · 1,471,359 people
- City population
- 964,969
- Metro
- Orlando-Kissimmee-Sanford, FL
- Population (ZIP)
- 67,081
- Household income
- $56,540
- Rent vs Own
- Severe rent burden
- 4246.0
Population outlook (Orange County) Hauer SSP2
- Today (2025)
- 1,618,226 people
- By 2030
- 1,787,404 · +10.5%
- By 2040
- 2,125,621 · +31.4%
- By 2050
- 2,454,016 · +51.6%
- By 2075
- 3,173,711 · +96.1%
- By 2100
- 3,607,781 · +122.9%
Race, ethnicity, and origin ACS 2023
- Neighborhood character
- Predominantly Hispanic (68%)
- Race & ethnicity
- Hispanic / Latino 68% Two or more races 36% White 17% Black 10% Asian 2%
- Hispanic origin (detail)
- Mexican 2% Puerto Rican 38% Cuban 5% Dominican 5%
- Common ancestry
- Lithuanian 1% Romanian 1% Slovak 1%
- Foreign-born
- 27% · Canada, Jamaica, China
- Languages at home
- 36% English-only · Spanish 60% French/Haitian/Cajun 1% Arabic 1%
Political lean MEDSL · Orange
- 2024 margin
- D (+13.6) · D 56.1% · R 42.5% · Other 1.3%
- 2008→2024 swing
- -5.0pp toward R · 2008: 18.6pp · 2024: 13.6pp
- All cycles
- 2024: D+13.6 2020: D+23.1 2016: D+24.6 2012: D+18.2 2008: D+18.6
Not yet ingested
- Civics
- —
Market trends
- HPI YoY
- ▼ -95.17%
- Current HPI
- 355.5775
- Rent YoY
- ▼ -0.68%
- Metro
- Orlando-Kissimmee-Sanford, FL
- State GDP YoY
- ▲ 3.28%
- F500 in state
- 36
Industry mix (Fortune 500 HQ in FL)
| Industry | F500 HQs | Revenue |
|---|---|---|
| Industrial Technology | 2 | $29B |
|
||
| Insurance | 2 | $17B |
|
||
| Retail | 1 | $60B |
|
||
| Technology Distribution | 1 | $58B |
|
||
| Homebuilding | 1 | $35B |
|
||
| Technology Manufacturing | 1 | $35B |
|
||
Price history
+398.4% since first listed5 events — show timeline
- 2026-06-12 Listed $159,000 Stellar MLS as Distributed by MLS Grid
- 2017-04-24 Sold (Public Records) $64,000 Public Records
- 2014-12-30 Sold (Public Records) $52,900 Public Records
- 1997-12-23 Sold (Public Records) $29,000 Public Records
- 1979-07-01 Sold (Public Records) $31,900 Public Records
Property tax history
+9.6%/yrLatest (2025): $2,297 · +7.4% YoY. Source: county tax records.
Cash-flow waterfall
monthlySold comps — $/sqft
last 12 mo · ≤1 miLoading sold comps…