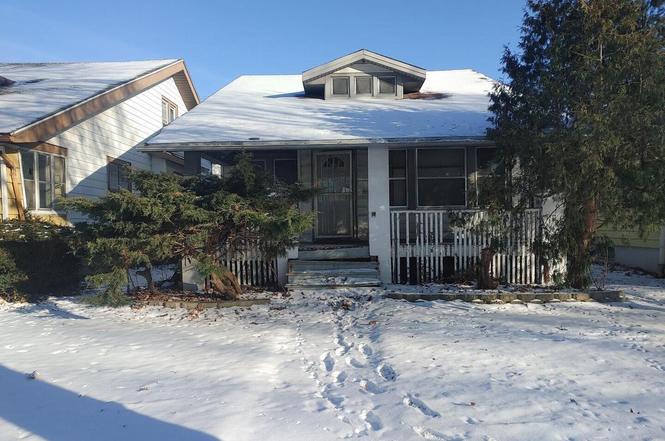
3616 N 16th St · Milwaukee, WI
Flood risk 5/10 · Moderate
- FEMA flood zone
- X (unshaded)
- Chance of flooding over 30 yrs
- 0.66%
- Est. flood insurance / yr
- $473 – $860
Fire risk 1/10 · Minimal
- Est. fire insurance / yr
- $636 – $1,182
Heat risk 2/10 · Minimal
- Hot days now (above 98°F)
- 7 days/yr
- Hot days in 30 yrs
- 13 days/yr
Wind risk 2/10 · Minimal
- Chance of severe wind over 30 yrs
- —
Air-quality risk 3/10 · Minor
- Unhealthy air days now
- 3 days/yr
- Unhealthy air days in 30 yrs
- 4 days/yr
Risk factors via First Street. Map © Google.
Why this score? — see what drove the B+ grade
The composite is a weighted blend of 9 inputs, each scored 0–100. Each bar is that input's sub-score; the figure is the points it added to the 100-point composite (weight × sub-score).
- Cash flow +30.0/30.0
- 1% rule +10.0/10.0
- DSCR +10.0/10.0
- Appreciation +10.0/10.0
- ARV discount +7.5/15.0
- Rent growth +4.6/5.0
- Livability +4.0/5.0
- Condition / age +2.5/5.0
- Schools +1.2/10.0
$59,000
🖨 Deal sheet (PDF) 📄 Offer letter ✓ Due diligence
Listing remarks MLS
This is a tax foreclosed property. Owner Occupants will be prioritized.
Key facts
- 4,356 sq ft lot
- Built 1917
- Listed 188 days
Neighborhood map
What this means for you Summary
Snapshot
- This is a 4-bed/1.0-bath single-family listed at $59k.
Deal economics
- At list price, monthly cash flow is $620 ($7k/yr) — positive.
- The deal already cash-flows at list — no discount required.
- Meets the 1% rule at list price ($1k rent vs $59k).
- Recommended offer: $52k (12.0% below list) — sets the bar for market timing.
- Cap rate 18.9% vs local median 5.1% in Milwaukee — top-decile yield for the area; either an underpriced asset or a hidden risk that comps aren't pricing in. Stress-test before assuming the spread holds.
Location & tenants
- Location reads 81/100 on livability (#55 in WI, #1,534 nationally) — a professional / high-income tenant draw. Strengths: amenities A+, commute A+, cost of living A+; Watch: employment D+, schools F, crime F.
- Milwaukee School District (urban): math 10% / reading 18% proficiency, ranked #337 of 342 in WI (top 98%) — low school quality limits family demand, transient renter base, plan for 1-2y turnover; 77% free/reduced lunch — lower-income household profile, screen leases tightly.
- Market conditions: Rents rising fast (+8.3%/yr); 160 active listings in the ZIP; 20 comparable units currently listed for rent nearby; rentals at typical pace (median 25d on market — plan ~3-4 weeks tenant-placement turnaround); lower-income renter base — watch delinquency; 1,017 units permitted in Milwaukee County in 2024 (803 in 5+ unit buildings).
Forward outlook
- In year one you build about $6k of equity ($408 loan paydown + $6k appreciation (10.0% local appreciation)).
- Milwaukee County population projected at +4% by 2050 — modest demand growth; plan on rents tracking national, not racing it.
- At projected returns (10.0% appreciation + 8.0% rent growth), your $17k cash investment doubles in ~2 years — after that, you're playing with house money.
- By year 6, paydown + projected appreciation supports a ~$37k cash-out refi (75% LTV) — recoverable capital for the next deal without selling this one.
Negotiation context
- It's been on market 188 days — a 12% lower offer ($52k) is reasonable based on typical stale-listing flexibility.
- 2 sale attempts; this cycle's ask has dropped $45k (43%) from the opening price — seller is motivated, your offer sets the floor, not the list.
- Current owner paid $13k; list at $59k implies a 347% gain — meaningful room to come down on a strong offer.
Risks & watch-outs
- Watch-outs: built in 1917 — expect roof / HVAC / electrical / plumbing capex.
- Climate carrying-cost: moderate flood risk — expect insurance premiums to compound above CPI over the hold.
Questions for the listing agent
- It's been on market 188 days. Have you received any prior offers? Is the seller open to a 12% concession, seller financing, or rate buy-down credit?
- Built in 1917 — when were the roof, HVAC, electrical panel, plumbing, and water heater last replaced?
- Why hasn't it sold? Are there any deal-killer items the seller is aware of (foundation, flood, title, zoning, code violations)?
- Is there a deadline driving the sale (1031 exchange, divorce, estate, relocation)? That informs how much negotiation room exists.
- Schools are F-rated, which usually means shorter tenancies and higher turnover. Who's the typical renter profile here, and what's been the actual vacancy rate?
- Crime grade is F in this area — have there been break-ins, vandalism, or insurance claims at this property in the last 3 years? What carrier currently insures it and at what premium?
- What's the average days-on-market for RENTAL listings here right now (not sales)? A rising rental-DOM trend means longer vacancies and softer asking-rent achievability than the comps imply.
- What's the recent tenant-quality profile in this submarket — average credit score on applications, eviction rate, late-payment / NSF rate, and stable-employment percentage? A property-management company in the area should have these aggregated.
- How much new for-sale + rental construction is in the pipeline within 1–3 miles? Heavy new supply typically softens prices + rents 12–24 months out; constrained supply supports both.
Investment metrics
- 1% rule
- 2.28% ✓
- Cap rate
- 18.90%
- Cash-on-cash
- 45.02%
- DSCR
- 3.00
- GRM
- 3.7
CMA / ARV
- ARV (on-the-fly)
- $177,981
- Comps found
- 12
Show comp detail 12 sales within ~0.75 mi
| Address | Dist | Beds/Ba | Sqft | Sold | Price | $/sf | Match |
|---|---|---|---|---|---|---|---|
| 3840 N 18th St St | 0.24mi | 3/2.0 (-1) | 1,413 (-2%) | 2mo | $120,000 | $85 | 74 |
| 3735 N 15th St | 0.12mi | 5/1.0 (+1) | 1,263 (-13%) | 2mo | $155,000 | $123 | 67 |
| 1225 W Keefe Ave | 0.25mi | 5/1.0 (+1) | 1,294 (-11%) | 1mo | $90,000 | $70 | 65 |
| 3700 N 14th St | 0.14mi | 5/2.0 (+1) | 1,611 (+11%) | 2mo | $205,000 | $127 | 64 |
| 3783 N 9th St | 0.44mi | 4/2.0 | 1,562 (+8%) | 2mo | $220,000 | $141 | 60 |
| 3450 N 23rd St | 0.52mi | 4/2.0 | 1,556 (+8%) | 4mo | $135,000 | $87 | 55 |
| 3558 N 11th St | 0.32mi | 5/1.5 (+1) | 1,656 (+14%) | 5mo | $150,000 | $91 | 50 |
| 3311 N 8th St | 0.57mi | 4/1.0 | 1,259 (-13%) | 2mo | $63,000 | $50 | 50 |
| 3422 N 11th St | 0.38mi | 5/2.0 (+1) | 1,249 (-14%) | 1mo | $159,000 | $127 | 50 |
| 3741 N 25th St | 0.74mi | 3/2.0 (-1) | 1,397 (-4%) | 2mo | $195,000 | $140 | 49 |
| 4182 N 13th St | 0.68mi | 4/2.0 | 1,351 (-7%) | 5mo | $239,000 | $177 | 49 |
| 3745 N 25th St | 0.74mi | 4/1.5 | 1,635 (+13%) | 5mo | $100,000 | $61 | 38 |
Match score weights: distance 35% · size 25% · config 20% · recency 20%. Top-matched comps best support the ARV.
Projected returns pro-forma
10.0% appreciation · 8.0% rent growth · sell at horizon
- IRR
- 63.2%
- Equity multiple
- 5.77×
- Total profit
- $78,754
- Equity at exit
- $53,152
- IRR
- 58.9%
- Equity multiple
- 14.23×
- Total profit
- $218,570
- Equity at exit
- $114,624
Cash invested: $16,520 (down + closing). Projections, not guarantees.
Landlord ↔ Tenant lean methodology
- Overall (STATE)
- 73 Landlord-Friendly
- State Wisconsin
- 73 Landlord-Friendly · R+2
- County
- — inherits STATE
- City
- — inherits STATE
ZIP-level market 53206
- Rents YoY
- 8.3%
- Active inventory
- 160
- Price-to-rent
- 3.7×
Monthly cashflow live
- Estimated rent
- $1,345 high interval (Pro) →
- Mortgage (P&I)
- −$309
- Tax from tax record
- −$109 /mo · $1,307/yr
- Insurance
- −$25
- HOA
- −$0
- Vacancy / Maint / Mgmt
- −$282
- Net cashflow
- $620
Break-even live
Sensitivity live
| Price | -10% $653 | -5% $636 | +0% $620 | +5% $603 | +10% $586 |
|---|---|---|---|---|---|
| Rent | -10% $513 | -5% $567 | +0% $620 | +5% $673 | +10% $726 |
| Rate | -1.0pp $649 | -0.5pp $635 | base $620 | +0.5pp $604 | +1.0pp $589 |
UW: 25.0% down · 7.5% · 30yr · 1.5% tax · 5.0% vac · 8.0% maint · 8.0% mgmt
Financing live
Cash to close
- Down payment
- $14,750
- Closing costs
- $1,770
- Reserves months
- —
- Total cash needed
- —
Loan-product check · same deal, 3 products live
Conventional
25% down · 7.5% · 30yr
- Down + closing
- —
- Monthly P&I
- —
- Monthly cashflow
- —
- DSCR
- —
- Eligible?
- —
Personal DTI + credit; lowest rate.
DSCR
20% down · 8.5% · 30yr
- Down + closing
- —
- Monthly P&I
- —
- Monthly cashflow
- —
- DSCR
- —
- Eligible?
- —
No personal income docs; deal must DSCR.
Hard money
10% down · 12.0% · 12mo
- Down + closing
- —
- Monthly P&I
- —
- Monthly cashflow
- —
- DSCR
- —
- Eligible?
- —
Short-term bridge; refi at stabilization.
Rent comps 20 comps
| Address | Beds | Baths | Sqft | Rent | $/sqft | DOM | Units | Dist |
|---|---|---|---|---|---|---|---|---|
| 3416 N 17th St Unit 1 Milwaukee, WI | 3.0 | 1.0 | 1200 | $1,100 | $0.92 | 45d | 1 | 0.24mi |
| 2106A W Keefe Ave Unit 2106 Lower Milwaukee, WI | 3.0 | 1.0 | 1300 | $1,100 | $0.85 | 18d | 1 | 0.40mi |
| 3298 N 13th St Milwaukee, WI | 3.0 | 1.0 | 885 | $895 | $1.01 | 45d | 1 | 0.41mi |
| 2116 W Atkinson Ave Unit A Milwaukee, WI | 4.0 | 1.0 | 1707 | $2,000 | $1.17 | 3d | 1 | 0.66mi |
| 3045 N 11th St #3047 Milwaukee, WI | 3.0 | 1.0 | 1065 | $1,175 | $1.10 | 5d | 1 | 0.73mi |
| 3388 N 27th St Unit 3388 Front House Milwaukee, WI | 4.0 | 1.0 | 1212 | $1,550 | $1.28 | 5d | 1 | 0.83mi |
| 2704 W Concordia Ave Unit Na Milwaukee, WI | 5.0 | 2.0 | 1856 | $2,500 | $1.35 | 25d | 1 | 0.90mi |
| 2945 N 23rd St Milwaukee, WI | 3.0 | 1.0 | 1014 | $1,195 | $1.18 | 45d | 1 | 0.95mi |
| 2821 W Concordia Ave Milwaukee, WI | 3.0 | 1.5 | 1098 | $1,595 | $1.45 | 3d | 1 | 0.98mi |
| 3703 N 1st St Unit Upper-3705 Milwaukee, WI | 3.0 | 1.0 | 1034 | $1,200 | $1.16 | 45d | 1 | 1.00mi |
| 2741 N 23rd St Unit 2 Milwaukee, WI | 3.0 | 1.0 | 1000 | $1,100 | $1.10 | 18d | 1 | 1.17mi |
| 2741 N 23rd St Milwaukee, WI | 3.0 | 1.0 | 900 | $1,050 | $1.17 | 15d | 1 | 1.17mi |
| 312 E Townsend St Unit 312 Milwaukee, WI | 3.0 | 1.0 | 1400 | $1,250 | $0.89 | 25d | 1 | 1.24mi |
| 2765 N 26th St Unit 1 Milwaukee, WI | 3.0 | 1.0 | 1125 | $1,200 | $1.07 | 5d | 1 | 1.28mi |
| 2870 N 29th St #2872 Milwaukee, WI | 3.0 | 1.0 | 1300 | $1,250 | $0.96 | 45d | 1 | 1.28mi |
| 223 E Burleigh St Unit 223 Milwaukee, WI | 4.0 | 1.0 | 1153 | $1,395 | $1.21 | 45d | 1 | 1.30mi |
| 3042 N Palmer St #5 Milwaukee, WI | 3.0 | 1.0 | 1718 | $1,050 | $0.61 | 25d | 1 | 1.31mi |
| 2308 W Clarke St Milwaukee, WI | 4.0 | 2.0 | 1545 | $1,750 | $1.13 | 25d | 1 | 1.34mi |
| 3029 N Holton St Milwaukee, WI | 3.0 | 1.0 | 980 | $1,200 | $1.22 | 45d | 1 | 1.47mi |
| 2577 N Vel R Phillips Ave Milwaukee, WI | 3.0 | 1.0 | 1048 | $1,400 | $1.34 | 18d | 1 | 1.48mi |
Listing history 7 events
-
2026-04-08status Pending
-
2026-03-18price $59,000
-
2026-01-06price $88,740
-
2025-09-30historical 71-char remark
Show marketing remark (71 chars)
This is a tax foreclosed property. Owner Occupants will be prioritized.
-
2025-09-30$104,400 Active
Show marketing remark (71 chars)
This is a tax foreclosed property. Owner Occupants will be prioritized.
-
2025-08-29$104,400 Active 71-char remark
Show marketing remark (71 chars)
This is a tax foreclosed property. Owner Occupants will be prioritized.
-
1966-11-01soldstatus $13,200
ⓘ Source: listings_history table (triggers on properties + properties_extension) + one-shot
backfill from property_details.listing_events for pre-trigger history.
Tax reassessment forecast WI · Partial reset (capped growth)
- Current annual tax
- $1,307 · $109/mo
- Projected year-2 tax
- $1,307 · $109/mo
- Expected delta
- $0/yr ($0/mo · 0.0%)
ⓘ Screening estimate from a state-policy table — verify with the county assessor before closing.
Climate risk First Street
- Flood 5/10 Major FEMA zone X (unshaded) · 66% chance over 30 yrs
- Wildfire 1/10 Low
- Heat 2/10 Low 7 d/yr ≥98°F today · 13 d/yr by 30 yrs out
- Wind 2/10 Low
- Air quality 3/10 Moderate 3 unhealthy d/yr today · 4 by 30 yrs out
Nearby sold comps map
Loading sold comps map…
Walkable amenities ~0.75 mi
Loading nearby amenities…
Taxation est. · year 1
- Rental income
- $16,141
- − Mortgage interest
- −$3,305
- − Property taxes
- −$1,307
- − Insurance
- −$295
- − Repairs & maintenance
- −$1,291
- − Management
- −$1,291
- − Depreciation
- −$1,716
- Taxable income
- $6,935
- Est. tax owed @ 24.0%
- −$1,664
- After-tax cash flow
- $5,772/yr
For passive investors: Depreciation is non-cash, so a rental often shows a tax loss while cash-flowing — sheltering income. Rental losses are passive: they offset passive income freely, and up to $25,000/yr can offset ordinary (W-2) income if you actively participate and your MAGI is under $100k (phasing out to $0 by $150k); unused losses carry forward. On sale, claimed depreciation is recaptured at up to 25%, and gains may owe capital-gains tax (a 1031 exchange can defer both). Figures are a year-1 estimate at your 24.0% rate — not tax advice; consult a CPA.
Schools (NCES district)
- District
- Milwaukee School District
- NCES district ID
- 5509600
- Math proficiency
- 10% ▼ -5.00%
- Reading proficiency
- 18% ▬ 0.00%
- Median HH income
- $36,339
- Composite
- 11.61/100
- National rank
- #9696
- State rank
- #337 of 342 in WI
Livability — Milwaukee
- Score
- 81/100
- State rank
- #55
- US rank
- #1534
Category grades
Schools grade is shown separately in the Schools card above.
Census & demographics
- Census place
- Milwaukee, WI
- County
- Milwaukee County · 926,379 people
- City population
- 573,768
- Metro
- Milwaukee-Waukesha, WI
- Population (ZIP)
- 19,887
- Household income
- $29,336
- Rent vs Own
- Severe rent burden
- 2061.0
Population outlook (Milwaukee County) Hauer SSP2
- Today (2025)
- 995,758 people
- By 2030
- 1,009,124 · +1.3%
- By 2040
- 1,028,128 · +3.3%
- By 2050
- 1,040,066 · +4.4%
- By 2075
- 1,057,849 · +6.2%
- By 2100
- 1,039,774 · +4.4%
Race, ethnicity, and origin ACS 2023
- Neighborhood character
- Predominantly Black (91%)
- Race & ethnicity
- Black 91% Two or more races 3% White 3% Hispanic / Latino 3%
- Common ancestry
- Norwegian 1%
- Foreign-born
- 1% · Canada
- Languages at home
- 97% English-only · Spanish 2%
Political lean MEDSL · Milwaukee
- 2024 margin
- Solid D (+38.5) · D 68.3% · R 29.8% · Other 1.8%
- 2008→2024 swing
- +2.7pp toward D · 2008: 35.9pp · 2024: 38.5pp
- All cycles
- 2024: D+38.5 2020: D+39.9 2016: D+37.5 2012: D+34.6 2008: D+35.9
Not yet ingested
- Civics
- —
Market trends
- HPI YoY
- ▲ 133.03%
- Current HPI
- 397.7151
- Rent YoY
- ▲ 8.28%
- Metro
- Milwaukee-Waukesha, WI
- State GDP YoY
- ▲ 2.10%
- F500 in state
- 20
Industry mix (Fortune 500 HQ in WI)
| Industry | F500 HQs | Revenue |
|---|---|---|
| Industrial Machinery | 4 | $23B |
|
||
| Industrial Technology | 2 | $36B |
|
||
| Insurance | 1 | $36B |
|
||
| Professional Services | 1 | $19B |
|
||
| Utilities | 1 | $9B |
|
||
| Consumer Goods | 1 | $3B |
|
||
Price history
+347.0% since first listed7 events — show timeline
- 2026-04-08 Pending — METROMLS
- 2026-03-18 Price Changed $59,000 METROMLS
- 2026-01-06 Price Changed $88,740 METROMLS
- 2025-09-30 Listing Removed — METROMLS
- 2025-09-30 Listed $104,400 METROMLS
- 2025-08-29 Listed $104,400 METROMLS
- 1966-11-01 Sold (Public Records) $13,200 Public Records
Property tax history
-0.9%/yrLatest (2024): $1,307 · -51.4% YoY. Source: county tax records.
Cash-flow waterfall
monthlySold comps — $/sqft
last 12 mo · ≤1 miLoading sold comps…