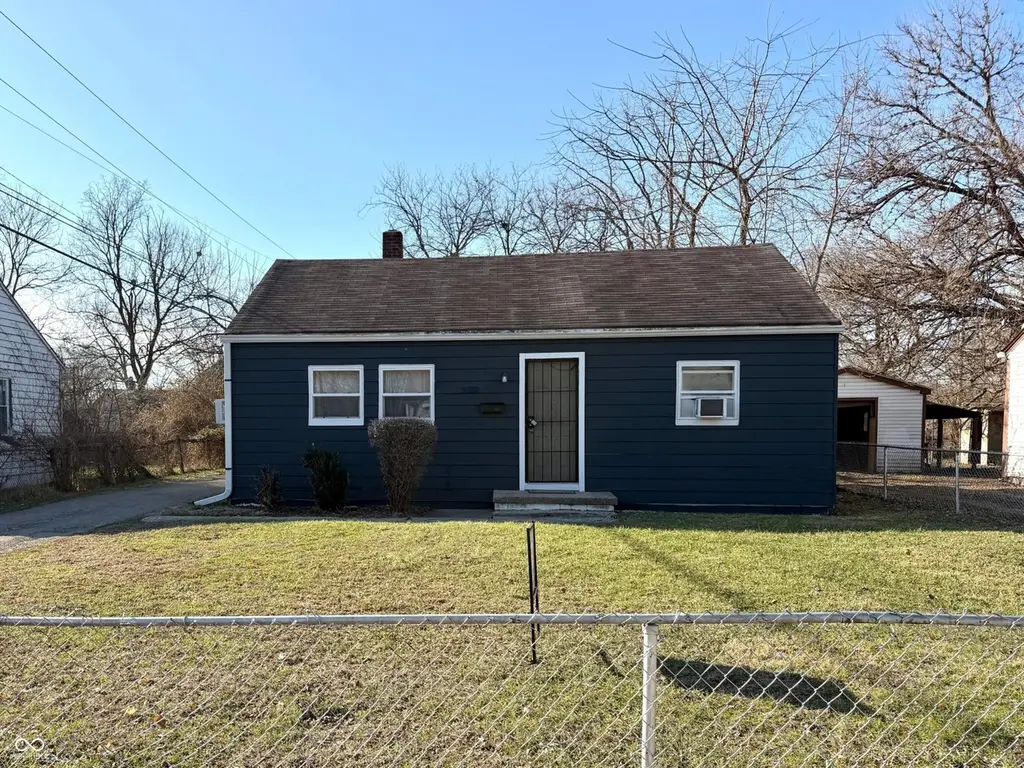
3102 N Temple Ave · Indianapolis city (balance), IN
Flood risk 8/10 · Major
- FEMA flood zone
- X (unshaded)
- Chance of flooding over 30 yrs
- 0.99%
- Est. flood insurance / yr
- $507 – $1,088
Fire risk 1/10 · Minimal
- Est. fire insurance / yr
- $717 – $1,331
Heat risk 3/10 · Minor
- Hot days now (above 102°F)
- 7 days/yr
- Hot days in 30 yrs
- 18 days/yr
Wind risk 2/10 · Minimal
- Chance of severe wind over 30 yrs
- 1.0%
Air-quality risk 4/10 · Minor
- Unhealthy air days now
- 5 days/yr
- Unhealthy air days in 30 yrs
- 7 days/yr
Risk factors via First Street. Map © Google.
Why this score? — see what drove the B grade
The composite is a weighted blend of 9 inputs, each scored 0–100. Each bar is that input's sub-score; the figure is the points it added to the 100-point composite (weight × sub-score).
- Cash flow +30.0/30.0
- ARV discount +15.0/15.0
- 1% rule +10.0/10.0
- DSCR +10.0/10.0
- Rent growth +2.7/5.0
- Livability +2.5/5.0
- Condition / age +2.5/5.0
- Schools +1.4/10.0
- Appreciation +0.0/10.0
$85,000
🖨 Deal sheet 📄 Offer letter ✓ Due diligence
Listing remarks MLS
Single story home featuring 3 bedrooms and 1 full bath, perfect for investors or owner occupant buyers looking to add their own personal touches. The property includes a detached single car garage and a spacious backyard. With its versatile layout and great potential, this property is a fantastic opportunity to create value and make it your own. Great location and just minutes from downtown. Don't miss out!
Key facts
- Spacious backyard
- Single story home
- 7,144 sq ft lot
Tags
Neighborhood map
What this means for you Summary
Snapshot
- This is a 3-bed/1.0-bath single-family listed at $85k.
Deal economics
- At list price, monthly cash flow is $356 ($4k/yr) — positive.
- The deal already cash-flows at list — no discount required.
- Meets the 1% rule at list price ($1k rent vs $85k).
- Recommended offer: $75k (12.0% below list) — sets the bar for market timing.
- Cap rate 12.3% vs local median 4.4% in Indianapolis city (balance) — top-decile yield for the area; either an underpriced asset or a hidden risk that comps aren't pricing in. Stress-test before assuming the spread holds.
Location & tenants
- Location reads: area grade B — affects rentability + tenant quality, not the cash-flow math above.
- Indianapolis Public Schools (urban): math 14% / reading 20% proficiency, ranked #286 of 301 in IN (top 95%) — low school quality limits family demand, transient renter base, plan for 1-2y turnover; 77% free/reduced lunch — lower-income household profile, screen leases tightly.
- Market conditions: Rents flat; 334 active listings in the ZIP; 40 comparable units currently listed for rent nearby; rentals at typical pace (median 20d on market — plan ~3-4 weeks tenant-placement turnaround); lower-income renter base — watch delinquency; 1,906 units permitted in Marion County in 2024 (621 in 5+ unit buildings).
- This rent runs 41% of the median local income ($38k/yr) — at the standard rent-burdened threshold; future hikes will face affordability resistance.
Forward outlook
- Local home prices are declining (-3.0%/yr); year-one equity from $588 of loan paydown is wiped out by about $3k of value loss. Plan a longer hold.
- Marion County population projected at +18% by 2050 — long-run rental-demand tailwind backs the buy-and-hold thesis.
- At projected returns (-3.0% appreciation + 0.8% rent growth), your $24k cash investment doubles in ~9 years — after that, you're playing with house money.
Negotiation context
- It's been on market 176 days — a 12% lower offer ($75k) is reasonable based on typical stale-listing flexibility.
- 2 sale attempts; this cycle's ask has dropped $40k (32%) from the opening price — seller is motivated, your offer sets the floor, not the list.
Risks & watch-outs
- Watch-outs: flood insurance adds $66/mo; built in 1947 — expect roof / HVAC / electrical / plumbing capex.
- Climate carrying-cost: severe flood risk — expect insurance premiums to compound above CPI over the hold.
Questions for the listing agent
- It's been on market 176 days. Have you received any prior offers? Is the seller open to a 12% concession, seller financing, or rate buy-down credit?
- Built in 1947 — when were the roof, HVAC, electrical panel, plumbing, and water heater last replaced?
- What's the actual annual flood-insurance premium (NFIP or private), and is the property in a SFHA with mandatory coverage?
- Why hasn't it sold? Are there any deal-killer items the seller is aware of (foundation, flood, title, zoning, code violations)?
- Is there a deadline driving the sale (1031 exchange, divorce, estate, relocation)? That informs how much negotiation room exists.
- What's the average days-on-market for RENTAL listings here right now (not sales)? A rising rental-DOM trend means longer vacancies and softer asking-rent achievability than the comps imply.
- What's the recent tenant-quality profile in this submarket — average credit score on applications, eviction rate, late-payment / NSF rate, and stable-employment percentage? A property-management company in the area should have these aggregated.
- How much new for-sale + rental construction is in the pipeline within 1–3 miles? Heavy new supply typically softens prices + rents 12–24 months out; constrained supply supports both.
Investment metrics
- 1% rule
- 1.53% ✓
- Cap rate
- 12.26%
- Cash-on-cash
- 21.31%
- DSCR
- 1.95
- GRM
- 5.4
CMA / ARV
- ARV (median comp)
- $127,253
- List price
- $85,000
- Delta
- -33.20%
- Verdict
- UNDERPRICED
- Comps
- 20 within 1.0 mi
Show comp detail 12 sales within ~0.75 mi
| Address | Dist | Beds/Ba | Sqft | Sold | Price | $/sf | Match |
|---|---|---|---|---|---|---|---|
| 3038 Baltimore Ave | 0.36mi | 2/1.0 (-1) | 924 (+4%) | 4mo | $98,500 | $107 | 68 |
| 2951 Hillside Ave | 0.27mi | 3/2.0 | 980 (+10%) | 3mo | $156,000 | $159 | 64 |
| 2818 N Lasalle St | 0.59mi | 3/2.0 | 875 (-2%) | 2mo | $195,000 | $223 | 64 |
| 2929 Manlove Ave | 0.46mi | 3/1.0 | 960 (+8%) | 2mo | $139,000 | $145 | 63 |
| 3045 N Lasalle St | 0.36mi | 3/2.0 | 952 (+7%) | 12mo | $175,000 | $184 | 58 |
| 2942 N Dearborn St | 0.43mi | 2/1.0 (-1) | 825 (-7%) | 7mo | $70,000 | $85 | 57 |
| 3511 N Keystone Ave | 0.52mi | 2/1.0 (-1) | 837 (-6%) | 10mo | $113,500 | $136 | 53 |
| 2601 Manlove Ave | 0.69mi | 3/1.0 | 972 (+9%) | 1mo | $174,900 | $180 | 51 |
| 3015 Adams St | 0.55mi | 2/1.0 (-1) | 819 (-8%) | 9mo | $155,000 | $189 | 48 |
| 2968 N Gale St | 0.74mi | 3/2.0 | 864 (-3%) | 12mo | $115,000 | $133 | 46 |
| 2839 N Lasalle St | 0.59mi | 2/1.0 (-1) | 768 (-14%) | 5mo | $55,000 | $72 | 40 |
| 3317 Adams St | 0.68mi | 3/1.0 | 988 (+11%) | 12mo | $70,000 | $71 | 39 |
Match score weights: distance 35% · size 25% · config 20% · recency 20%. Top-matched comps best support the ARV.
Projected returns pro-forma
-3.0% appreciation · 0.81% rent growth · sell at horizon
- IRR
- 6.8%
- Equity multiple
- 1.26×
- Total profit
- $6,176
- Equity at exit
- $12,674
- IRR
- 14.0%
- Equity multiple
- 2.00×
- Total profit
- $23,863
- Equity at exit
- $7,349
Cash invested: $23,800 (down + closing). Projections, not guarantees.
Landlord ↔ Tenant lean methodology
- Overall (STATE)
- 90 Strongly Landlord-Friendly
- State Indiana
- 90 Strongly Landlord-Friendly · R+11
- County
- — inherits STATE
- City
- — inherits STATE
ZIP-level market 46218
- Home prices YoY
- -17.1%
- Rents YoY
- 0.8%
- Active inventory
- 334
- Price-to-rent
- 5.4×
Monthly cashflow live
- Estimated rent
- $1,300 high interval (Pro) →
- Mortgage (P&I)
- −$446
- Tax from tax record
- −$123 /mo · $1,481/yr
- Insurance
- −$35
- Flood insurance flood zone
- −$66 /mo · $798/yr
- HOA
- −$0
- Vacancy / Maint / Mgmt
- −$273
- Net cashflow
- $356
Break-even live
UW: 25.0% down · 7.5% · 30yr · 1.5% tax · 5.0% vac · 8.0% maint · 8.0% mgmt
Financing live
Cash to close
- Down payment
- $21,250
- Closing costs
- $2,550
- Reserves months
- —
- Total cash needed
- —
Loan-product check · same deal, 3 products live
Conventional
25% down · 7.5% · 30yr
- Down + closing
- —
- Monthly P&I
- —
- Monthly cashflow
- —
- DSCR
- —
- Eligible?
- —
Personal DTI + credit; lowest rate.
DSCR
20% down · 8.5% · 30yr
- Down + closing
- —
- Monthly P&I
- —
- Monthly cashflow
- —
- DSCR
- —
- Eligible?
- —
No personal income docs; deal must DSCR.
Hard money
10% down · 12.0% · 12mo
- Down + closing
- —
- Monthly P&I
- —
- Monthly cashflow
- —
- DSCR
- —
- Eligible?
- —
Short-term bridge; refi at stabilization.
Rent comps 40 comps
| Address | Beds | Baths | Sqft | Rent | $/sqft | DOM | Units | Dist |
|---|---|---|---|---|---|---|---|---|
| 2931 N Tacoma Ave Unit 31 Indianapolis, IN | 2.0 | 1.0 | 800 | $950 | $1.19 | 7d | 1 | 0.23mi |
| 3363 Nicholas Ave Indianapolis, IN | 2.0 | 1.0 | 720 | $1,000 | $1.39 | 4d | 1 | 0.47mi |
| 2820 Caroline Ave Indianapolis, IN | 3.0 | 1.5 | 1112 | $1,250 | $1.12 | 24d | 1 | 0.47mi |
| 2920 N Lasalle St Indianapolis, IN | 3.0 | 1.0 | 875 | $1,095 | $1.25 | 18d | 1 | 0.53mi |
| 2906 N Lasalle St Indianapolis, IN | 4.0 | 1.0 | 1032 | $950 | $0.92 | 24d | 1 | 0.55mi |
| 2949 Adams St Indianapolis, IN | 2.0 | 1.0 | 978 | $1,150 | $1.18 | 44d | 1 | 0.60mi |
| 3535 N Oxford St Indianapolis, IN | 3.0 | 1.0 | 1015 | $1,500 | $1.48 | 22d | 1 | 0.62mi |
| 3472 N Dearborn St Indianapolis, IN | 2.0 | 1.0 | 890 | $1,099 | $1.23 | 20d | 1 | 0.63mi |
| 1902 E 35th St Indianapolis, IN | 3.0 | 1.0 | 1100 | $1,600 | $1.45 | 44d | 1 | 0.70mi |
| 2010 E 25th St Indianapolis, IN | 2.0 | 1.0 | 792 | $775 | $0.98 | 24d | 1 | 0.71mi |
| 3207 N Arsenal Ave Indianapolis, IN | 3.0 | 1.0 | 994 | $1,195 | $1.20 | 24d | 1 | 0.74mi |
| 3741 N Tacoma Ave Indianapolis, IN | 3.0 | 1.0 | 913 | $2,200 | $2.41 | 18d | 1 | 0.80mi |
| 3421 N Olney St Indianapolis, IN | 2.0 | 1.0 | 720 | $1,195 | $1.66 | 16d | 1 | 0.81mi |
| 3709 Kinnear Ave Indianapolis, IN | 2.0 | 1.0 | 650 | $1,000 | $1.54 | 44d | 1 | 0.81mi |
| 2722 N Olney St Indianapolis, IN | 2.0 | 1.0 | 650 | $795 | $1.22 | 44d | 1 | 0.82mi |
| 3522 N Olney St Indianapolis, IN | 3.0 | 1.0 | 768 | $1,300 | $1.69 | 44d | 1 | 0.86mi |
| 3132 Dr Andrew J Brown Ave Indianapolis, IN | 2.0 | 1.0–2.0 | 791 | $2,120 | $2.68 | 2d | 46 | 0.87mi |
| 2372 Beckwith Dr Indianapolis, IN | 4.0 | 1.0–1.5 | 779 | $1,206 | $1.55 | 2d | 32 | 0.88mi |
| 3383 Station St Indianapolis, IN | 3.0 | 1.0 | 744 | $1,250 | $1.68 | 24d | 1 | 0.90mi |
| 2410 Adams St Indianapolis, IN | 3.0 | 1.0 | 900 | $1,200 | $1.33 | 10d | 1 | 0.92mi |
| 3139 Guilford Ave Indianapolis, IN | 3.0 | 1.0 | 1068 | $1,345 | $1.26 | 44d | 1 | 1.03mi |
| 2549 Columbia Ave Unit 1332865P Indianapolis, IN | 3.0 | 2.0 | 893 | $2,274 | $2.55 | 2d | 1 | 1.05mi |
| 3920 E 30th St Indianapolis, IN | 3.0 | 1.0 | 1071 | $1,350 | $1.26 | 7d | 1 | 1.06mi |
| 3920 E 30th St Indianapolis, IN | 3.0 | 1.0 | 1071 | $1,350 | $1.26 | 4d | 1 | 1.06mi |
| 3203 Sutherland Ave Unit 1310761P Indianapolis, IN | 2.0 | 1.0 | 1097 | $3,668 | $3.34 | 2d | 1 | 1.11mi |
| 2862 N Chester Ave Indianapolis, IN | 3.0 | 2.0 | 1076 | $1,520 | $1.41 | 44d | 1 | 1.13mi |
| 2864 Forest Manor Ave Indianapolis, IN | 3.0 | 1.0 | 1018 | $1,500 | $1.47 | 24d | 1 | 1.21mi |
| 3725 N Sherman Dr #7 Indianapolis, IN | 2.0 | 1.0 | 729 | $845 | $1.16 | 4d | 1 | 1.22mi |
| 3615 Sherman Forest Dr Indianapolis, IN | 4.0 | 1.0–2.5 | 1057 | $1,544 | $1.46 | 4d | 1 | 1.22mi |
| 3149 N Gladstone Ave Indianapolis, IN | 3.0 | 1.5 | 1036 | $1,350 | $1.30 | 7d | 1 | 1.26mi |
| 2045 N Dearborn St Indianapolis, IN | 3.0 | 2.0 | 912 | $1,145 | $1.26 | 24d | 1 | 1.28mi |
| 916 Fairfield Ave Unit 918 Indianapolis, IN | 3.0 | 1.0 | 1000 | $1,300 | $1.30 | 7d | 1 | 1.28mi |
| 2529 Guilford Ave Unit A Indianapolis, IN | 2.0 | 1.5 | 1000 | $1,495 | $1.50 | 44d | 1 | 1.31mi |
| 3359 N College Ave Unit 3359 Indianapolis, IN | 2.0 | 1.5 | 1082 | $1,895 | $1.75 | 24d | 1 | 1.34mi |
| 3142 N Euclid Ave Indianapolis, IN | 3.0 | 1.0 | 1050 | $1,050 | $1.00 | 44d | 1 | 1.36mi |
| 4115 Meadows Dr Indianapolis, IN | 1.0–3.0 | 1.0–2.0 | 1013 | $1,592 | $1.57 | 44d | 9 | 1.40mi |
| 2815 Brookside Ave Indianapolis, IN | 3.0 | 2.0 | 1120 | $1,350 | $1.21 | 10d | 1 | 1.42mi |
| 3315 N Euclid Ave Indianapolis, IN | 2.0 | 1.0 | 780 | $1,300 | $1.67 | 15d | 1 | 1.44mi |
| 2841 E 19th St Indianapolis, IN | 2.0 | 1.0 | 812 | $850 | $1.05 | 4d | 1 | 1.46mi |
| 3909 Winthrop Ave Unit B Indianapolis, IN | 2.0 | 1.5 | 931 | $1,550 | $1.66 | 12d | 1 | 1.47mi |
Listing history 18 events
-
2026-06-18days on market $85,000 Active 176 DOM
-
2026-06-17pricedays on market $85,000 Active 175 DOM
-
2026-06-16days on market $90,000 Active 174 DOM
-
2026-06-15days on market $90,000 Active 173 DOM
-
2026-06-13days on market $90,000 Active 171 DOM
-
2026-06-13days on market $90,000 Active 170 DOM
-
2026-06-09days on market $90,000 Active 167 DOM
-
2026-06-08days on market $90,000 Active 166 DOM
-
2026-06-07pricedays on market $90,000 Active 165 DOM
-
2026-06-03days on market $100,000 Active 161 DOM
-
2026-06-02days on market $100,000 Active 160 DOM
-
2026-06-01days on market $100,000 Active 159 DOM
-
2026-05-31days on market $100,000 Active 158 DOM
-
2026-05-14price $110,000 410-char remark
Show marketing remark (410 chars)
Single story home featuring 3 bedrooms and 1 full bath, perfect for investors or owner occupant buyers looking to add their own personal touches. The property includes a detached single car garage and a spacious backyard. With its versatile layout and great potential, this property is a fantastic opportunity to create value and make it your own. Great location and just minutes from downtown. Don't miss out!
-
2026-04-29status Active 410-char remark
Show marketing remark (410 chars)
Single story home featuring 3 bedrooms and 1 full bath, perfect for investors or owner occupant buyers looking to add their own personal touches. The property includes a detached single car garage and a spacious backyard. With its versatile layout and great potential, this property is a fantastic opportunity to create value and make it your own. Great location and just minutes from downtown. Don't miss out!
-
2026-04-08status Pending 410-char remark
Show marketing remark (410 chars)
Single story home featuring 3 bedrooms and 1 full bath, perfect for investors or owner occupant buyers looking to add their own personal touches. The property includes a detached single car garage and a spacious backyard. With its versatile layout and great potential, this property is a fantastic opportunity to create value and make it your own. Great location and just minutes from downtown. Don't miss out!
-
2026-02-05price $119,000 410-char remark
Show marketing remark (410 chars)
Single story home featuring 3 bedrooms and 1 full bath, perfect for investors or owner occupant buyers looking to add their own personal touches. The property includes a detached single car garage and a spacious backyard. With its versatile layout and great potential, this property is a fantastic opportunity to create value and make it your own. Great location and just minutes from downtown. Don't miss out!
-
2025-12-03$125,000 Active 410-char remark
Show marketing remark (410 chars)
Single story home featuring 3 bedrooms and 1 full bath, perfect for investors or owner occupant buyers looking to add their own personal touches. The property includes a detached single car garage and a spacious backyard. With its versatile layout and great potential, this property is a fantastic opportunity to create value and make it your own. Great location and just minutes from downtown. Don't miss out!
ⓘ Source: listings_history table (triggers on properties + properties_extension) + one-shot
backfill from property_details.listing_events for pre-trigger history.
Tax reassessment forecast IN · Partial reset (capped growth)
- Current annual tax
- $1,481 · $123/mo
- Projected year-2 tax
- $1,481 · $123/mo
- Expected delta
- $0/yr ($0/mo · 0.0%)
ⓘ Screening estimate from a state-policy table — verify with the county assessor before closing.
Climate risk First Street
- Flood 8/10 Severe FEMA zone X (unshaded) · 99% chance over 30 yrs
- Wildfire 1/10 Low
- Heat 3/10 Moderate 7 d/yr ≥102°F today · 18 d/yr by 30 yrs out
- Wind 2/10 Low 100% chance of damaging wind over 30 yrs
- Air quality 4/10 Moderate 5 unhealthy d/yr today · 7 by 30 yrs out
Nearby sold comps map
Loading sold comps map…
Walkable amenities ~0.75 mi
Loading nearby amenities…
Taxation est. · year 1
- Rental income
- $15,602
- − Mortgage interest
- −$4,761
- − Property taxes
- −$1,481
- − Insurance
- −$1,222
- − Repairs & maintenance
- −$1,248
- − Management
- −$1,248
- − Depreciation
- −$2,473
- Taxable income
- $3,169
- Est. tax owed @ 24.0%
- −$760
- After-tax cash flow
- $3,513/yr
For passive investors: Depreciation is non-cash, so a rental often shows a tax loss while cash-flowing — sheltering income. Rental losses are passive: they offset passive income freely, and up to $25,000/yr can offset ordinary (W-2) income if you actively participate and your MAGI is under $100k (phasing out to $0 by $150k); unused losses carry forward. On sale, claimed depreciation is recaptured at up to 25%, and gains may owe capital-gains tax (a 1031 exchange can defer both). Figures are a year-1 estimate at your 24.0% rate — not tax advice; consult a CPA.
Schools (NCES district)
- District
- Indianapolis Public Schools
- NCES district ID
- 1804770
- Math proficiency
- 14% ▼ -7.00%
- Reading proficiency
- 20% ▼ -3.00%
- Median HH income
- $32,034
- Composite
- 13.69/100
- National rank
- #9499
- State rank
- #286 of 301 in IN
Livability — Indianapolis city (balance)
No livability data for this city. (Only ~50 U.S. cities are tracked.)
Census & demographics
- Census place
- Indianapolis city (balance), IN
- County
- Marion County · 998,460 people
- City population
- 881,119
- Metro
- Indianapolis-Carmel-Anderson, IN
- Population (ZIP)
- 29,360
- Household income
- $38,063
- Rent vs Own
- Severe rent burden
- 2340.0
Population outlook (Marion County) Hauer SSP2
- Today (2025)
- 1,025,572 people
- By 2030
- 1,065,727 · +3.9%
- By 2040
- 1,141,577 · +11.3%
- By 2050
- 1,208,920 · +17.9%
- By 2075
- 1,367,288 · +33.3%
- By 2100
- 1,438,201 · +40.2%
Race, ethnicity, and origin ACS 2023
- Neighborhood character
- Predominantly Black (68%)
- Race & ethnicity
- Black 68% White 18% Hispanic / Latino 9% Two or more races 6%
- Hispanic origin (detail)
- Mexican 6%
- Common ancestry
- Romanian 1%
- Foreign-born
- 5% · Canada, Philippines
- Languages at home
- 92% English-only · Spanish 7%
Political lean MEDSL · Marion
- 2024 margin
- Strong D (+27.7) · D 63.0% · R 35.3% · Other 1.7%
- 2008→2024 swing
- -0.7pp no change · 2008: 28.4pp · 2024: 27.7pp
- All cycles
- 2024: D+27.7 2020: D+29.1 2016: D+22.8 2012: D+22.2 2008: D+28.4
Not yet ingested
- Civics
- —
Market trends
- HPI YoY
- ▼ -81.57%
- Current HPI
- 395.7071
- Rent YoY
- ▲ 0.81%
- Metro
- Indianapolis-Carmel-Anderson, IN
- State GDP YoY
- ▲ 2.90%
- F500 in state
- 18
Industry mix (Fortune 500 HQ in IN)
| Industry | F500 HQs | Revenue |
|---|---|---|
| Industrial Machinery | 2 | $37B |
|
||
| Healthcare | 1 | $177B |
|
||
| Pharmaceuticals | 1 | $45B |
|
||
| Metals / Steel | 1 | $18B |
|
||
| Agriculture | 1 | $17B |
|
||
| Packaging | 1 | $12B |
|
||
Price history
-12.0% since first listed5 events — show timeline
- 2026-05-14 Price Changed $110,000 MIBOR as Distributed by MLS Grid
- 2026-04-29 Relisted — MIBOR as Distributed by MLS Grid
- 2026-04-08 Pending — MIBOR as Distributed by MLS Grid
- 2026-02-05 Price Changed $119,000 MIBOR as Distributed by MLS Grid
- 2025-12-03 Listed $125,000 MIBOR as Distributed by MLS Grid
Property tax history
+23.1%/yrLatest (2025): $1,481 · +23.6% YoY. Source: county tax records.
Cash-flow waterfall
monthlySold comps — $/sqft
last 12 mo · ≤1 miLoading sold comps…