5151 Highway A1a #105 · Indian River Shores, FL
Flood risk 9/10 · Severe
- FEMA flood zone
- X (shaded)
- Chance of flooding over 30 yrs
- 0.99%
- Est. flood insurance / yr
- $507 – $1,088
Fire risk 1/10 · Minimal
- Est. fire insurance / yr
- $947 – $1,759
Heat risk 10/10 · Severe
- Hot days now (above 105°F)
- 8 days/yr
- Hot days in 30 yrs
- 26 days/yr
Wind risk 10/10 · Severe
- Chance of severe wind over 30 yrs
- 99.0%
Air-quality risk 1/10 · Minimal
- Unhealthy air days now
- 0 days/yr
- Unhealthy air days in 30 yrs
- 0 days/yr
Risk factors via First Street. Map © Google.
Why this score? — see what drove the C- grade
The composite is a weighted blend of 9 inputs, each scored 0–100. Each bar is that input's sub-score; the figure is the points it added to the 100-point composite (weight × sub-score).
- Cash flow +17.5/30.0
- 1% rule +8.2/10.0
- ARV discount +7.5/15.0
- DSCR +5.5/10.0
- Rent growth +5.0/5.0
- Schools +4.2/10.0
- Livability +3.4/5.0
- Condition / age +2.5/5.0
- Appreciation +0.0/10.0
$225,000
🖨 Deal sheet (PDF) 📄 Offer letter ✓ Due diligence
Listing remarks
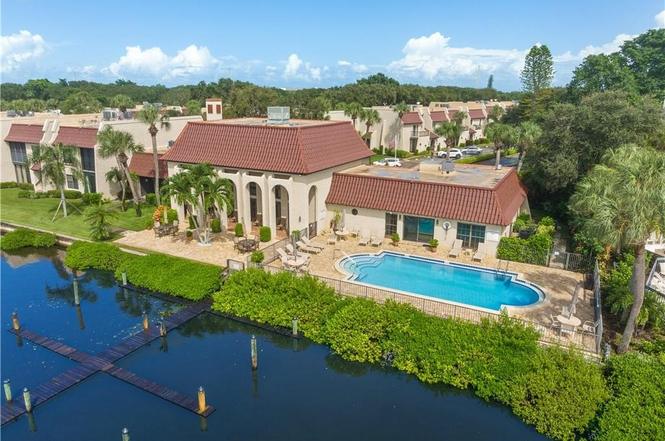
Experience the essence of the Florida lifestyle with breathtaking river views from this first-floor unit. The serene dining and living rooms offer a peaceful retreat, while a cozy sitting area off the bedroom provides a perfect spot to unwind. Located near the clubhouse, this property is just a short distance from the beach, restaurants, and shopping. Embrace the beauty of living on the river each day and savor the value that comes with such stunning views.
Key facts
- First-floor unit
- Cozy sitting area
- River views
Tags
Property features AI
Finance
- Financial info: Pets not allowed
- HOA & community: Association: AR Choice / Deanna; Association fee $552 monthly (dues paid quarterly); Association covers maintenance of grounds, parking, recreation facilities, and reserve fund; Community features include fitness facilities, sidewalks, and a pool; Senior community
Exterior
- Parking: Assigned uncovered parking
- Utilities: Public water; County sewer
- Home design: 2-story building; Residential property; Block and concrete construction
- Construction: Block and concrete construction
- Exterior features: No additional exterior features listed; Community pool; Less than quarter acre lot; Riverfront with seawall; North-facing view; Has view; Property attached
Interior
- Kitchen: Range; Microwave; Dishwasher; Refrigerator; Electric water heater
- Bedrooms: One bedroom (10x14)
- Flooring: Tile; Wood
- Bathrooms: 1 full bathroom
- Heating & cooling: Central heating; Central air
- Interior features: Built-in features; Crown molding; Walk-in closet(s); Window treatments; Sliding doors; Unfurnished
- Laundry & utility: In-unit washer and dryer
Neighborhood map
What this means for you Summary
Snapshot
- This is a 1-bed/1.0-bath condo listed at $225k.
Deal economics
- At list price, monthly cash flow is $108 ($1k/yr) — positive.
- The deal already cash-flows at list — no discount required.
- Meets the 1% rule at list price ($3k rent vs $225k).
- Recommended offer: $198k (12.0% below list) — sets the bar for market timing.
- Cap rate 7.2% vs local median 1.5% in Indian River Shores — top-decile yield for the area; either an underpriced asset or a hidden risk that comps aren't pricing in. Stress-test before assuming the spread holds.
Location & tenants
- Location reads 68/100 on livability (#517 in FL) — a middle-class / working-renter tenant base. Strengths: crime A+, employment A+, housing A-; Watch: schools C-, amenities F, commute F.
- Indian River (other): math 48% / reading 52% proficiency, ranked #35 of 73 in FL (top 48%) — acceptable for families but not a draw, mixed tenant base, ~2y average lease.
- Market conditions: Rents rising fast (+11.0%/yr); 498 active listings in the ZIP; 14 comparable units currently listed for rent nearby; rentals at typical pace (median 22d on market — plan ~3-4 weeks tenant-placement turnaround); high-income renter base; 564 units permitted in Indian River County in 2024 (281 in 5+ unit buildings).
Forward outlook
- Local home prices are declining (-3.0%/yr); year-one equity from $2k of loan paydown is wiped out by about $7k of value loss. Plan a longer hold.
- Indian River County population projected at +18% by 2050 — long-run rental-demand tailwind backs the buy-and-hold thesis.
- At projected returns (-3.0% appreciation + 8.0% rent growth), your $63k cash investment doubles in ~10 years — after that, you're playing with house money.
Negotiation context
- It's been on market 325 days — a 12% lower offer ($198k) is reasonable based on typical stale-listing flexibility.
- 9 sale attempts since 19y ago; this cycle's ask has dropped $174k (44%) from the opening price — seller is motivated, your offer sets the floor, not the list.
- Current owner paid $148k; list at $225k implies a 52% gain — meaningful room to come down on a strong offer.
Risks & watch-outs
- Watch-outs: flood insurance adds $66/mo.
- Climate carrying-cost: severe flood risk; severe wind risk, 99% chance of damaging wind over 30y; extreme-heat days projected 8→26/yr by 2055 (HVAC capex compounding) — expect insurance premiums to compound above CPI over the hold.
Questions for the listing agent
- It's been on market 325 days. Have you received any prior offers? Is the seller open to a 12% concession, seller financing, or rate buy-down credit?
- Built in 1974 — when were the roof, HVAC, electrical panel, plumbing, and water heater last replaced?
- What's the actual annual flood-insurance premium (NFIP or private), and is the property in a SFHA with mandatory coverage?
- What does the HOA fee cover, when was the last increase, and are there any pending special assessments or reserve-fund shortfalls?
- Any open or pending special assessments — roof, HVAC, plumbing, elevator, façade? What's the per-unit balance and payoff schedule, and is the seller paying it off at close or rolling it to the buyer?
- Why hasn't it sold? Are there any deal-killer items the seller is aware of (foundation, flood, title, zoning, code violations)?
- Is there a deadline driving the sale (1031 exchange, divorce, estate, relocation)? That informs how much negotiation room exists.
- What's the average days-on-market for RENTAL listings here right now (not sales)? A rising rental-DOM trend means longer vacancies and softer asking-rent achievability than the comps imply.
- What's the recent tenant-quality profile in this submarket — average credit score on applications, eviction rate, late-payment / NSF rate, and stable-employment percentage? A property-management company in the area should have these aggregated.
- How much new apartment / multifamily construction is in the pipeline within 1–3 miles? Heavy new supply (>2% of stock underway) typically softens rents 12–24 months out; light construction supports rent growth.
Investment metrics
- 1% rule
- 1.32% ✓
- Cap rate
- 7.22%
- Cash-on-cash
- 3.32%
- DSCR
- 1.15
- GRM
- 6.3
CMA / ARV
No comps found within radius.
Projected returns pro-forma
-3.0% appreciation · 8.0% rent growth · sell at horizon
- IRR
- -5.4%
- Equity multiple
- 0.79×
- Total profit
- $-13,488
- Equity at exit
- $33,548
- IRR
- 10.9%
- Equity multiple
- 2.11×
- Total profit
- $70,190
- Equity at exit
- $19,454
Cash invested: $63,000 (down + closing). Projections, not guarantees.
Landlord ↔ Tenant lean methodology
- Overall (STATE)
- 87 Strongly Landlord-Friendly
- State Florida
- 87 Strongly Landlord-Friendly · R+3
- County
- — inherits STATE
- City
- — inherits STATE
ZIP-level market 32963
- Rents YoY
- 11.0%
- Active inventory
- 498
- Price-to-rent
- 6.3×
Monthly cashflow live
- Estimated rent
- $2,961 high interval (Pro) →
- Mortgage (P&I)
- −$1,180
- Tax from tax record
- −$340 /mo · $4,075/yr
- Insurance
- −$94
- Flood insurance flood zone
- −$66 /mo · $798/yr
- HOA
- −$552
- Vacancy / Maint / Mgmt
- −$622
- Net cashflow
- $108
Break-even live
Sensitivity live
| Price | -10% $235 | -5% $171 | +0% $108 | +5% $44 | +10% $-20 |
|---|---|---|---|---|---|
| Rent | -10% $-126 | -5% $-9 | +0% $108 | +5% $225 | +10% $342 |
| Rate | -1.0pp $221 | -0.5pp $165 | base $108 | +0.5pp $49 | +1.0pp $-10 |
UW: 25.0% down · 7.5% · 30yr · 1.5% tax · 5.0% vac · 8.0% maint · 8.0% mgmt
Financing live
Cash to close
- Down payment
- $56,250
- Closing costs
- $6,750
- Reserves months
- —
- Total cash needed
- —
Loan-product check · same deal, 3 products live
Conventional
25% down · 7.5% · 30yr
- Down + closing
- —
- Monthly P&I
- —
- Monthly cashflow
- —
- DSCR
- —
- Eligible?
- —
Personal DTI + credit; lowest rate.
DSCR
20% down · 8.5% · 30yr
- Down + closing
- —
- Monthly P&I
- —
- Monthly cashflow
- —
- DSCR
- —
- Eligible?
- —
No personal income docs; deal must DSCR.
Hard money
10% down · 12.0% · 12mo
- Down + closing
- —
- Monthly P&I
- —
- Monthly cashflow
- —
- DSCR
- —
- Eligible?
- —
Short-term bridge; refi at stabilization.
Rent comps 14 comps
| Address | Beds | Baths | Sqft | Rent | $/sqft | DOM | Units | Dist |
|---|---|---|---|---|---|---|---|---|
| 5151 Jimmy Buffett Memorial Hwy Unit 516 Indian River Shores, FL | 1.0 | 1.5 | 937 | $3,000 | $3.20 | 22d | 1 | 0.02mi |
| 5151 Jimmy Buffett Memorial Hwy Unit 514 Indian River Shores, FL | 1.0 | 1.0 | 937 | $1,750 | $1.87 | 22d | 1 | 0.04mi |
| 837 Seminole Ln Vero Beach, FL | 2.0 | 2.0 | 860 | $2,800 | $3.26 | 14d | 1 | 0.09mi |
| 5400 Jimmy Buffett Memorial Hwy Unit A19 Indian River Shores, FL | 1.0 | 1.5 | 900 | $3,000 | $3.33 | 22d | 1 | 0.26mi |
| 5400 Jimmy Buffett Memorial Hwy Unit B8 Indian River Shores, FL | 1.0 | 1.5 | 1000 | $1,650 | $1.65 | 14d | 1 | 0.32mi |
| 5400 Jimmy Buffett Memorial Hwy Unit 5400A11 Indian River Shores, FL | 1.0 | 2.0 | 1000 | $2,500 | $2.50 | 22d | 1 | 0.32mi |
| 5400 Jimmy Buffett Memorial Hwy Unit I24 Indian River Shores, FL | 1.0 | 1.5 | 1000 | $1,650 | $1.65 | 22d | 1 | 0.32mi |
| 4450 Highway A1A #404 Vero Beach, FL | 2.0 | 2.0 | 1080 | $3,499 | $3.24 | 14d | 1 | 1.00mi |
| 4450 Florida A1A Unit 102 Vero Beach, FL | 2.0 | 2.0 | 1000 | $3,900 | $3.90 | 22d | 1 | 1.00mi |
| 4450 Highway A1A #303 Vero Beach, FL | 2.0 | 2.0 | 1080 | $3,500 | $3.24 | 22d | 1 | 1.00mi |
| 4400 Highway A1A #10 Vero Beach, FL | 2.0 | 2.0 | 800 | $5,500 | $6.88 | 22d | 1 | 1.07mi |
| 4141 Ocean Dr Vero Beach, FL | 2.0–3.0 | 2.0 | 1200 | $3,500 | $2.92 | 14d | 4 | 1.24mi |
| 3939 Ocean Dr Ph 8 Vero Beach, FL | 2.0 | 2.0 | 1080 | $7,500 | $6.94 | 22d | 1 | 1.43mi |
| 3939 Ocean Dr Unit 302B Vero Beach, FL | 2.0 | 2.0 | 1100 | $5,500 | $5.00 | 22d | 1 | 1.45mi |
HOA detail condo
- Monthly dues
- $552 · $6,624/yr
- Assessments
- None detected in remarks — confirm with the listing agent.
Listing history 50 events
-
2026-06-19days on market $225,000 Active 325 DOM
-
2026-06-18price $225,000 Active 324 DOM
-
2026-06-18days on market $244,000 Active 324 DOM
-
2026-06-17days on market $244,000 Active 323 DOM
-
2026-06-16days on market $244,000 Active 322 DOM
-
2026-06-15days on market $244,000 Active 321 DOM
-
2026-06-14days on market $244,000 Active 319 DOM
-
2026-06-13days on market $244,000 Active 318 DOM
-
2026-06-10days on market $244,000 Active 316 DOM
-
2026-06-09days on market $244,000 Active 315 DOM
-
2026-06-08days on market $244,000 Active 314 DOM
-
2026-06-07days on market $244,000 Active 313 DOM
-
2026-06-05days on market $244,000 Active 310 DOM
-
2026-06-02days on market $244,000 Active 308 DOM
-
2026-06-01days on market $244,000 Active 307 DOM
-
2026-05-31days on market $244,000 Active 306 DOM
-
2026-05-30days on market $244,000 Active 305 DOM
-
2026-04-27price $249,000
-
2026-04-27price $249,000
-
2026-03-09price $289,000
-
2026-03-09price $289,000
-
2026-03-06price $289,000
-
2026-01-12price $305,000
-
2026-01-12price $305,000
-
2026-01-11price $305,000
-
2025-07-29price $335,000
-
2025-07-29price $335,000
-
2025-07-22historical
-
2025-07-02price $350,000
-
2025-07-02price $350,000
-
2025-06-02price $350,000
-
2025-03-26price $375,000
-
2025-03-26price $375,000
-
2025-03-22price $375,000
-
2025-01-03$399,000 Active
-
2025-01-02$399,000 Active
-
2024-12-22$335,000 Active
-
2024-12-21historical
-
2024-12-20historical
-
2024-10-24price $419,900
-
2024-10-24price $419,900
-
2024-06-21$439,900 Active
-
2024-06-20$439,900 Active
-
2024-06-18historical
-
2016-09-15historical
-
2016-04-25$275,000
-
2013-09-21historical
-
2010-10-26historical
-
2009-10-26$259,000
-
2007-06-01$265,000
ⓘ Source: listings_history table (triggers on properties + properties_extension) + one-shot
backfill from property_details.listing_events for pre-trigger history.
Tax reassessment forecast FL · Resets to sale price
- Current annual tax
- $4,075 · $340/mo
- Projected year-2 tax
- $4,075 · $340/mo
- Expected delta
- $0/yr ($0/mo · -0.0%)
ⓘ Screening estimate from a state-policy table — verify with the county assessor before closing.
Climate risk First Street
- Flood 9/10 Extreme FEMA zone X (shaded) · 99% chance over 30 yrs
- Wildfire 1/10 Low
- Heat 10/10 Extreme 8 d/yr ≥105°F today · 26 d/yr by 30 yrs out
- Wind 10/10 Extreme 99% chance of damaging wind over 30 yrs
- Air quality 1/10 Low 0 unhealthy d/yr today · 0 by 30 yrs out
Nearby sold comps map
Loading sold comps map…
Walkable amenities ~0.75 mi
Loading nearby amenities…
Taxation est. · year 1
- Rental income
- $35,536
- − Mortgage interest
- −$12,603
- − Property taxes
- −$4,075
- − Insurance
- −$1,922
- − Repairs & maintenance
- −$2,843
- − Management
- −$2,843
- − HOA
- −$6,624
- − Depreciation
- −$6,545
- Taxable loss
- −$1,920
- Est. tax savings @ 24.0%
- +$461
- After-tax cash flow
- $1,754/yr
For passive investors: Depreciation is non-cash, so a rental often shows a tax loss while cash-flowing — sheltering income. Rental losses are passive: they offset passive income freely, and up to $25,000/yr can offset ordinary (W-2) income if you actively participate and your MAGI is under $100k (phasing out to $0 by $150k); unused losses carry forward. On sale, claimed depreciation is recaptured at up to 25%, and gains may owe capital-gains tax (a 1031 exchange can defer both). Figures are a year-1 estimate at your 24.0% rate — not tax advice; consult a CPA.
Schools (NCES district)
- District
- Indian River
- NCES district ID
- 1200930
- Math proficiency
- 48% ▼ -9.00%
- Reading proficiency
- 52% ▼ -3.00%
- Median HH income
- $46,597
- Composite
- 42.45/100
- National rank
- #3218
- State rank
- #35 of 73 in FL
Livability — Indian River Shores
- Score
- 68/100
- State rank
- #517
- US rank
- #9512
Category grades
Schools grade is shown separately in the Schools card above.
Census & demographics
- Census place
- Indian River Shores, FL
- County
- Indian River County · 143,738 people
- City population
- 15,008
- Metro
- Sebastian-Vero Beach, FL
- Population (ZIP)
- 15,008
- Household income
- $149,923
- Rent vs Own
- Severe rent burden
- 119.0
Population outlook (Indian River County) Hauer SSP2
- Today (2025)
- 165,104 people
- By 2030
- 172,869 · +4.7%
- By 2040
- 185,640 · +12.4%
- By 2050
- 194,465 · +17.8%
- By 2075
- 211,115 · +27.9%
- By 2100
- 211,781 · +28.3%
Race, ethnicity, and origin ACS 2023
- Neighborhood character
- Predominantly White (92%)
- Race & ethnicity
- White 92% Two or more races 5% Hispanic / Latino 4% Asian 2%
- Common ancestry
- Slovak 5% Lithuanian 4% Italian 3%
- Foreign-born
- 9% · Canada
- Languages at home
- 92% English-only · Spanish 3% Other Indo-European 1% German/W. Germanic 1%
Political lean MEDSL · Indian River
- 2024 margin
- Strong R (+27.4) · D 36.0% · R 63.4%
- 2008→2024 swing
- -12.5pp toward R · 2008: -14.8pp · 2024: -27.4pp
- All cycles
- 2024: R+27.4 2020: R+21.6 2016: R+24.5 2012: R+22.3 2008: R+14.8
Not yet ingested
- Civics
- —
Market trends
- HPI YoY
- ▼ -180.47%
- Current HPI
- 312.0326
- Rent YoY
- ▲ 11.04%
- Metro
- Sebastian-Vero Beach, FL
- State GDP YoY
- ▲ 3.28%
- F500 in state
- 36
Industry mix (Fortune 500 HQ in FL)
| Industry | F500 HQs | Revenue |
|---|---|---|
| Industrial Technology | 2 | $29B |
|
||
| Insurance | 2 | $17B |
|
||
| Retail | 1 | $60B |
|
||
| Technology Distribution | 1 | $58B |
|
||
| Homebuilding | 1 | $35B |
|
||
| Technology Manufacturing | 1 | $35B |
|
||
Price history
+167.7% since first listed36 events — show timeline
- 2026-04-27 Price Changed $249,000 SCMLS
- 2026-04-27 Price Changed $249,000 RAIRCMLS
- 2026-03-09 Price Changed $289,000 Beaches MLS
- 2026-03-09 Price Changed $289,000 SCMLS
- 2026-03-06 Price Changed $289,000 RAIRCMLS
- 2026-01-12 Price Changed $305,000 Beaches MLS
- 2026-01-12 Price Changed $305,000 SCMLS
- 2026-01-11 Price Changed $305,000 RAIRCMLS
- 2025-07-29 Price Changed $335,000 Beaches MLS
- 2025-07-29 Price Changed $335,000 SCMLS
- 2025-07-22 Listing Removed — SCMLS
- 2025-07-02 Price Changed $350,000 Beaches MLS
- 2025-07-02 Price Changed $350,000 SCMLS
- 2025-06-02 Price Changed $350,000 RAIRCMLS
- 2025-03-26 Price Changed $375,000 Beaches MLS
- 2025-03-26 Price Changed $375,000 SCMLS
- 2025-03-22 Price Changed $375,000 RAIRCMLS
- 2025-01-03 Listed $399,000 SCMLS
- 2025-01-02 Listed $399,000 RAIRCMLS
- 2024-12-22 Listed $335,000 RAIRCMLS
- 2024-12-21 Coming Soon — RAIRCMLS
- 2024-12-20 Listing Removed — SCMLS
- 2024-10-24 Price Changed $419,900 SCMLS
- 2024-10-24 Price Changed $419,900 RAIRCMLS
- 2024-06-21 Listed $439,900 SCMLS
- 2024-06-20 Listed $439,900 RAIRCMLS
- 2024-06-18 Coming Soon — RAIRCMLS
- 2016-09-15 Listing Removed — SCMLS
- 2016-04-25 Listed $275,000 RAIRCMLS
- 2013-09-21 Listing Removed — Beaches MLS
- 2010-10-26 Listing Removed — MARMLS
- 2009-10-26 Listed $259,000 MARMLS
- 2007-06-01 Listed $265,000 Beaches MLS
- 2007-05-15 Listed $265,000 SCMLS
- 2002-04-25 Sold (Public Records) $148,000 Public Records
- 1994-03-01 Sold (Public Records) $93,000 Public Records
Property tax history
+5.3%/yrLatest (2025): $4,075 · +4.2% YoY. Source: county tax records.
Cash-flow waterfall
monthlySold comps — $/sqft
last 12 mo · ≤1 miLoading sold comps…