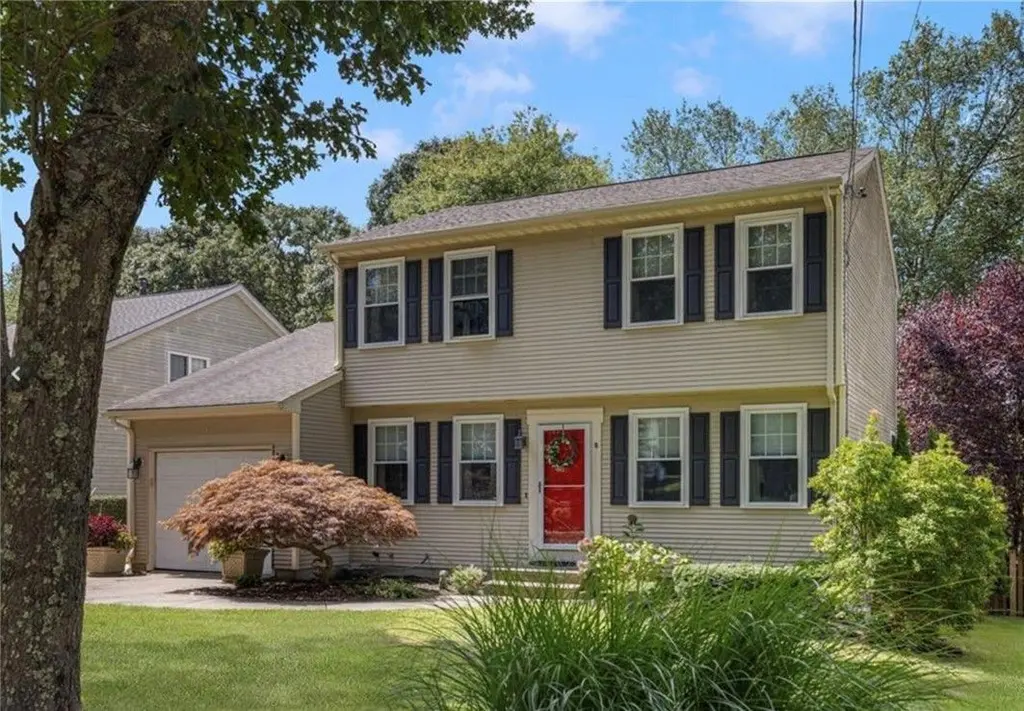
431 Sampan Ave · Jamestown, RI
Flood risk No data
- FEMA flood zone
- —
- Chance of flooding over 30 yrs
- —
- Est. flood insurance / yr
- —
Fire risk No data
- Est. fire insurance / yr
- —
Heat risk No data
- Hot days now (above threshold)
- —
- Hot days in 30 yrs
- —
Wind risk No data
- Chance of severe wind over 30 yrs
- —
Air-quality risk No data
- Unhealthy air days now
- —
- Unhealthy air days in 30 yrs
- —
Risk factors via First Street. Map © Google.
Why this score? — see what drove the C+ grade
The composite is a weighted blend of 9 inputs, each scored 0–100. Each bar is that input's sub-score; the figure is the points it added to the 100-point composite (weight × sub-score).
- Cash flow +30.0/30.0
- 1% rule +10.0/10.0
- DSCR +10.0/10.0
- Schools +5.4/10.0
- Rent growth +2.5/5.0
- Livability +2.5/5.0
- Condition / age +2.5/5.0
- ARV discount +0.3/15.0
- Appreciation +0.0/10.0
$899,000
🖨 Deal sheet 📄 Offer letter ✓ Due diligence
Listing remarks
Welcome home to this beautifully maintained, 3-bedroom, 2-bathroom Colonial nestled in the highly sought-after Jamestown Shores neighborhood. Offering 1,540 square feet of inviting living space. The kitchen, remodeled in 2025 has new appliances, soft close cabinets and quartz countertops. The dining room, living room, and den area flow effortlessly into one another, creating a spacious and connected environment for hosting friends or enjoying family time. On the first floor there are oak hardwood floors which are throughout the main living areas, adding warmth and elegance. Step through the den through the sliding glass doors outside to discover your own private retreat. The covered rear de
Key facts
- 7,405 sq ft lot
- Garage
- Built 1998
Property features AI
Exterior
- Parking: Garage
- Home design: Single-family home; 2 total floors
Interior
- Kitchen: Dishwasher; Microwave
- Bedrooms: 3 bedrooms
- Bathrooms: 2 bathrooms
- Interior features: 7 total rooms
Neighborhood map
What this means for you Summary
Snapshot
- This is a 3-bed/2.0-bath single-family listed at $899k.
Deal economics
- At list price, monthly cash flow is $7k ($79k/yr) — positive.
- The deal already cash-flows at list — no discount required.
- Meets the 1% rule at list price ($16k rent vs $899k).
Location & tenants
- Location reads: area grade C — affects rentability + tenant quality, not the cash-flow math above.
- Jamestown (suburban): math 51% / reading 68% proficiency, ranked #2 of 39 in RI (top 5%) — acceptable for families but not a draw, mixed tenant base, ~2y average lease; only 8% free/reduced lunch — higher-income household profile.
- Market conditions: 62 active listings in the ZIP; 2 comparable units currently listed for rent nearby; 94 units permitted in Newport County in 2024 (0 in 5+ unit buildings).
Forward outlook
- Local home prices are declining (-3.0%/yr); year-one equity from $6k of loan paydown is wiped out by about $27k of value loss. Plan a longer hold.
- Newport County population projected at -12% by 2050 — secular population decline; favor cash flow + early exit over multi-decade hold.
- At projected returns (-3.0% appreciation + 3.0% rent growth), your $252k cash investment doubles in ~4 years — after that, you're playing with house money.
Negotiation context
- Only 10 days on market — expect competitive offers; lowballing is unlikely to land.
Questions for the listing agent
- Is there a deadline driving the sale (1031 exchange, divorce, estate, relocation)? That informs how much negotiation room exists.
- What's the average days-on-market for RENTAL listings here right now (not sales)? A rising rental-DOM trend means longer vacancies and softer asking-rent achievability than the comps imply.
- What's the recent tenant-quality profile in this submarket — average credit score on applications, eviction rate, late-payment / NSF rate, and stable-employment percentage? A property-management company in the area should have these aggregated.
- How much new for-sale + rental construction is in the pipeline within 1–3 miles? Heavy new supply typically softens prices + rents 12–24 months out; constrained supply supports both.
Investment metrics
- 1% rule
- 1.80% ✓
- Cap rate
- 15.10%
- Cash-on-cash
- 31.47%
- DSCR
- 2.40
- GRM
- 4.6
CMA / ARV
- ARV (on-the-fly)
- $774,620
- Comps found
- 5
Show comp detail 5 sales within ~0.75 mi
| Address | Dist | Beds/Ba | Sqft | Sold | Price | $/sf | Match |
|---|---|---|---|---|---|---|---|
| 431 Sampan Ave | 0.00mi | 3/2.0 | 1,540 (0%) | 19mo | $725,700 | $471 | 84 |
| 460 Schooner Ave | 0.06mi | 2/2.0 (-1) | 1,544 (+0%) | 10mo | $776,700 | $503 | 84 |
| 66 Sloop St | 0.10mi | 2/2.0 (-1) | 1,518 (-1%) | 20mo | $870,000 | $573 | 71 |
| 470 Gondola Ave | 0.10mi | 2/2.5 (-1) | 1,654 (+7%) | 8mo | $800,000 | $484 | 69 |
| 85 Frigate St | 0.61mi | 2/2.5 (-1) | 1,512 (-2%) | 11mo | $1,000,000 | $661 | 52 |
Match score weights: distance 35% · size 25% · config 20% · recency 20%. Top-matched comps best support the ARV.
Projected returns pro-forma
-3.0% appreciation · 3.0% rent growth · sell at horizon
- IRR
- 26.4%
- Equity multiple
- 2.09×
- Total profit
- $274,997
- Equity at exit
- $134,044
- IRR
- 34.0%
- Equity multiple
- 4.11×
- Total profit
- $781,826
- Equity at exit
- $77,729
Cash invested: $251,720 (down + closing). Projections, not guarantees.
Landlord ↔ Tenant lean methodology
- Overall (STATE)
- 31 Tenant-Leaning
- State Rhode Island
- 31 Tenant-Leaning · D+8
- County
- — inherits STATE
- City
- — inherits STATE
ZIP-level market 02835
- Active inventory
- 62
- Price-to-rent
- 4.6×
Monthly cashflow live
- Estimated rent
- $16,220 medium interval (Pro) →
- Mortgage (P&I)
- −$4,714
- Tax est. 1.5%
- −$1,124 /mo · $13,485/yr
- Insurance
- −$375
- HOA
- −$0
- Vacancy / Maint / Mgmt
- −$3,406
- Net cashflow
- $6,601
Break-even live
UW: 25.0% down · 7.5% · 30yr · 1.5% tax · 5.0% vac · 8.0% maint · 8.0% mgmt
Financing live
Cash to close
- Down payment
- $224,750
- Closing costs
- $26,970
- Reserves months
- —
- Total cash needed
- —
Loan-product check · same deal, 3 products live
Conventional
25% down · 7.5% · 30yr
- Down + closing
- —
- Monthly P&I
- —
- Monthly cashflow
- —
- DSCR
- —
- Eligible?
- —
Personal DTI + credit; lowest rate.
DSCR
20% down · 8.5% · 30yr
- Down + closing
- —
- Monthly P&I
- —
- Monthly cashflow
- —
- DSCR
- —
- Eligible?
- —
No personal income docs; deal must DSCR.
Hard money
10% down · 12.0% · 12mo
- Down + closing
- —
- Monthly P&I
- —
- Monthly cashflow
- —
- DSCR
- —
- Eligible?
- —
Short-term bridge; refi at stabilization.
Rent comps 2 comps
| Address | Beds | Baths | Sqft | Rent | $/sqft | DOM | Units | Dist |
|---|---|---|---|---|---|---|---|---|
| 67 Buoy St Jamestown, RI | 2.0 | 2.0 | 1440 | $2,650 | $1.84 | 24d | 1 | 0.85mi |
| 376 E Shore Rd Jamestown, RI | 4.0 | 2.5 | 2160 | $40,000 | $18.52 | 21d | 1 | 1.13mi |
Listing history 9 events
-
2026-06-18days on market $899,000 Active 10 DOM
-
2026-06-17days on market $899,000 Active 9 DOM
-
2026-06-16days on market $899,000 Active 8 DOM
-
2026-06-15days on market $899,000 Active 7 DOM
-
2026-06-13days on market $899,000 Active 5 DOM
-
2026-06-09statusdays on market $899,000 Active 1 DOM
-
2026-06-08days on market $899,000 Coming Soon 4 DOM
-
2026-06-07remarks 699-char remark
-
2026-06-07$899,000 Coming Soon 3 DOM
ⓘ Source: listings_history table (triggers on properties + properties_extension) + one-shot
backfill from property_details.listing_events for pre-trigger history.
Nearby sold comps map
Loading sold comps map…
Walkable amenities ~0.75 mi
Loading nearby amenities…
Taxation est. · year 1
- Rental income
- $194,642
- − Mortgage interest
- −$50,358
- − Property taxes
- −$13,485
- − Insurance
- −$4,495
- − Repairs & maintenance
- −$15,571
- − Management
- −$15,571
- − Depreciation
- −$26,153
- Taxable income
- $69,008
- Est. tax owed @ 24.0%
- −$16,562
- After-tax cash flow
- $62,651/yr
For passive investors: Depreciation is non-cash, so a rental often shows a tax loss while cash-flowing — sheltering income. Rental losses are passive: they offset passive income freely, and up to $25,000/yr can offset ordinary (W-2) income if you actively participate and your MAGI is under $100k (phasing out to $0 by $150k); unused losses carry forward. On sale, claimed depreciation is recaptured at up to 25%, and gains may owe capital-gains tax (a 1031 exchange can defer both). Figures are a year-1 estimate at your 24.0% rate — not tax advice; consult a CPA.
Schools (NCES district)
- District
- Jamestown
- NCES district ID
- 4400510
- Math proficiency
- 51% ▼ -8.00%
- Reading proficiency
- 68% ▲ 5.00%
- Median HH income
- $88,929
- Composite
- 54.32/100
- National rank
- #1368
- State rank
- #2 of 39 in RI
Livability — Jamestown
No livability data for this city. (Only ~50 U.S. cities are tracked.)
Census & demographics
- Population (ZIP)
- 5,545
Population outlook (Newport County) Hauer SSP2
- Today (2025)
- 81,198 people
- By 2030
- 79,518 · -2.1%
- By 2040
- 75,581 · -6.9%
- By 2050
- 71,801 · -11.6%
- By 2075
- 64,618 · -20.4%
- By 2100
- 56,724 · -30.1%
Race, ethnicity, and origin ACS 2023
- Neighborhood character
- Predominantly White (93%)
- Race & ethnicity
- White 93% Two or more races 5%
- Common ancestry
- Russian 4% Romanian 3% Lithuanian 3%
- Foreign-born
- 2%
- Languages at home
- 96% English-only · German/W. Germanic 1% Spanish 1% Other Indo-European 1%
Political lean MEDSL · Newport
- 2024 margin
- Strong D (+25.5) · D 61.6% · R 36.1% · Other 2.2%
- 2008→2024 swing
- +2.2pp toward D · 2008: 23.3pp · 2024: 25.5pp
- All cycles
- 2024: D+25.5 2020: D+29.8 2016: D+19.4 2012: D+17.7 2008: D+23.3
Not yet ingested
- Civics
- —
Market trends
- HPI YoY
- ▼ -265.83%
- Current HPI
- 388.7836
- Rent YoY
- —
- Metro
- —
- State GDP YoY
- ▲ 2.25%
- F500 in state
- 10
Industry mix (Fortune 500 HQ in RI)
| Industry | F500 HQs | Revenue |
|---|---|---|
| Healthcare | 1 | $373B |
|
||
| Food Distribution | 1 | $31B |
|
||
| Aerospace / Defense | 1 | $14B |
|
||
| Financial Services | 1 | $8B |
|
||
| Consumer Goods | 1 | $4B |
|
||
Cash-flow waterfall
monthlySold comps — $/sqft
last 12 mo · ≤1 miLoading sold comps…