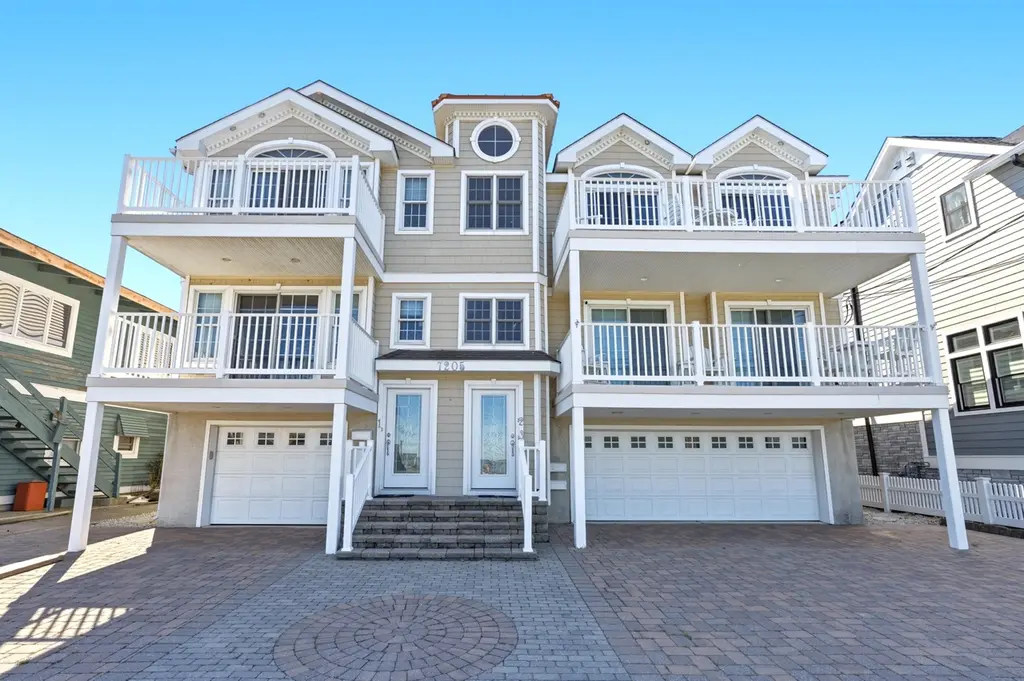
7205 New Jersey Ave #3 · Wildwood Crest, NJ
Flood risk 10/10 · Severe
- FEMA flood zone
- AE
- Chance of flooding over 30 yrs
- 0.99%
- Est. flood insurance / yr
- $1,737 – $8,500
Fire risk 1/10 · Minimal
- Est. fire insurance / yr
- $526 – $976
Heat risk 8/10 · Major
- Hot days now (above 95°F)
- 7 days/yr
- Hot days in 30 yrs
- 18 days/yr
Wind risk 8/10 · Major
- Chance of severe wind over 30 yrs
- 80.0%
Air-quality risk 2/10 · Minimal
- Unhealthy air days now
- 1 days/yr
- Unhealthy air days in 30 yrs
- 1 days/yr
Risk factors via First Street. Map © Google.
Why this score? — see what drove the C grade
The composite is a weighted blend of 9 inputs, each scored 0–100. Each bar is that input's sub-score; the figure is the points it added to the 100-point composite (weight × sub-score).
- Cash flow +21.9/30.0
- ARV discount +7.5/15.0
- DSCR +7.0/10.0
- Appreciation +5.0/10.0
- 1% rule +4.8/10.0
- Schools +3.7/10.0
- Livability +3.5/5.0
- Rent growth +2.5/5.0
- Condition / age +2.5/5.0
$1,225,000
🖨 Deal sheet 📄 Offer letter ✓ Due diligence
Listing remarks
Bayfront luxury at its finest! Whether you're seeking a private retreat, vacation getaway, investment opportunity, or simply a place to live the lifestyle you deserve, this stunning residence delivers it all. Nothing was overlooked in this exceptional unit featuring: - 3 spacious bedrooms with king-size bedding - 2 full baths - Utility room with washer and dryer - State-of-the-art kitchen with countertop seating for casual dining plus a separate dining area - Open-concept kitchen, dining area, and living room designed for entertaining - Living room with fireplace - Sliders leading to a private deck with views second to none - Storage area and (3) garage - Enclosed outside shower This
Key facts
- Garage
- Built 2002
- Listed 32 days
Property features AI
Finance
- Other: Located four blocks from the beach
- HOA & community: Condo fee of $3,500
Exterior
- Parking: Attached garage for 3 cars with concrete driveway
- Utilities: Public water; Public sewer; Gas hot water
- Home design: Condo / multi-unit property; Top floor unit (unit 3)
- Construction: Construction details not provided
- Exterior features: Deck/porch; Outside shower; Year-round usage; Owners allowed pets; Top-floor unit
Interior
- Kitchen: Oven; Microwave; Refrigerator; Dishwasher; Disposal; Kitchen center island
- Bedrooms: 3 bedrooms (one master on the 1st floor)
- Bathrooms: 2 full bathrooms
- Heating & cooling: Natural gas and electric heating with forced air; Central air conditioning
- Interior features: Furniture included; Living room; Dining room; Kitchen; Laundry/utility room; Storage space; 1st-floor master bedroom; Fireplace; Kitchen center island
- Laundry & utility: Washer; Dryer; Laundry/utility room
Neighborhood map
What this means for you Summary
Snapshot
- This is a 3-bed/2.0-bath condo listed at $1.23M.
Deal economics
- At list price, monthly cash flow is $2k ($18k/yr) — positive.
- The deal already cash-flows at list — no discount required.
- To meet the 1% rule (rent ≥ 1% of price), the offer needs to be $1.20M (2.0% below list).
- Recommended offer: $1.19M (3.0% below list) — sets the bar for market timing.
- Cap rate 8.2% vs local median 2.7% in Wildwood Crest — top-decile yield for the area; either an underpriced asset or a hidden risk that comps aren't pricing in. Stress-test before assuming the spread holds.
Location & tenants
- Location reads 70/100 on livability (#257 in NJ) — a middle-class / working-renter tenant base. Strengths: health & safety A+; Watch: amenities C-, commute F, cost of living F.
- Wildwood Crest Borough School District (suburban): math 35% / reading 45% proficiency, ranked #493 of 612 in NJ (top 81%) — families likely to look elsewhere, expect single-tenant / working-renter base with shorter leases.
- Market conditions: 1 active listings in the ZIP; 1 comparable units currently listed for rent nearby; 877 units permitted in Cape May County in 2024 (35 in 5+ unit buildings).
Forward outlook
- In year one you build about $45k of equity ($8k loan paydown + $37k appreciation (3.0% local appreciation)).
- Cape May County population projected at -24% by 2050 — secular population decline; favor cash flow + early exit over multi-decade hold.
- At projected returns (3.0% appreciation + 3.0% rent growth), your $343k cash investment doubles in ~5 years — after that, you're playing with house money.
- By year 2, paydown + projected appreciation supports a ~$74k cash-out refi (75% LTV) — recoverable capital for the next deal without selling this one.
Negotiation context
- It's been on market 32 days — a 3% lower offer ($1.19M) is reasonable based on typical stale-listing flexibility.
- 2 sale attempts with the ask held roughly flat each time — persistent listings suggest the price (not the market) is what's stuck; bring a comps-based counter.
- Current owner paid $638k; list at $1.23M implies a 92% gain — meaningful room to come down on a strong offer.
Risks & watch-outs
- Watch-outs: flood insurance adds $427/mo.
- Climate carrying-cost: in FEMA flood zone AE (mandatory federal flood insurance); severe wind risk, 80% chance of damaging wind over 30y; extreme-heat days projected 7→18/yr by 2055 (HVAC capex compounding) — expect insurance premiums to compound above CPI over the hold.
Questions for the listing agent
- It's been on market 32 days. Have you received any prior offers? Is the seller open to a 3% concession, seller financing, or rate buy-down credit?
- What's the actual annual flood-insurance premium (NFIP or private), and is the property in a SFHA with mandatory coverage?
- Any open or pending special assessments — roof, HVAC, plumbing, elevator, façade? What's the per-unit balance and payoff schedule, and is the seller paying it off at close or rolling it to the buyer?
- Is there a deadline driving the sale (1031 exchange, divorce, estate, relocation)? That informs how much negotiation room exists.
- What's the average days-on-market for RENTAL listings here right now (not sales)? A rising rental-DOM trend means longer vacancies and softer asking-rent achievability than the comps imply.
- What's the recent tenant-quality profile in this submarket — average credit score on applications, eviction rate, late-payment / NSF rate, and stable-employment percentage? A property-management company in the area should have these aggregated.
- How much new apartment / multifamily construction is in the pipeline within 1–3 miles? Heavy new supply (>2% of stock underway) typically softens rents 12–24 months out; light construction supports rent growth.
Investment metrics
- 1% rule
- 0.98% ✗
- Cap rate
- 8.19%
- Cash-on-cash
- 6.77%
- DSCR
- 1.30
- GRM
- 8.5
CMA / ARV
No comps found within radius.
Projected returns pro-forma
3.0% appreciation · 3.0% rent growth · sell at horizon
- IRR
- 12.4%
- Equity multiple
- 1.71×
- Total profit
- $243,554
- Equity at exit
- $550,813
- IRR
- 14.4%
- Equity multiple
- 3.14×
- Total profit
- $732,360
- Equity at exit
- $848,869
Cash invested: $343,000 (down + closing). Projections, not guarantees.
Landlord ↔ Tenant lean methodology
- Overall (STATE)
- 21 Tenant-Leaning
- State New Jersey
- 21 Tenant-Leaning · D+6
- County
- — inherits STATE
- City
- — inherits STATE
ZIP-level market 08260-3843
- Active inventory
- 1
- Price-to-rent
- 8.5×
Monthly cashflow live
- Estimated rent
- $12,000 medium interval (Pro) →
- Mortgage (P&I)
- −$6,424
- Tax from tax record
- −$610 /mo · $7,320/yr
- Insurance
- −$510
- Flood insurance flood zone
- −$427 /mo · $5,118/yr
- HOA
- −$0
- Vacancy / Maint / Mgmt
- −$2,520
- Net cashflow
- $1,509
Break-even live
UW: 25.0% down · 7.5% · 30yr · 1.5% tax · 5.0% vac · 8.0% maint · 8.0% mgmt
Financing live
Cash to close
- Down payment
- $306,250
- Closing costs
- $36,750
- Reserves months
- —
- Total cash needed
- —
Loan-product check · same deal, 3 products live
Conventional
25% down · 7.5% · 30yr
- Down + closing
- —
- Monthly P&I
- —
- Monthly cashflow
- —
- DSCR
- —
- Eligible?
- —
Personal DTI + credit; lowest rate.
DSCR
20% down · 8.5% · 30yr
- Down + closing
- —
- Monthly P&I
- —
- Monthly cashflow
- —
- DSCR
- —
- Eligible?
- —
No personal income docs; deal must DSCR.
Hard money
10% down · 12.0% · 12mo
- Down + closing
- —
- Monthly P&I
- —
- Monthly cashflow
- —
- DSCR
- —
- Eligible?
- —
Short-term bridge; refi at stabilization.
Rent comps 1 comps
| Address | Beds | Baths | Sqft | Rent | $/sqft | DOM | Units | Dist |
|---|---|---|---|---|---|---|---|---|
| 611 W Burk Ave Unit A Wildwood, NJ | 2.0 | 1.5 | 1248 | $12,000 | $9.62 | 43d | 1 | 1.41mi |
HOA detail condo
- Monthly dues
- $0 · $0/yr
- Assessments
- None detected in remarks — confirm with the listing agent.
Listing history 17 events
-
2026-06-18days on market $1,225,000 Active 32 DOM
-
2026-06-17days on market $1,225,000 Active 31 DOM
-
2026-06-16days on market $1,225,000 Active 30 DOM
-
2026-06-15days on market $1,225,000 Active 29 DOM
-
2026-06-13days on market $1,225,000 Active 27 DOM
-
2026-06-12days on market $1,225,000 Active 26 DOM
-
2026-06-09days on market $1,225,000 Active 23 DOM
-
2026-06-08days on market $1,225,000 Active 22 DOM
-
2026-06-07days on market $1,225,000 Active 21 DOM
-
2026-06-07days on market $1,225,000 Active 20 DOM
-
2026-06-04days on market $1,225,000 Active 17 DOM
-
2026-06-02days on market $1,225,000 Active 16 DOM
-
2026-06-01days on market $1,225,000 Active 15 DOM
-
2026-05-31days on market $1,225,000 Active 14 DOM
-
2026-05-17$1,225,000 Active
-
2026-05-14$1,225,000
-
2007-01-22soldstatus $638,000
ⓘ Source: listings_history table (triggers on properties + properties_extension) + one-shot
backfill from property_details.listing_events for pre-trigger history.
Tax reassessment forecast NJ · Partial reset (capped growth)
- Current annual tax
- $7,320 · $610/mo
- Projected year-2 tax
- $18,911 · $1,576/mo
- Expected delta
- +$11,591/yr (+$966/mo · 158.3%)
ⓘ Screening estimate from a state-policy table — verify with the county assessor before closing.
Climate risk First Street
- Flood 10/10 Extreme FEMA zone AE · 99% chance over 30 yrs
- Wildfire 1/10 Low
- Heat 8/10 Severe 7 d/yr ≥95°F today · 18 d/yr by 30 yrs out
- Wind 8/10 Severe 80% chance of damaging wind over 30 yrs
- Air quality 2/10 Low 1 unhealthy d/yr today · 1 by 30 yrs out
Nearby sold comps map
Loading sold comps map…
Walkable amenities ~0.75 mi
Loading nearby amenities…
Taxation est. · year 1
- Rental income
- $144,000
- − Mortgage interest
- −$68,619
- − Property taxes
- −$7,320
- − Insurance
- −$11,244
- − Repairs & maintenance
- −$11,520
- − Management
- −$11,520
- − Depreciation
- −$35,636
- Taxable loss
- −$1,859
- Est. tax savings @ 24.0%
- +$446
- After-tax cash flow
- $18,554/yr
For passive investors: Depreciation is non-cash, so a rental often shows a tax loss while cash-flowing — sheltering income. Rental losses are passive: they offset passive income freely, and up to $25,000/yr can offset ordinary (W-2) income if you actively participate and your MAGI is under $100k (phasing out to $0 by $150k); unused losses carry forward. On sale, claimed depreciation is recaptured at up to 25%, and gains may owe capital-gains tax (a 1031 exchange can defer both). Figures are a year-1 estimate at your 24.0% rate — not tax advice; consult a CPA.
Schools (NCES district)
- District
- Wildwood Crest Borough School District
- NCES district ID
- 3417970
- Math proficiency
- 35% ▬ 0.00%
- Reading proficiency
- 45% ▼ -5.00%
- Median HH income
- $55,087
- Composite
- 37.39/100
- National rank
- #8922
- State rank
- #493 of 612 in NJ
Livability — Wildwood Crest
- Score
- 70/100
- State rank
- #257
- US rank
- #7359
Category grades
Schools grade is shown separately in the Schools card above.
Census & demographics
- Census place
- Wildwood Crest, NJ
Population outlook (Cape May County) Hauer SSP2
- Today (2025)
- 88,234 people
- By 2030
- 84,144 · -4.6%
- By 2040
- 75,146 · -14.8%
- By 2050
- 67,389 · -23.6%
- By 2075
- 55,732 · -36.8%
- By 2100
- 44,972 · -49.0%
Not yet ingested
- Political lean
- —
- Race & ethnicity
- —
- Common origin
- —
- Civics
- —
Market trends
- HPI YoY
- —
- Current HPI
- —
- Rent YoY
- —
- Metro
- —
- State GDP YoY
- ▲ 2.05%
- F500 in state
- 34
Industry mix (Fortune 500 HQ in NJ)
| Industry | F500 HQs | Revenue |
|---|---|---|
| Consumer Goods | 3 | $31B |
|
||
| Pharmaceuticals | 2 | $153B |
|
||
| Technology | 2 | $21B |
|
||
| Insurance | 2 | $20B |
|
||
| Healthcare | 2 | $19B |
|
||
| Financial Services | 1 | $70B |
|
||
Price history
+92.0% since first listed3 events — show timeline
- 2026-05-17 Listed $1,225,000 CMCMLS
- 2026-05-14 Listed $1,225,000 CMCMLS
- 2007-01-22 Sold (Public Records) $638,000 Public Records
Property tax history
+2.1%/yrLatest (2025): $7,320 · +1.4% YoY. Source: county tax records.
Cash-flow waterfall
monthlySold comps — $/sqft
last 12 mo · ≤1 miLoading sold comps…