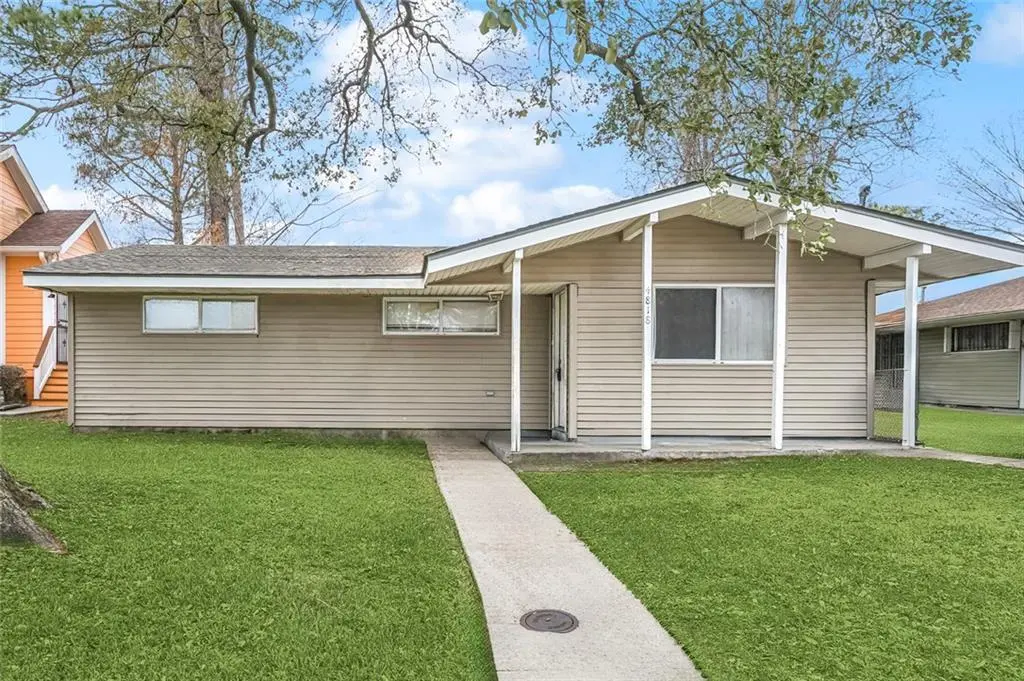
4818 Lancelot Dr · New Orleans, LA
Flood risk 8/10 · Major
- FEMA flood zone
- X (shaded)
- Chance of flooding over 30 yrs
- 0.6%
- Est. flood insurance / yr
- $507 – $1,088
Fire risk 1/10 · Minimal
- Est. fire insurance / yr
- $1,269 – $2,357
Heat risk 10/10 · Severe
- Hot days now (above 107°F)
- 7 days/yr
- Hot days in 30 yrs
- 21 days/yr
Wind risk 10/10 · Severe
- Chance of severe wind over 30 yrs
- 99.0%
Air-quality risk 3/10 · Minor
- Unhealthy air days now
- 3 days/yr
- Unhealthy air days in 30 yrs
- 3 days/yr
Risk factors via First Street. Map © Google.
Why this score? — see what drove the C grade
The composite is a weighted blend of 9 inputs, each scored 0–100. Each bar is that input's sub-score; the figure is the points it added to the 100-point composite (weight × sub-score).
- Cash flow +21.5/30.0
- ARV discount +13.9/15.0
- DSCR +6.9/10.0
- 1% rule +4.9/10.0
- Livability +4.0/5.0
- Rent growth +2.5/5.0
- Condition / age +2.5/5.0
- Schools +1.6/10.0
- Appreciation +0.0/10.0
$151,000
🖨 Deal sheet (PDF) 📄 Offer letter ✓ Due diligence
Listing remarks MLS
Expand your rental portfolio (tenant in place at $1500/month) OR make this charming 4bd/1bth home your own! * THIS HOME QUALIFIES FOR UP TO 100% FINANCING WITH NO PMI, AND UP TO $6000 IN GRANT FUNDS ASSITANCE through preferred lender program for owner-occupants * Large living room opens to formal dining and galley style kitchen complete with solid wood cabinets and ceramic tile countertops. Spacious bedrooms throughout. Updated bathroom with modern vanity and custom tiled tub/shower combo. Large laundry room off of primary bedroom. Fully fenced yard. Ample off-street parking. No flood insurance required - but current policy of $712/yr can be assumed. Currently tenant occupied at $1500/month. Just mins to everything the city has to offer. A MUST SEE! Make it yours today!
Key facts
- Formal dining
- Solid wood cabinets
- Large living room
Tags
Neighborhood map
What this means for you Summary
Snapshot
- This is a 3-bed/1.0-bath single-family listed at $151k.
Deal economics
- At list price, monthly cash flow is $160 ($2k/yr) — positive.
- The deal already cash-flows at list — no discount required.
- To meet the 1% rule (rent ≥ 1% of price), the offer needs to be $149k (1.1% below list).
- Recommended offer: $133k (12.0% below list) — sets the bar for market timing.
- Cap rate 8.1% vs local median 4.4% in New Orleans — top-decile yield for the area; either an underpriced asset or a hidden risk that comps aren't pricing in. Stress-test before assuming the spread holds.
Location & tenants
- Location reads 81/100 on livability (#3 in LA, #1,383 nationally) — a professional / high-income tenant draw. Strengths: amenities A+, commute A+, health & safety A+; Watch: crime C-, employment D.
- Orleans Parish (urban): math 11% / reading 27% proficiency, ranked #69 of 98 in LA (top 70%) — low school quality limits family demand, transient renter base, plan for 1-2y turnover; 68% free/reduced lunch — lower-income household profile, screen leases tightly.
- Zoned schools: Benjamin Franklin Elem. Math And Science (math 12% / reading 23%, grade F, #479 of 646 statewide, top 75%, 747 students, 98% FRL, charter) — zoned schools average 98% FRL vs 68% district-wide (30 pts higher); higher-poverty schools than district average — tighter screening recommended.
- Market conditions: 130 active listings in the ZIP; 26 comparable units currently listed for rent nearby; rentals at typical pace (median 26d on market — plan ~3-4 weeks tenant-placement turnaround); lower-income renter base — watch delinquency; 710 units permitted in Orleans Parish in 2024 (244 in 5+ unit buildings).
- This rent runs 44% of the median local income ($41k/yr) — at the standard rent-burdened threshold; future hikes will face affordability resistance.
Forward outlook
- Local home prices are declining (-3.0%/yr); year-one equity from $1k of loan paydown is wiped out by about $5k of value loss. Plan a longer hold.
- Orleans County population projected at +61% by 2050 — long-run rental-demand tailwind backs the buy-and-hold thesis.
Negotiation context
- It's been on market 121 days — a 12% lower offer ($133k) is reasonable based on typical stale-listing flexibility.
- 4 sale attempts since 33y ago; this cycle's ask has dropped $10k (6%) from the opening price — seller is motivated, your offer sets the floor, not the list.
- Current owner paid $27k; list at $151k implies a 459% gain — meaningful room to come down on a strong offer.
Risks & watch-outs
- Watch-outs: flood insurance adds $66/mo; built in 1957 — expect roof / HVAC / electrical / plumbing capex.
- Climate carrying-cost: severe flood risk; severe wind risk, 99% chance of damaging wind over 30y; extreme-heat days projected 7→21/yr by 2055 (HVAC capex compounding) — expect insurance premiums to compound above CPI over the hold.
Questions for the listing agent
- It's been on market 121 days. Have you received any prior offers? Is the seller open to a 12% concession, seller financing, or rate buy-down credit?
- Built in 1957 — when were the roof, HVAC, electrical panel, plumbing, and water heater last replaced?
- What's the actual annual flood-insurance premium (NFIP or private), and is the property in a SFHA with mandatory coverage?
- Why hasn't it sold? Are there any deal-killer items the seller is aware of (foundation, flood, title, zoning, code violations)?
- Is there a deadline driving the sale (1031 exchange, divorce, estate, relocation)? That informs how much negotiation room exists.
- What's the average days-on-market for RENTAL listings here right now (not sales)? A rising rental-DOM trend means longer vacancies and softer asking-rent achievability than the comps imply.
- What's the recent tenant-quality profile in this submarket — average credit score on applications, eviction rate, late-payment / NSF rate, and stable-employment percentage? A property-management company in the area should have these aggregated.
- How much new for-sale + rental construction is in the pipeline within 1–3 miles? Heavy new supply typically softens prices + rents 12–24 months out; constrained supply supports both.
Investment metrics
- 1% rule
- 0.99% ✗
- Cap rate
- 8.09%
- Cash-on-cash
- 6.43%
- DSCR
- 1.29
- GRM
- 8.4
CMA / ARV
- ARV (median comp)
- $175,973
- List price
- $151,000
- Delta
- -14.19%
- Verdict
- UNDERPRICED
- Comps
- 20 within 1.0 mi
Show comp detail 12 sales within ~0.75 mi
| Address | Dist | Beds/Ba | Sqft | Sold | Price | $/sf | Match |
|---|---|---|---|---|---|---|---|
| 4734 Galahad Dr | 0.13mi | 3/1.0 | 1,332 (+3%) | 5mo | $105,000 | $79 | 84 |
| 4790 Gawain Dr | 0.10mi | 3/2.0 | 1,144 (-11%) | 1mo | $165,000 | $144 | 72 |
| 4736 Crowder Blvd | 0.21mi | 3/2.0 | 1,343 (+4%) | 12mo | $157,000 | $117 | 70 |
| 4718 Lancelot Dr | 0.15mi | 3/2.0 | 1,144 (-11%) | 4mo | $167,000 | $146 | 67 |
| 4650 Cerise Ave | 0.30mi | 3/2.0 | 1,144 (-11%) | 8mo | $178,000 | $156 | 57 |
| 5631 Christian Ln | 0.59mi | 3/2.0 | 1,300 (+1%) | 18mo | $163,000 | $125 | 52 |
| 4726 Knight Dr | 0.19mi | 3/2.0 | 1,468 (+14%) | 14mo | $164,800 | $112 | 52 |
| 4705 Raymond Joseph Dr | 0.70mi | 3/2.0 | 1,245 (-3%) | 12mo | $112,500 | $90 | 48 |
| 4791 Eunice St | 0.62mi | 3/2.0 | 1,327 (+3%) | 19mo | $170,000 | $128 | 46 |
| 4740 Dodt Ave | 0.39mi | 3/2.0 | 1,170 (-9%) | 24mo | $90,000 | $77 | 43 |
| 4675 Dodt Ave | 0.40mi | 3/2.0 | 1,445 (+12%) | 18mo | $42,128 | $29 | 42 |
| 4539 Marque Dr | 0.64mi | 3/2.0 | 1,193 (-7%) | 24mo | $145,000 | $122 | 34 |
Match score weights: distance 35% · size 25% · config 20% · recency 20%. Top-matched comps best support the ARV.
Projected returns pro-forma
-3.0% appreciation · 3.0% rent growth · sell at horizon
- IRR
- -9.2%
- Equity multiple
- 0.66×
- Total profit
- $-14,261
- Equity at exit
- $22,515
- IRR
- 0.3%
- Equity multiple
- 1.02×
- Total profit
- $747
- Equity at exit
- $13,056
Cash invested: $42,280 (down + closing). Projections, not guarantees.
Landlord ↔ Tenant lean methodology
- Overall (STATE)
- 90 Strongly Landlord-Friendly
- State Louisiana
- 90 Strongly Landlord-Friendly · R+12
- County
- — inherits STATE
- City
- — inherits STATE
ZIP-level market 70127
- Home prices YoY
- -29.2%
- Active inventory
- 130
- Price-to-rent
- 8.4×
Monthly cashflow live
- Estimated rent
- $1,493 high interval (Pro) →
- Mortgage (P&I)
- −$792
- Tax from tax record
- −$98 /mo · $1,176/yr
- Insurance
- −$63
- Flood insurance flood zone
- −$66 /mo · $798/yr
- HOA
- −$0
- Vacancy / Maint / Mgmt
- −$314
- Net cashflow
- $160
Break-even live
Sensitivity live
| Price | -10% $246 | -5% $203 | +0% $160 | +5% $117 | +10% $75 |
|---|---|---|---|---|---|
| Rent | -10% $42 | -5% $101 | +0% $160 | +5% $219 | +10% $278 |
| Rate | -1.0pp $236 | -0.5pp $199 | base $160 | +0.5pp $121 | +1.0pp $81 |
UW: 25.0% down · 7.5% · 30yr · 1.5% tax · 5.0% vac · 8.0% maint · 8.0% mgmt
Financing live
Cash to close
- Down payment
- $37,750
- Closing costs
- $4,530
- Reserves months
- —
- Total cash needed
- —
Loan-product check · same deal, 3 products live
Conventional
25% down · 7.5% · 30yr
- Down + closing
- —
- Monthly P&I
- —
- Monthly cashflow
- —
- DSCR
- —
- Eligible?
- —
Personal DTI + credit; lowest rate.
DSCR
20% down · 8.5% · 30yr
- Down + closing
- —
- Monthly P&I
- —
- Monthly cashflow
- —
- DSCR
- —
- Eligible?
- —
No personal income docs; deal must DSCR.
Hard money
10% down · 12.0% · 12mo
- Down + closing
- —
- Monthly P&I
- —
- Monthly cashflow
- —
- DSCR
- —
- Eligible?
- —
Short-term bridge; refi at stabilization.
Rent comps 26 comps
| Address | Beds | Baths | Sqft | Rent | $/sqft | DOM | Units | Dist |
|---|---|---|---|---|---|---|---|---|
| 4923 Eastview Dr New Orleans, LA | 3.0 | 2.0 | 912 | $1,400 | $1.54 | 25d | 1 | 0.41mi |
| 4828 Eastview Dr New Orleans, LA | 4.0 | 2.0 | 1260 | $1,675 | $1.33 | 25d | 1 | 0.43mi |
| 4901 Bonita Dr New Orleans, LA | 2.0 | 1.0 | 900 | $1,100 | $1.22 | 25d | 1 | 0.52mi |
| 5131 Bundy Rd New Orleans, LA | 1.0–3.0 | 1.0–2.0 | 1000 | $1,314 | $1.31 | 4d | 21 | 0.57mi |
| 4808 Viola St New Orleans, LA | 3.0 | 2.0 | 1130 | $1,500 | $1.33 | 25d | 1 | 0.64mi |
| 4880 Viola St New Orleans, LA | 3.0 | 2.0 | 1150 | $1,595 | $1.39 | 25d | 1 | 0.65mi |
| 6910 Bunker Hill Rd New Orleans, LA | 3.0 | 2.5 | 1785 | $1,400 | $0.78 | 21d | 1 | 0.76mi |
| 9020 Bunker Hill Rd New Orleans, LA | 3.0 | 1.5 | 1400 | $1,400 | $1.00 | 25d | 1 | 0.78mi |
| 9022 Bunker Hill Rd New Orleans, LA | 3.0 | 1.5 | 1400 | $1,400 | $1.00 | 25d | 1 | 0.79mi |
| 9040 Bunker Hill Rd New Orleans, LA | 3.0 | 1.5 | 1400 | $1,450 | $1.04 | 18d | 1 | 0.79mi |
| 9042 Bunker Hill Rd New Orleans, LA | 3.0 | 1.5 | 1400 | $1,450 | $1.04 | 18d | 1 | 0.79mi |
| 7019 Crowder Blvd Unit 126 New Orleans, LA | 2.0 | 1.5 | 952 | $982 | $1.03 | 25d | 1 | 0.81mi |
| 7019 Huntington Park Dr Unit 21 New Orleans, LA | 2.0 | 1.5 | 952 | $982 | $1.03 | 25d | 1 | 0.88mi |
| 7019 Huntington Park Dr New Orleans, LA | 2.0 | 1.5 | 952 | $986 | $1.04 | 25d | 1 | 0.88mi |
| 7063 Boston Dr New Orleans, LA | 4.0 | 2.5 | 1750 | $1,900 | $1.09 | 18d | 1 | 0.93mi |
| 4745 Tulip St New Orleans, LA | 3.0 | 1.0 | 1125 | $1,750 | $1.56 | 22d | 1 | 1.01mi |
| 4941 Pecan St Unit 1 New Orleans, LA | 2.0 | 1.0 | 1000 | $1,200 | $1.20 | 25d | 1 | 1.03mi |
| 7201 Salem Dr New Orleans, LA | 3.0 | 2.5 | 1764 | $1,650 | $0.94 | 25d | 1 | 1.06mi |
| 7230 Yorktown Dr New Orleans, LA | 3.0 | 2.0 | 1550 | $1,600 | $1.03 | 18d | 1 | 1.06mi |
| 7230 Yorktown Dr New Orleans, LA | 3.0 | 2.0 | 1550 | $1,600 | $1.03 | 25d | 1 | 1.06mi |
| 7502 Chef Menteur Hwy New Orleans, LA | 3.0 | 1.0 | 1000 | $1,500 | $1.50 | 25d | 1 | 1.06mi |
| 8802 Morrison Rd New Orleans, LA | 2.0 | 1.0 | 1071 | $1,275 | $1.19 | 25d | 1 | 1.12mi |
| 9002 Morrison Rd New Orleans, LA | 2.0 | 1.5 | 1050 | $1,150 | $1.10 | 22d | 1 | 1.15mi |
| 4452 Plum Orchard Ave New Orleans, LA | 2.0 | 1.0 | 1100 | $1,250 | $1.14 | 5d | 1 | 1.17mi |
| 5000 Cardenas Dr New Orleans, LA | 3.0 | 2.0 | 1800 | $1,920 | $1.07 | 25d | 1 | 1.23mi |
| 7225 Chef Menteur Hwy New Orleans, LA | 1.0–2.0 | 1.0–2.0 | 739 | $994 | $1.35 | 4d | 10 | 1.25mi |
Listing history 22 events
-
2026-06-21days on market $151,000 Active 121 DOM
-
2026-06-18days on market $151,000 Active 118 DOM
-
2026-06-17pricedays on market $151,000 Active 117 DOM
-
2026-06-16days on market $161,000 Active 116 DOM
-
2026-06-15days on market $161,000 Active 115 DOM
-
2026-06-13days on market $161,000 Active 113 DOM
-
2026-06-10days on market $161,000 Active 110 DOM
-
2026-06-09days on market $161,000 Active 109 DOM
-
2026-06-08days on market $161,000 Active 108 DOM
-
2026-06-07days on market $161,000 Active 107 DOM
-
2026-06-05days on market $161,000 Active 104 DOM
-
2026-06-03days on market $161,000 Active 103 DOM
-
2026-06-02days on market $161,000 Active 102 DOM
-
2026-06-01days on market $161,000 Active 101 DOM
-
2026-05-31days on market $161,000 Active 100 DOM
-
2026-02-20$161,000 Active 782-char remark
Show marketing remark (778 chars)
Expand your rental portfolio (tenant in place at $1500/month) OR make this charming 4bd/1bth home your own! *THIS HOME QUALIFIES FOR UP TO 100% FINANCING WITH NO PMI, AND UP TO $6000 IN GRANT FUNDS ASSITANCE through preferred lender program for owner-occupants* Large living room opens to formal dining and galley style kitchen complete with solid wood cabinets and ceramic tile countertops. Spacious bedrooms throughout. Updated bathroom with modern vanity and custom tiled tub/shower combo. Large laundry room off of primary bedroom. Fully fenced yard. Ample off-street parking. No flood insurance required - but current policy of $712/yr can be assumed. Currently tenant occupied at $1500/month. Just mins to everything the city has to offer. A MUST SEE! Make it yours today!
-
2026-02-20$161,000 Active 778-char remark
Show marketing remark (778 chars)
Expand your rental portfolio (tenant in place at $1500/month) OR make this charming 4bd/1bth home your own! *THIS HOME QUALIFIES FOR UP TO 100% FINANCING WITH NO PMI, AND UP TO $6000 IN GRANT FUNDS ASSITANCE through preferred lender program for owner-occupants* Large living room opens to formal dining and galley style kitchen complete with solid wood cabinets and ceramic tile countertops. Spacious bedrooms throughout. Updated bathroom with modern vanity and custom tiled tub/shower combo. Large laundry room off of primary bedroom. Fully fenced yard. Ample off-street parking. No flood insurance required - but current policy of $712/yr can be assumed. Currently tenant occupied at $1500/month. Just mins to everything the city has to offer. A MUST SEE! Make it yours today!
-
2009-03-02soldstatus $27,000
-
1994-05-27soldstatus $23,000
-
1994-05-27soldstatus $23,000
-
1993-10-27$39,000
-
1993-10-27$39,000
ⓘ Source: listings_history table (triggers on properties + properties_extension) + one-shot
backfill from property_details.listing_events for pre-trigger history.
Tax reassessment forecast LA · Resets to sale price
- Current annual tax
- $1,176 · $98/mo
- Projected year-2 tax
- $1,176 · $98/mo
- Expected delta
- $0/yr ($0/mo · 0.0%)
ⓘ Screening estimate from a state-policy table — verify with the county assessor before closing.
Climate risk First Street
- Flood 8/10 Severe FEMA zone X (shaded) · 60% chance over 30 yrs
- Wildfire 1/10 Low
- Heat 10/10 Extreme 7 d/yr ≥107°F today · 21 d/yr by 30 yrs out
- Wind 10/10 Extreme 99% chance of damaging wind over 30 yrs
- Air quality 3/10 Moderate 3 unhealthy d/yr today · 3 by 30 yrs out
Nearby sold comps map
Loading sold comps map…
Walkable amenities ~0.75 mi
Loading nearby amenities…
Taxation est. · year 1
- Rental income
- $17,915
- − Mortgage interest
- −$8,458
- − Property taxes
- −$1,176
- − Insurance
- −$1,552
- − Repairs & maintenance
- −$1,433
- − Management
- −$1,433
- − Depreciation
- −$4,393
- Taxable loss
- −$531
- Est. tax savings @ 24.0%
- +$127
- After-tax cash flow
- $2,049/yr
For passive investors: Depreciation is non-cash, so a rental often shows a tax loss while cash-flowing — sheltering income. Rental losses are passive: they offset passive income freely, and up to $25,000/yr can offset ordinary (W-2) income if you actively participate and your MAGI is under $100k (phasing out to $0 by $150k); unused losses carry forward. On sale, claimed depreciation is recaptured at up to 25%, and gains may owe capital-gains tax (a 1031 exchange can defer both). Figures are a year-1 estimate at your 24.0% rate — not tax advice; consult a CPA.
Schools (NCES district)
- District
- Orleans Parish
- NCES district ID
- 2201170
- Math proficiency
- 11% ▼ -52.00%
- Reading proficiency
- 27% ▼ -46.00%
- Median HH income
- $37,011
- Composite
- 15.78/100
- National rank
- #9271
- State rank
- #69 of 98 in LA
Livability — New Orleans
- Score
- 81/100
- State rank
- #3
- US rank
- #1383
Category grades
Schools grade is shown separately in the Schools card above.
Census & demographics
- Census place
- New Orleans, LA
- County
- Orleans Parish · 338,817 people
- City population
- 338,817
- Metro
- New Orleans-Metairie, LA
- Population (ZIP)
- 23,107
- Household income
- $40,765
- Rent vs Own
- Severe rent burden
- 2030.0
Population outlook (Orleans County) Hauer SSP2
- Today (2025)
- 513,025 people
- By 2030
- 575,781 · +12.2%
- By 2040
- 700,174 · +36.5%
- By 2050
- 826,541 · +61.1%
- By 2075
- 1,123,374 · +119.0%
- By 2100
- 1,355,609 · +164.2%
Race, ethnicity, and origin ACS 2023
- Neighborhood character
- Predominantly Black (91%)
- Race & ethnicity
- Black 91% Hispanic / Latino 4% Two or more races 4% White 2%
- Common ancestry
- Lithuanian 1% Hispanic 1%
- Foreign-born
- 3% · Canada, Vietnam
- Languages at home
- 96% English-only · Spanish 2%
Political lean MEDSL · Orleans
- 2024 margin
- Solid D (+67.0) · D 82.2% · R 15.2% · Other 2.7%
- 2008→2024 swing
- +6.7pp toward D · 2008: 60.3pp · 2024: 67.0pp
- All cycles
- 2024: D+67.0 2020: D+68.2 2016: D+66.2 2012: D+62.5 2008: D+60.3
Not yet ingested
- Civics
- —
Market trends
- HPI YoY
- ▼ -72.43%
- Current HPI
- 175.4465
- Rent YoY
- —
- Metro
- New Orleans-Metairie, LA
- State GDP YoY
- ▲ 3.29%
- F500 in state
- 10
Industry mix (Fortune 500 HQ in LA)
| Industry | F500 HQs | Revenue |
|---|---|---|
| Telecommunications | 2 | $23B |
|
||
| Utilities | 1 | $12B |
|
||
| Wholesale / Distribution | 1 | $5B |
|
||
| Advertising | 1 | $2B |
|
||
Price history
+312.8% since first listed7 events — show timeline
- 2026-02-20 Listed $161,000 AcadianaMLS
- 2026-02-20 Listed $161,000 GSREIN
- 2009-03-02 Sold (Public Records) $27,000 Public Records
- 1994-05-27 Sold (Public Records) $23,000 Public Records
- 1994-05-27 Sold (MLS) $23,000 GSREIN
- 1993-10-27 Listed $39,000 AcadianaMLS
- 1993-10-27 Listed $39,000 GSREIN
Property tax history
-1.9%/yrLatest (2026): $1,176 · +1.1% YoY. Source: county tax records.
Cash-flow waterfall
monthlySold comps — $/sqft
last 12 mo · ≤1 miLoading sold comps…