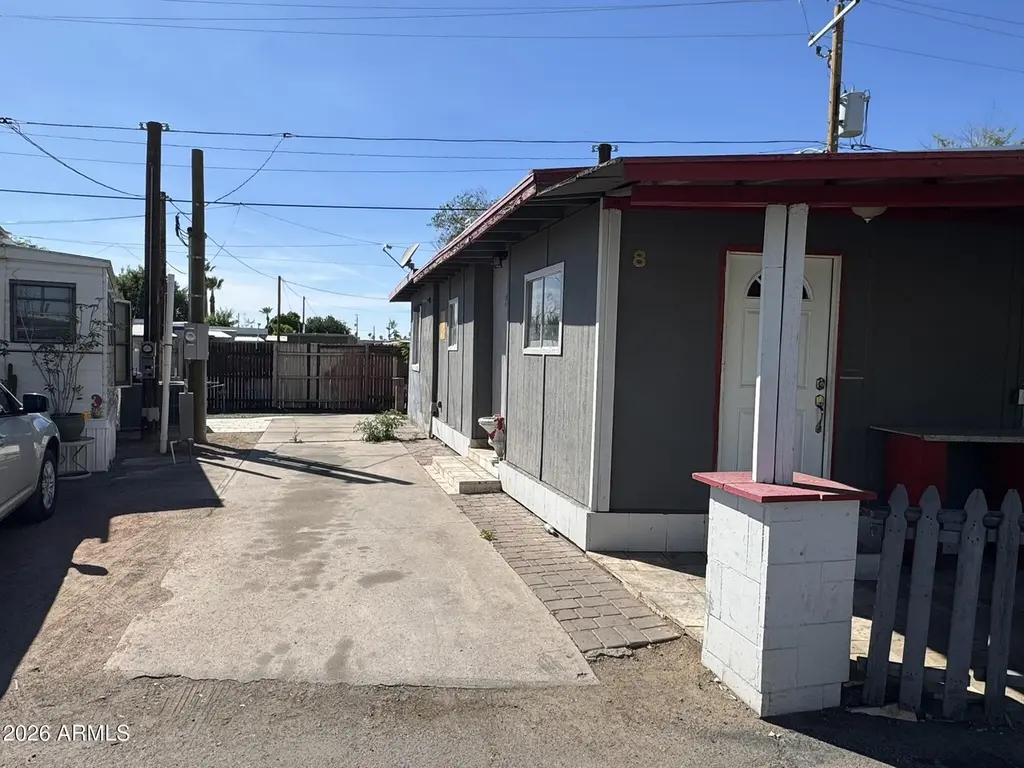
3140 W Osborn -- #8 · Phoenix, AZ
Flood risk 1/10 · Minimal
- FEMA flood zone
- X (shaded)
- Chance of flooding over 30 yrs
- 0.0%
- Est. flood insurance / yr
- $507 – $1,088
Fire risk 1/10 · Minimal
- Est. fire insurance / yr
- $610 – $1,132
Heat risk 9/10 · Severe
- Hot days now (above 112°F)
- 7 days/yr
- Hot days in 30 yrs
- 18 days/yr
Wind risk 1/10 · Minimal
- Chance of severe wind over 30 yrs
- —
Air-quality risk 3/10 · Minor
- Unhealthy air days now
- 3 days/yr
- Unhealthy air days in 30 yrs
- 3 days/yr
Risk factors via First Street. Map © Google.
Why this score? — see what drove the B- grade
The composite is a weighted blend of 9 inputs, each scored 0–100. Each bar is that input's sub-score; the figure is the points it added to the 100-point composite (weight × sub-score).
- Cash flow +30.0/30.0
- 1% rule +10.0/10.0
- DSCR +10.0/10.0
- ARV discount +7.5/15.0
- Livability +3.8/5.0
- Rent growth +2.4/5.0
- Condition / age +2.2/5.0
- Schools +1.1/10.0
- Appreciation +0.0/10.0
$49,000
🖨 Deal sheet 📄 Offer letter ✓ Due diligence
Listing remarks
FINANCING AVAILABLE! Good starter mobile home in a very central location. Rare slab parking available at property! Land lease is $750 per month and buyer must be approved with community manager prior to closing.
Key facts
- Rare slab parking
- Central location
- 3,500 sq ft lot
Tags
Property features AI
Finance
- Other: Lot size listed as 3,500 (source: owner)
- HOA & community: Trash included in association fee; Land lease of $750 per month
Exterior
- Parking: 2 open parking spaces
- Utilities: City water; Public sewer
- Home design: Manufactured/mobile home; Leasehold property
- Construction: Aluminum siding; Wood frame construction; Composition roof
- Exterior features: No notable lot features listed
Interior
- Kitchen: Refrigerator
- Bedrooms: 2 bedrooms
- Bathrooms: 2 full bathrooms
- Heating & cooling: Electric heating; Mini split cooling
- Interior features: Eat-in kitchen; Breakfast bar; Two master bathrooms; Full bath in master bedroom
- Laundry & utility: No laundry hook-ups/washer-dryer not provided
Neighborhood map
What this means for you Summary
Snapshot
- This is a 2-bed/2.0-bath manufactured listed at $49k. Condition is rated fair.
Deal economics
- At list price, monthly cash flow is $702 ($8k/yr) — positive.
- The deal already cash-flows at list — no discount required.
- Meets the 1% rule at list price ($1k rent vs $49k).
- Recommended offer: $46k (6.0% below list) — sets the bar for market timing.
- Cap rate 23.5% vs local median 3.3% in Phoenix — top-decile yield for the area; either an underpriced asset or a hidden risk that comps aren't pricing in. Stress-test before assuming the spread holds.
Location & tenants
- Location reads 75/100 on livability (#16 in AZ, #3,924 nationally) — a middle-class / working-renter tenant base. Strengths: amenities A+, commute A+, housing A+; Watch: health & safety C-, crime F.
- Phoenix Union High School District (4286) (urban): math 10% / reading 15% proficiency, ranked #224 of 249 in AZ (top 90%) — low school quality limits family demand, transient renter base, plan for 1-2y turnover.
- Zoned schools: Alhambra High School (math 8% / reading 17%, grade F, #281 of 381 statewide, top 75%, 2,282 students, 86% FRL).
- Market conditions: Rents soft (-0.3%/yr); 87 active listings in the ZIP; 40 comparable units currently listed for rent nearby; rentals leasing fast (median 1d on market — plan ~1-2 weeks tenant-placement turnaround); 36,011 units permitted in Maricopa County in 2024 (12,801 in 5+ unit buildings).
Forward outlook
- Local home prices are declining (-3.0%/yr); year-one equity from $339 of loan paydown is wiped out by about $1k of value loss. Plan a longer hold.
- Maricopa County population projected at +38% by 2050 — long-run rental-demand tailwind backs the buy-and-hold thesis.
- At projected returns (-3.0% appreciation + 0.0% rent growth), your $14k cash investment doubles in ~2 years — after that, you're playing with house money.
Negotiation context
- It's been on market 72 days — a 6% lower offer ($46k) is reasonable based on typical stale-listing flexibility.
Risks & watch-outs
- Climate carrying-cost: extreme-heat days projected 7→18/yr by 2055 (HVAC capex compounding) — expect insurance premiums to compound above CPI over the hold.
Questions for the listing agent
- It's been on market 72 days. Have you received any prior offers? Is the seller open to a 6% concession, seller financing, or rate buy-down credit?
- Have any recent inspections been done? Can we get a copy of the seller's disclosures and any deferred-maintenance estimates?
- Built in 1971 — when were the roof, HVAC, electrical panel, plumbing, and water heater last replaced?
- Why hasn't it sold? Are there any deal-killer items the seller is aware of (foundation, flood, title, zoning, code violations)?
- Is there a deadline driving the sale (1031 exchange, divorce, estate, relocation)? That informs how much negotiation room exists.
- Crime grade is F in this area — have there been break-ins, vandalism, or insurance claims at this property in the last 3 years? What carrier currently insures it and at what premium?
- What's the average days-on-market for RENTAL listings here right now (not sales)? A rising rental-DOM trend means longer vacancies and softer asking-rent achievability than the comps imply.
- What's the recent tenant-quality profile in this submarket — average credit score on applications, eviction rate, late-payment / NSF rate, and stable-employment percentage? A property-management company in the area should have these aggregated.
- How much new for-sale + rental construction is in the pipeline within 1–3 miles? Heavy new supply typically softens prices + rents 12–24 months out; constrained supply supports both.
Investment metrics
- 1% rule
- 2.69% ✓
- Cap rate
- 23.49%
- Cash-on-cash
- 61.43%
- DSCR
- 3.73
- GRM
- 3.1
CMA / ARV
No comps found within radius.
Projected returns pro-forma
-3.0% appreciation · 0.0% rent growth · sell at horizon
- IRR
- 56.9%
- Equity multiple
- 3.40×
- Total profit
- $32,951
- Equity at exit
- $7,306
- IRR
- 60.7%
- Equity multiple
- 6.21×
- Total profit
- $71,451
- Equity at exit
- $4,237
Cash invested: $13,720 (down + closing). Projections, not guarantees.
Landlord ↔ Tenant lean methodology
- Overall (STATE)
- 87 Strongly Landlord-Friendly
- State Arizona
- 87 Strongly Landlord-Friendly · R+3
- County
- — inherits STATE
- City
- — inherits STATE
ZIP-level market 85017
- Home prices YoY
- -14.4%
- Rents YoY
- -0.3%
- Active inventory
- 87
- Price-to-rent
- 3.1×
Monthly cashflow live
- Estimated rent
- $1,318 high interval (Pro) →
- Mortgage (P&I)
- −$257
- Tax est. 1.5%
- −$61 /mo · $735/yr
- Insurance
- −$20
- HOA
- −$0
- Vacancy / Maint / Mgmt
- −$277
- Net cashflow
- $702
Break-even live
UW: 25.0% down · 7.5% · 30yr · 1.5% tax · 5.0% vac · 8.0% maint · 8.0% mgmt
Financing live
Cash to close
- Down payment
- $12,250
- Closing costs
- $1,470
- Reserves months
- —
- Total cash needed
- —
Loan-product check · same deal, 3 products live
Conventional
25% down · 7.5% · 30yr
- Down + closing
- —
- Monthly P&I
- —
- Monthly cashflow
- —
- DSCR
- —
- Eligible?
- —
Personal DTI + credit; lowest rate.
DSCR
20% down · 8.5% · 30yr
- Down + closing
- —
- Monthly P&I
- —
- Monthly cashflow
- —
- DSCR
- —
- Eligible?
- —
No personal income docs; deal must DSCR.
Hard money
10% down · 12.0% · 12mo
- Down + closing
- —
- Monthly P&I
- —
- Monthly cashflow
- —
- DSCR
- —
- Eligible?
- —
Short-term bridge; refi at stabilization.
Rent comps 40 comps
| Address | Beds | Baths | Sqft | Rent | $/sqft | DOM | Units | Dist |
|---|---|---|---|---|---|---|---|---|
| 3030 N 35th Ave Phoenix, AZ | 2.0 | 1.0 | 540 | $1,300 | $2.41 | 1d | 52 | 0.53mi |
| 3675 W Osborn Rd Phoenix, AZ | 1.0 | 1.0 | 525 | $899 | $1.71 | 1d | 6 | 0.57mi |
| 4201 N 35th Ave Phoenix, AZ | 1.0–2.0 | 1.0 | 588 | $1,399 | $2.38 | 1d | 3 | 0.68mi |
| 4235 N 35th Ave Phoenix, AZ | 1.0–3.0 | 1.0 | 750 | $1,362 | $1.82 | 1d | 13 | 0.71mi |
| 2602 W Monterey Way Phoenix, AZ | 3.0 | 1.0 | 1053 | $1,745 | $1.66 | 1d | 1 | 0.74mi |
| 3131 N Black Canyon Hwy Phoenix, AZ | 1.0–2.0 | 1.0 | 612 | $1,349 | $2.20 | 1d | 2 | 0.92mi |
| 4336 N 35th Ave Unit 202 Phoenix, AZ | 2.0 | 2.0 | 822 | $1,099 | $1.34 | 1d | 1 | 0.94mi |
| 4336 N 35th Ave Unit 238 Phoenix, AZ | 2.0 | 2.0 | 822 | $1,099 | $1.34 | 12d | 1 | 0.95mi |
| 4227 N 27th Ave Unit 1071 Phoenix, AZ | 2.0 | 2.0 | 862 | $1,449 | $1.68 | 5d | 1 | 0.97mi |
| 4227 N 27th Ave Unit 2079 Phoenix, AZ | 2.0 | 2.0 | 862 | $1,424 | $1.65 | 5d | 1 | 0.97mi |
| 4227 N 27th Ave Unit 2066 Phoenix, AZ | 2.0 | 1.0 | 779 | $1,374 | $1.76 | 5d | 1 | 0.97mi |
| 4227 N 27th Ave Unit 2154 Phoenix, AZ | 1.0 | 1.0 | 578 | $1,154 | $2.00 | 5d | 1 | 0.97mi |
| 4227 N 27th Ave Unit 3065 Phoenix, AZ | 2.0 | 1.0 | 779 | $1,349 | $1.73 | 5d | 1 | 0.97mi |
| 4227 N 27th Ave Unit 3008 Phoenix, AZ | 1.0 | 1.0 | 578 | $1,129 | $1.95 | 5d | 1 | 0.97mi |
| 4227 N 27th Ave Unit 3071 Phoenix, AZ | 2.0 | 2.0 | 862 | $1,399 | $1.62 | 5d | 1 | 0.97mi |
| 4227 N 27th Ave Unit 1098 Phoenix, AZ | 2.0 | 1.0 | 779 | $1,399 | $1.80 | 7d | 1 | 0.97mi |
| 4227 N 27th Ave Unit 1007 Phoenix, AZ | 1.0 | 1.0 | 578 | $1,179 | $2.04 | 5d | 1 | 0.97mi |
| 2426 W Earll Dr Phoenix, AZ | 2.0 | 2.0 | 1037 | $1,595 | $1.54 | 7d | 1 | 0.98mi |
| 4326 N 35th Ave Phoenix, AZ | 2.0 | 1.0–2.0 | 520 | $1,299 | $2.50 | 1d | 1 | 0.98mi |
| 2429 W Avalon Dr Phoenix, AZ | 2.0 | 2.0 | 1037 | $1,695 | $1.63 | 24d | 1 | 1.00mi |
| 4227 N 27th Ave Phoenix, AZ | 1.0 | 1.0 | 578 | $1,179 | $2.04 | 1d | 1 | 1.02mi |
| 4227 N 27th Ave Phoenix, AZ | 2.0 | 1.0 | 779 | $1,399 | $1.80 | 3d | 1 | 1.02mi |
| 3001 N Black Cyn Hwy Phoenix, AZ | 2.0 | 2.0 | 840 | $899 | $1.07 | 1d | 2 | 1.02mi |
| 3823 N 23rd Dr Phoenix, AZ | 2.0 | 1.0 | 926 | $1,499 | $1.62 | 1d | 1 | 1.10mi |
| 4102 W Osborn Rd Phoenix, AZ | 2.0 | 1.0–2.0 | 840 | $1,349 | $1.61 | 1d | 1 | 1.10mi |
| 2524 W Glenrosa Ave Phoenix, AZ | 1.0–2.0 | 1.0–2.0 | 665 | $1,495 | $2.25 | 1d | 35 | 1.11mi |
| 2414 W Devonshire Ave Apt 2 Phoenix, AZ | 1.0 | 1.0 | 620 | $995 | $1.60 | 1d | 1 | 1.16mi |
| 2414 W Devonshire Ave Apt 4 Phoenix, AZ | 1.0 | 1.0 | 620 | $995 | $1.60 | 21d | 1 | 1.16mi |
| 2414 W Devonshire Ave Apt 11 Phoenix, AZ | 2.0 | 1.0 | 850 | $1,350 | $1.59 | 1d | 1 | 1.16mi |
| 2414 W Devonshire Ave Unit 09 Phoenix, AZ | 2.0 | 1.0 | 850 | $1,275 | $1.50 | 1d | 1 | 1.17mi |
| 2322 W Thomas Rd Phoenix, AZ | 1.0 | 1.0 | 475 | $853 | $1.80 | 1d | 4 | 1.17mi |
| 2420 W Glenrosa Ave Unit 04 Phoenix, AZ | 1.0 | 1.0 | 765 | $995 | $1.30 | 2d | 1 | 1.23mi |
| 2420 W Glenrosa Ave Unit 01 Phoenix, AZ | 2.0 | 1.0 | 900 | $1,250 | $1.39 | 2d | 1 | 1.23mi |
| 2420 W Glenrosa Ave Unit 10 Phoenix, AZ | 2.0 | 1.0 | 900 | $1,250 | $1.39 | 1d | 1 | 1.23mi |
| 2420 W Glenrosa Ave Unit 14 Phoenix, AZ | 2.0 | 1.0 | 900 | $1,325 | $1.47 | 1d | 1 | 1.23mi |
| 2420 W Glenrosa Ave Phoenix, AZ | 1.0–2.0 | 1.0 | 832 | $1,325 | $1.59 | 4d | 4 | 1.23mi |
| 2433 W Campbell Ave Phoenix, AZ | 2.0 | 2.0 | 905 | $1,147 | $1.27 | 1d | 1 | 1.27mi |
| 4559 N 26th Dr Phoenix, AZ | 2.0 | 1.5 | 952 | $1,400 | $1.47 | 1d | 1 | 1.30mi |
| 3807 W Hazelwood St Phoenix, AZ | 3.0 | 2.0 | 1121 | $1,635 | $1.46 | 1d | 1 | 1.30mi |
| 3839 W Hazelwood St Unit 5 Phoenix, AZ | 2.0 | 1.0 | 995 | $950 | $0.95 | 1d | 1 | 1.34mi |
Listing history 16 events
-
2026-06-18days on market $49,000 Active 72 DOM
-
2026-06-17days on market $49,000 Active 71 DOM
-
2026-06-16days on market $49,000 Active 70 DOM
-
2026-06-15days on market $49,000 Active 69 DOM
-
2026-06-13days on market $49,000 Active 67 DOM
-
2026-06-13days on market $49,000 Active 66 DOM
-
2026-06-09days on market $49,000 Active 63 DOM
-
2026-06-08days on market $49,000 Active 62 DOM
-
2026-06-07days on market $49,000 Active 61 DOM
-
2026-06-04days on market $49,000 Active 58 DOM
-
2026-06-03days on market $49,000 Active 57 DOM
-
2026-06-02days on market $49,000 Active 56 DOM
-
2026-06-01days on market $49,000 Active 55 DOM
-
2026-05-31days on market $49,000 Active 54 DOM
-
2026-05-20price $49,000
-
2026-04-07$55,000 Active
ⓘ Source: listings_history table (triggers on properties + properties_extension) + one-shot
backfill from property_details.listing_events for pre-trigger history.
Climate risk First Street
- Flood 1/10 Low FEMA zone X (shaded) · 0% chance over 30 yrs
- Wildfire 1/10 Low
- Heat 9/10 Extreme 7 d/yr ≥112°F today · 18 d/yr by 30 yrs out
- Wind 1/10 Low
- Air quality 3/10 Moderate 3 unhealthy d/yr today · 3 by 30 yrs out
Nearby sold comps map
Loading sold comps map…
Walkable amenities ~0.75 mi
Loading nearby amenities…
Taxation est. · year 1
- Rental income
- $15,812
- − Mortgage interest
- −$2,745
- − Property taxes
- −$735
- − Insurance
- −$245
- − Repairs & maintenance
- −$1,265
- − Management
- −$1,265
- − Depreciation
- −$1,425
- Taxable income
- $8,132
- Est. tax owed @ 24.0%
- −$1,952
- After-tax cash flow
- $6,476/yr
For passive investors: Depreciation is non-cash, so a rental often shows a tax loss while cash-flowing — sheltering income. Rental losses are passive: they offset passive income freely, and up to $25,000/yr can offset ordinary (W-2) income if you actively participate and your MAGI is under $100k (phasing out to $0 by $150k); unused losses carry forward. On sale, claimed depreciation is recaptured at up to 25%, and gains may owe capital-gains tax (a 1031 exchange can defer both). Figures are a year-1 estimate at your 24.0% rate — not tax advice; consult a CPA.
Condition & rehab AI · 12 photos
This manufactured home requires moderate repairs and updates to its exterior and interior to improve its condition and value.
Repairs flagged
- Major exterior siding — Severe weathering and peeling
- Major exterior paint — Significant wear and fading
- Major interior walls — Visible wear and tear
Value-add opportunities
- Both paint exterior — Enhances curb appeal and value
- Both paint interior walls — Improves aesthetics and value
- Both update bathrooms — Modernizes and increases value
- Both update kitchen — Modernizes and increases value
Renovation cost estimate screening
| Repair item | Severity | Est. cost |
|---|---|---|
| exterior siding · Severe weathering and peeling | Major | $15,000–50,000 |
| exterior paint · Significant wear and fading | Major | $15,000–50,000 |
| interior walls · Visible wear and tear | Major | $15,000–50,000 |
| Total estimated repair cost · 3 items | $45,000–150,000 |
Value-add ROI direction
- Both paint exterior — Enhances curb appeal and value ↑
- Both paint interior walls — Improves aesthetics and value ↑
- Both update bathrooms — Modernizes and increases value ↑
- Both update kitchen — Modernizes and increases value ↑
ⓘ Cost ranges are severity-bucket heuristics (US national rule-of-thumb). Get contractor quotes + a written scope before underwriting a rehab budget.
Schools (NCES district)
- District
- Phoenix Union High School District (4286)
- NCES district ID
- 0406330
- Math proficiency
- 10% ▼ -27.00%
- Reading proficiency
- 15% ▼ -18.00%
- Median HH income
- $39,055
- Composite
- 10.63/100
- National rank
- #9773
- State rank
- #224 of 249 in AZ
Livability — Phoenix
- Score
- 75/100
- State rank
- #16
- US rank
- #3924
Category grades
Schools grade is shown separately in the Schools card above.
Census & demographics
- Census place
- Phoenix, AZ
- County
- Maricopa County · 4,537,380 people
- City population
- 1,500,198
- Metro
- Phoenix-Mesa-Chandler, AZ
- Population (ZIP)
- 46,129
- Household income
- $58,346
- Rent vs Own
- Severe rent burden
- 1843.0
Population outlook (Maricopa County) Hauer SSP2
- Today (2025)
- 4,979,203 people
- By 2030
- 5,378,229 · +8.0%
- By 2040
- 6,156,598 · +23.6%
- By 2050
- 6,872,376 · +38.0%
- By 2075
- 8,401,270 · +68.7%
- By 2100
- 9,247,439 · +85.7%
Race, ethnicity, and origin ACS 2023
- Neighborhood character
- Diverse neighborhood (Simpson 0.58)
- Race & ethnicity
- Hispanic / Latino 61% Two or more races 31% White 20% Black 10% Asian 3% Native American 2%
- Hispanic origin (detail)
- Mexican 54%
- Common ancestry
- Iranian 1% Italian 1% Portuguese 1%
- Foreign-born
- 31% · Canada, Philippines, Vietnam
- Languages at home
- 40% English-only · Spanish 51% Other Asian/Pacific 2% Other Indo-European 1%
Political lean MEDSL · Maricopa
- 2024 margin
- Toss-up / Even · D 47.7% · R 51.2% · Other 1.1%
- 2008→2024 swing
- +7.1pp toward D · 2008: -10.6pp · 2024: -3.5pp
- All cycles
- 2024: R+3.5 2020: D+2.2 2016: R+3.5 2012: R+12.0 2008: R+10.6
Not yet ingested
- Civics
- —
Market trends
- HPI YoY
- ▼ -79.21%
- Current HPI
- 471.0211
- Rent YoY
- ▼ -0.33%
- Metro
- Phoenix-Mesa-Chandler, AZ
- State GDP YoY
- ▲ 4.54%
- F500 in state
- 20
Industry mix (Fortune 500 HQ in AZ)
| Industry | F500 HQs | Revenue |
|---|---|---|
| Technology | 2 | $13B |
|
||
| Mining / Metals | 1 | $23B |
|
||
| Environmental Services | 1 | $16B |
|
||
| Metals / Steel | 1 | $14B |
|
||
| Technology Distribution | 1 | $9B |
|
||
| Homebuilding | 1 | $8B |
|
||
Price history
-10.9% since first listed2 events — show timeline
- 2026-05-20 Price Changed $49,000 ARMLS
- 2026-04-07 Listed $55,000 ARMLS
Cash-flow waterfall
monthlySold comps — $/sqft
last 12 mo · ≤1 miLoading sold comps…