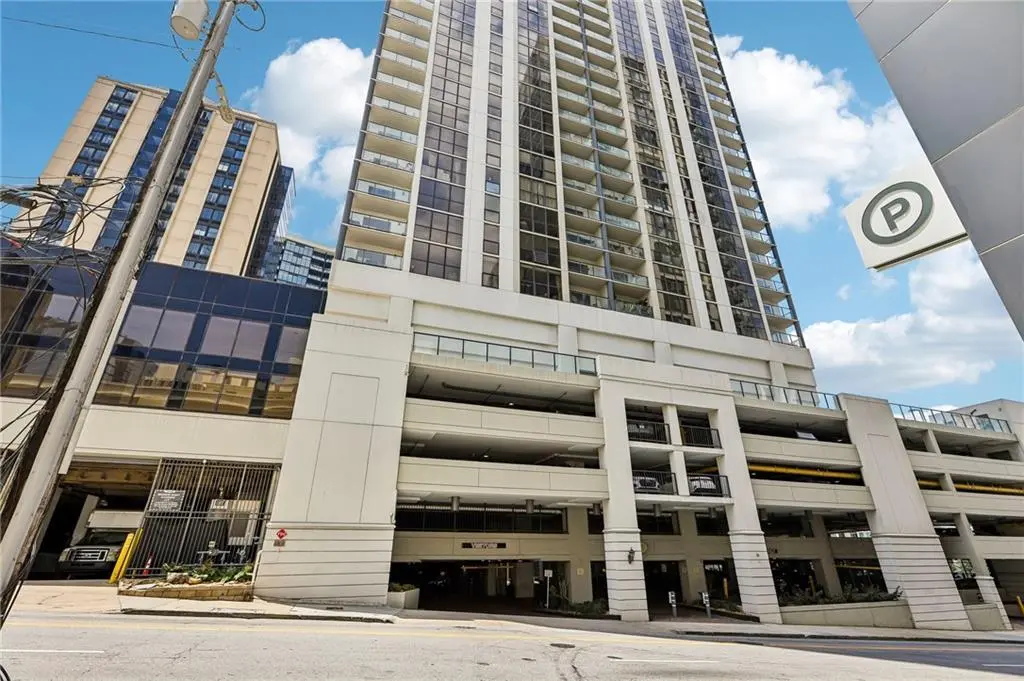
1280 W Peachtree St NW #2504 · Atlanta, GA
Flood risk No data
- FEMA flood zone
- —
- Chance of flooding over 30 yrs
- —
- Est. flood insurance / yr
- —
Fire risk No data
- Est. fire insurance / yr
- —
Heat risk No data
- Hot days now (above threshold)
- —
- Hot days in 30 yrs
- —
Wind risk No data
- Chance of severe wind over 30 yrs
- —
Air-quality risk No data
- Unhealthy air days now
- —
- Unhealthy air days in 30 yrs
- —
Risk factors via First Street. Map © Google.
Why this score? — see what drove the D- grade
The composite is a weighted blend of 9 inputs, each scored 0–100. Each bar is that input's sub-score; the figure is the points it added to the 100-point composite (weight × sub-score).
- Cash flow +8.6/30.0
- ARV discount +7.5/15.0
- 1% rule +5.5/10.0
- Livability +4.2/5.0
- Rent growth +3.3/5.0
- Schools +2.7/10.0
- Condition / age +2.5/5.0
- DSCR +2.4/10.0
- Appreciation +0.0/10.0
$220,000
🖨 Deal sheet 📄 Offer letter ✓ Due diligence
Listing remarks MLS
Perched on the 25th floor in one of Midtown Atlanta's most recognizable high-rises, this sophisticated residence offers dramatic city views, floor-to-ceiling glass, and a coveted private balcony rarely found in comparable units. Enjoy an effortless lock-and-leave lifestyle complemented by resort-style amenities, concierge service, and a premier location steps from Atlanta's cultural, dining, and business districts. Experience the perfect blend of convenience, luxury, and vibrant urban living.
Key facts
- Private balcony
- Premier location
- Dramatic city views
Tags
Property features AI
Finance
- Other: Directions: From I-75/I-85, take the 14th Street exit west, left onto West Peachtree Street NW; 1280 West is directly across from the Arts Center MARTA Station.
- Financial info: Community contains 1 unit
- HOA & community: Monthly association fee ($496) covering grounds maintenance, receptionist, and reserve fund; Association present
Exterior
- Parking: Deeded parking (1 space)
- Utilities: Public water; Public sewer; 220V electric service; Cable available; Electricity available; Sewer available; Water available
- Home design: Condominium; One level
- Construction: Brick construction; Composition roof; Resale condition
- Exterior features: Paved, city street frontage; Community amenities: concierge, dog park, fitness center, pool, storage
Interior
- Kitchen: Cabinetry; Dishwasher; Microwave
- Bedrooms: Primary bedroom on the main level
- Flooring: Hardwood
- Bathrooms: Full bathroom with tub/shower combo (main level)
- Heating & cooling: Heat pump; Ceiling fan(s); Electric cooling
- Interior features: Walk-in closet(s); Double-pane windows; 1 common wall
- Laundry & utility: Laundry in a common area
Neighborhood map
What this means for you Summary
Snapshot
- This is a 1-bed/1.0-bath condo listed at $220k.
Deal economics
- At list price, monthly cash flow is $-190 ($-2k/yr) — negative.
- To cash-flow at today's rent, offer at most $186k (15.3% below list).
- Meets the 1% rule at list price ($2k rent vs $220k).
- Recommended offer: $186k (15.3% below list) — sets the bar for cash-flow.
- Cap rate 5.3% vs local median 3.1% in Atlanta — top-decile yield for the area; either an underpriced asset or a hidden risk that comps aren't pricing in. Stress-test before assuming the spread holds.
Location & tenants
- Location reads 83/100 on livability (#6 in GA, #919 nationally) — a professional / high-income tenant draw. Strengths: amenities A+, commute A+, housing A+; Watch: cost of living C-.
- Atlanta Public Schools (urban): math 28% / reading 35% proficiency, ranked #80 of 174 in GA (top 46%) — families likely to look elsewhere, expect single-tenant / working-renter base with shorter leases; 71% free/reduced lunch — lower-income household profile, screen leases tightly.
- Zoned schools: Morningside Elementary School (math 71% / reading 72%, grade A-, #47 of 1,228 statewide, top 4%, 816 students, 6% FRL) — zoned schools average 6% FRL vs 71% district-wide (65 pts lower); this property's tenant base skews higher-income than the district average.
- Zoned-school proficiency averages 72% at this address vs 32% district-wide (+40 pts) — the actual schools serving this property are materially stronger than the Atlanta Public Schools average implies; a family-tenant draw the district grade alone would hide.
- Market conditions: Rents rising (+3.1%/yr); 408 active listings in the ZIP; 40 comparable units currently listed for rent nearby; rentals leasing fast (median 3d on market — plan ~1-2 weeks tenant-placement turnaround); high-income renter base; 11,565 units permitted in Fulton County in 2024 (8,159 in 5+ unit buildings).
Forward outlook
- Local home prices are declining (-3.0%/yr); year-one equity from $2k of loan paydown is wiped out by about $7k of value loss. Plan a longer hold.
- Fulton County population projected at +38% by 2050 — long-run rental-demand tailwind backs the buy-and-hold thesis.
Negotiation context
- Only 14 days on market — expect competitive offers; lowballing is unlikely to land.
- 16 sale attempts since 15y ago with the ask held roughly flat each time — persistent listings suggest the price (not the market) is what's stuck; bring a comps-based counter.
Risks & watch-outs
- Watch-outs: HOA is 21% of rent.
Questions for the listing agent
- What do current leases actually rent for vs. the listed asking? Can we see a recent rent roll and the last 12 months of T-12 income?
- What does the HOA fee cover, when was the last increase, and are there any pending special assessments or reserve-fund shortfalls?
- Any open or pending special assessments — roof, HVAC, plumbing, elevator, façade? What's the per-unit balance and payoff schedule, and is the seller paying it off at close or rolling it to the buyer?
- Is there a deadline driving the sale (1031 exchange, divorce, estate, relocation)? That informs how much negotiation room exists.
- The area grade is low — what's the realistic commute time and amenity access for the typical tenant pool here? Any planned neighborhood developments (good or bad) we should know about?
- What's the average days-on-market for RENTAL listings here right now (not sales)? A rising rental-DOM trend means longer vacancies and softer asking-rent achievability than the comps imply.
- What's the recent tenant-quality profile in this submarket — average credit score on applications, eviction rate, late-payment / NSF rate, and stable-employment percentage? A property-management company in the area should have these aggregated.
- How much new apartment / multifamily construction is in the pipeline within 1–3 miles? Heavy new supply (>2% of stock underway) typically softens rents 12–24 months out; light construction supports rent growth.
Investment metrics
- 1% rule
- 1.05% ✓
- Cap rate
- 5.26%
- Cash-on-cash
- -3.70%
- DSCR
- 0.84
- GRM
- 7.9
CMA / ARV
No comps found within radius.
Projected returns pro-forma
-3.0% appreciation · 3.09% rent growth · sell at horizon
- IRR
- -22.2%
- Equity multiple
- 0.23×
- Total profit
- $-47,204
- Equity at exit
- $32,803
- IRR
- -15.4%
- Equity multiple
- 0.12×
- Total profit
- $-54,436
- Equity at exit
- $19,022
Cash invested: $61,600 (down + closing). Projections, not guarantees.
Landlord ↔ Tenant lean methodology
- Overall (STATE)
- 90 Strongly Landlord-Friendly
- State Georgia
- 90 Strongly Landlord-Friendly · R+3
- County
- — inherits STATE
- City
- — inherits STATE
ZIP-level market 30309
- Rents YoY
- 3.1%
- Active inventory
- 408
- Price-to-rent
- 7.9×
Monthly cashflow live
- Estimated rent
- $2,319 high interval (Pro) →
- Mortgage (P&I)
- −$1,154
- Tax from tax record
- −$281 /mo · $3,368/yr
- Insurance
- −$92
- HOA
- −$496
- Vacancy / Maint / Mgmt
- −$487
- Net cashflow
- $-190
Break-even live
UW: 25.0% down · 7.5% · 30yr · 1.5% tax · 5.0% vac · 8.0% maint · 8.0% mgmt
Financing live
Cash to close
- Down payment
- $55,000
- Closing costs
- $6,600
- Reserves months
- —
- Total cash needed
- —
Loan-product check · same deal, 3 products live
Conventional
25% down · 7.5% · 30yr
- Down + closing
- —
- Monthly P&I
- —
- Monthly cashflow
- —
- DSCR
- —
- Eligible?
- —
Personal DTI + credit; lowest rate.
DSCR
20% down · 8.5% · 30yr
- Down + closing
- —
- Monthly P&I
- —
- Monthly cashflow
- —
- DSCR
- —
- Eligible?
- —
No personal income docs; deal must DSCR.
Hard money
10% down · 12.0% · 12mo
- Down + closing
- —
- Monthly P&I
- —
- Monthly cashflow
- —
- DSCR
- —
- Eligible?
- —
Short-term bridge; refi at stabilization.
Rent comps 40 comps
| Address | Beds | Baths | Sqft | Rent | $/sqft | DOM | Units | Dist |
|---|---|---|---|---|---|---|---|---|
| 1240 W Peachtree St NW Atlanta, GA | 2.0 | 1.0–2.0 | 1101 | $3,454 | $3.14 | 2d | 25 | 0.03mi |
| 1280 W Peachtree St NW Atlanta, GA | 1.0–2.0 | 1.0–2.0 | 826 | $1,800 | $2.18 | 24d | 2 | 0.03mi |
| 1270 Spring St NW Atlanta, GA | 1.0–2.0 | 1.0–2.0 | 987 | $1,683 | $1.71 | 2d | 17 | 0.07mi |
| 1230 W Peachtree St NW Atlanta, GA | 3.0 | 1.0–2.0 | 1066 | $3,088 | $2.90 | 1d | 51 | 0.07mi |
| 1301 Spring St NW Atlanta, GA | 2.0 | 1.0–2.0 | 939 | $3,112 | $3.31 | 2d | 39 | 0.08mi |
| 22 14th St NW Atlanta, GA | 3.0 | 1.0–2.0 | 1039 | $2,539 | $2.44 | 2d | 32 | 0.20mi |
| 1163 W Peachtree St NE Atlanta, GA | 2.0 | 1.0–2.0 | 1013 | $2,804 | $2.77 | 2d | 45 | 0.21mi |
| 1163 W Peachtree St NW Atlanta, GA | — | 1.0 | 628 | $1,871 | $2.98 | 3d | 1 | 0.23mi |
| 1140 Spring St NW Atlanta, GA | 3.0 | 1.0–2.0 | 1196 | $2,748 | $2.30 | 3d | 20 | 0.24mi |
| 1384 W Peachtree St NW Atlanta, GA | — | 1.0 | 384 | $895 | $2.33 | 24d | 1 | 0.24mi |
| 1382 Peachtree St NE Atlanta, GA | 3.0 | 1.0–2.0 | 919 | $2,719 | $2.96 | 1d | 28 | 0.25mi |
| 1400 W Peachtree St NW Atlanta, GA | 2.0 | 1.0–2.0 | 910 | $2,492 | $2.74 | 1d | 33 | 0.26mi |
| 1400 W Peachtree St NE Unit 813 Atlanta, GA | 1.0 | 1.0 | 652 | $1,986 | $3.05 | 15d | 1 | 0.26mi |
| 1405 Spring St NW Atlanta, GA | 3.0 | 1.0–2.0 | 920 | $3,366 | $3.66 | 2d | 41 | 0.28mi |
| 1136 Crescent Ave NE Atlanta, GA | 1.0 | 1.0 | 552 | $1,500 | $2.72 | 22d | 6 | 0.34mi |
| 1421 Peachtree St NE Unit 103-A Atlanta, GA | 1.0 | 1.0 | 625 | $1,700 | $2.72 | 5d | 1 | 0.35mi |
| 1441 Peachtree St NE Atlanta, GA | 3.0 | 1.0–2.0 | 961 | $2,676 | $2.78 | 2d | 93 | 0.38mi |
| 1074 Peachtree Walk NE Unit B222 Atlanta, GA | 1.0 | 1.0 | 730 | $1,850 | $2.53 | 7d | 1 | 0.39mi |
| 1074 Peachtree Walk NE Unit B222 Atlanta, GA | 1.0 | 1.0 | 730 | $1,900 | $2.60 | 18d | 1 | 0.39mi |
| 77 12th St NE Atlanta, GA | 2.0 | 1.0–2.0 | 941 | $2,613 | $2.78 | 2d | 22 | 0.39mi |
| 10 Tower St NW Atlanta, GA | 2.0 | 1.0–2.0 | 1014 | $3,512 | $3.46 | 1d | 194 | 0.42mi |
| 33 11th St NE Atlanta, GA | 2.0 | 1.0–2.0 | 1148 | $3,698 | $3.22 | 2d | 28 | 0.44mi |
| 1018 W Peachtree St NW Atlanta, GA | 3.0 | 1.0–3.0 | 1156 | $3,444 | $2.98 | 2d | 35 | 0.45mi |
| 1010 W Peachtree St NW Atlanta, GA | 2.0 | 1.0–2.0 | 865 | $2,620 | $3.03 | 2d | 26 | 0.48mi |
| 1000 Spring St NW Atlanta, GA | 3.0 | 1.0–3.0 | 1001 | $3,491 | $3.49 | 2d | 16 | 0.49mi |
| 222 14th St NE Atlanta, GA | 2.0 | 1.0–2.0 | 858 | $2,140 | $2.49 | 1d | 10 | 0.50mi |
| 199 14th St NE #201 Atlanta, GA | 1.0 | 1.0 | 625 | $1,695 | $2.71 | 24d | 1 | 0.50mi |
| 199 14th St NE Unit 209 Atlanta, GA | 1.0 | 1.0 | 750 | $1,495 | $1.99 | 24d | 1 | 0.51mi |
| 199 14th St NE #812 Atlanta, GA | — | 1.0 | 533 | $1,390 | $2.61 | 24d | 1 | 0.51mi |
| 1081 Juniper St NE Atlanta, GA | 3.0 | 1.0–3.5 | 1375 | $7,290 | $5.30 | 3d | 105 | 0.52mi |
| 195 13th St NE Atlanta, GA | 2.0 | 1.0–2.0 | 804 | $2,790 | $3.47 | 1d | 14 | 0.53mi |
| 1200 14th Pl NE Atlanta, GA | 1.0 | 1.0 | 650 | $1,595 | $2.45 | 24d | 1 | 0.56mi |
| 207 13th St NE Atlanta, GA | 3.0 | 1.0–3.5 | 1645 | $3,499 | $2.13 | 7d | 14 | 0.57mi |
| 208 12th St NE Unit 102 Atlanta, GA | 1.0 | 1.0 | 575 | $2,250 | $3.91 | 24d | 1 | 0.57mi |
| 208 12th St NE Unit 202 Atlanta, GA | 1.0 | 1.0 | 575 | $2,250 | $3.91 | 18d | 1 | 0.57mi |
| 1020 Piedmont Ave NE Atlanta, GA | 2.0 | 1.0–2.0 | 1005 | $2,950 | $2.93 | 1d | 23 | 0.63mi |
| 180 10th St NE Atlanta, GA | 1.0–3.0 | 1.0–3.0 | 1345 | $2,095 | $1.56 | 1d | 21 | 0.64mi |
| 915 W Peachtree St NW Atlanta, GA | 2.0 | 1.0–2.0 | 1262 | $4,122 | $3.27 | 2d | 23 | 0.64mi |
| 1220 Mecaslin St NW Atlanta, GA | 1.0–3.0 | 1.0–3.0 | 1060 | $1,563 | $1.47 | 2d | 19 | 0.66mi |
| 401 16th St NW Unit 1357A Atlanta, GA | 1.0 | 1.0 | 750 | $2,000 | $2.67 | 24d | 1 | 0.67mi |
HOA detail condo
- Monthly dues
- $496 · $5,952/yr
- Likely covers
- doorman
- Assessments
- None detected in remarks — confirm with the listing agent.
Listing history 11 events
-
2026-06-18days on market $220,000 Active 14 DOM
-
2026-06-17days on market $220,000 Active 13 DOM
-
2026-06-16days on market $220,000 Active 12 DOM
-
2026-06-15days on market $220,000 Active 11 DOM
-
2026-06-13days on market $220,000 Active 9 DOM
-
2026-06-13days on market $220,000 Active 8 DOM
-
2026-06-09days on market $220,000 Active 5 DOM
-
2026-06-08days on market $220,000 Active 4 DOM
-
2026-06-07days on market $220,000 Active 3 DOM
-
2026-06-04remarks 497-char remark
Show marketing remark (497 chars)
Perched on the 25th floor in one of Midtown Atlanta's most recognizable high-rises, this sophisticated residence offers dramatic city views, floor-to-ceiling glass, and a coveted private balcony rarely found in comparable units. Enjoy an effortless lock-and-leave lifestyle complemented by resort-style amenities, concierge service, and a premier location steps from Atlanta's cultural, dining, and business districts. Experience the perfect blend of convenience, luxury, and vibrant urban living.
-
2026-06-04$220,000 Active 1 DOM
Show marketing remark (497 chars)
Perched on the 25th floor in one of Midtown Atlanta's most recognizable high-rises, this sophisticated residence offers dramatic city views, floor-to-ceiling glass, and a coveted private balcony rarely found in comparable units. Enjoy an effortless lock-and-leave lifestyle complemented by resort-style amenities, concierge service, and a premier location steps from Atlanta's cultural, dining, and business districts. Experience the perfect blend of convenience, luxury, and vibrant urban living.
ⓘ Source: listings_history table (triggers on properties + properties_extension) + one-shot
backfill from property_details.listing_events for pre-trigger history.
Tax reassessment forecast GA · Resets to sale price
- Current annual tax
- $3,368 · $281/mo
- Projected year-2 tax
- $3,368 · $281/mo
- Expected delta
- $0/yr ($0/mo · 0.0%)
ⓘ Screening estimate from a state-policy table — verify with the county assessor before closing.
Nearby sold comps map
Loading sold comps map…
Walkable amenities ~0.75 mi
Loading nearby amenities…
Taxation est. · year 1
- Rental income
- $27,826
- − Mortgage interest
- −$12,323
- − Property taxes
- −$3,368
- − Insurance
- −$1,100
- − Repairs & maintenance
- −$2,226
- − Management
- −$2,226
- − HOA
- −$5,952
- − Depreciation
- −$6,400
- Taxable loss
- −$5,769
- Est. tax savings @ 24.0%
- +$1,385
- After-tax cash flow
- $-897/yr
For passive investors: Depreciation is non-cash, so a rental often shows a tax loss while cash-flowing — sheltering income. Rental losses are passive: they offset passive income freely, and up to $25,000/yr can offset ordinary (W-2) income if you actively participate and your MAGI is under $100k (phasing out to $0 by $150k); unused losses carry forward. On sale, claimed depreciation is recaptured at up to 25%, and gains may owe capital-gains tax (a 1031 exchange can defer both). Figures are a year-1 estimate at your 24.0% rate — not tax advice; consult a CPA.
Schools (NCES district)
- District
- Atlanta Public Schools
- NCES district ID
- 1300120
- Math proficiency
- 28% ▼ -6.00%
- Reading proficiency
- 35% ▼ -2.00%
- Median HH income
- $48,306
- Composite
- 27.27/100
- National rank
- #7006
- State rank
- #80 of 174 in GA
Livability — Atlanta
- Score
- 83/100
- State rank
- #6
- US rank
- #919
Category grades
Schools grade is shown separately in the Schools card above.
Census & demographics
- Census place
- Atlanta, GA
- County
- Fulton County · 1,094,430 people
- City population
- 629,525
- Metro
- Atlanta-Sandy Springs-Alpharetta, GA
- Population (ZIP)
- 32,479
- Household income
- $114,072
- Rent vs Own
- Severe rent burden
- 2135.0
Population outlook (Fulton County) Hauer SSP2
- Today (2025)
- 1,203,707 people
- By 2030
- 1,299,706 · +8.0%
- By 2040
- 1,488,256 · +23.6%
- By 2050
- 1,664,580 · +38.3%
- By 2075
- 2,036,072 · +69.2%
- By 2100
- 2,222,402 · +84.6%
Race, ethnicity, and origin ACS 2023
- Neighborhood character
- Diverse neighborhood (Simpson 0.57)
- Race & ethnicity
- White 62% Black 14% Asian 9% Hispanic / Latino 8% Two or more races 8%
- Hispanic origin (detail)
- Mexican 2% Puerto Rican 2%
- Common ancestry
- Slovak 3% Romanian 2% Lithuanian 2%
- Foreign-born
- 15% · Canada, China, South Korea
- Languages at home
- 83% English-only · Spanish 5% Other Indo-European 4% Chinese 3%
Political lean MEDSL · Fulton
- 2024 margin
- Solid D (+44.9) · D 71.9% · R 27.0% · Other 1.1%
- 2008→2024 swing
- +9.8pp toward D · 2008: 35.0pp · 2024: 44.9pp
- All cycles
- 2024: D+44.9 2020: D+46.4 2016: D+42.1 2012: D+29.6 2008: D+35.0
Not yet ingested
- Civics
- —
Market trends
- HPI YoY
- ▼ -561.75%
- Current HPI
- 156.3796
- Rent YoY
- ▲ 3.09%
- Metro
- Atlanta-Sandy Springs-Alpharetta, GA
- State GDP YoY
- ▲ 2.66%
- F500 in state
- 28
Industry mix (Fortune 500 HQ in GA)
| Industry | F500 HQs | Revenue |
|---|---|---|
| Paper / Packaging | 2 | $29B |
|
||
| Retail | 1 | $160B |
|
||
| Transportation / Logistics | 1 | $91B |
|
||
| Airlines | 1 | $62B |
|
||
| Consumer Goods | 1 | $47B |
|
||
| Utilities | 1 | $25B |
|
||
Price history
+323.1% since first listed56 events — show timeline
- 2026-06-04 Listed $220,000 GAMLS
- 2026-06-04 Listed $220,000 FMLS
- 2024-03-06 Sold (Public Records) $225,000 Public Records
- 2024-03-04 Sold (MLS) $225,000 GAMLS
- 2024-03-04 Sold (MLS) $225,000 FMLS
- 2024-02-06 Contingent — GAMLS
- 2024-02-06 Contingent — FMLS
- 2024-01-17 Listed $225,000 GAMLS
- 2024-01-17 Listed $225,000 FMLS
- 2021-11-10 Sold (Public Records) $191,000 Public Records
- 2021-11-08 Sold (MLS) $191,000 GAMLS
- 2021-11-08 Sold (MLS) $191,000 FMLS
- 2021-10-27 Pending — FMLS
- 2021-10-26 Pending — GAMLS
- 2021-10-26 Contingent — FMLS
- 2021-10-04 Price Changed $195,000 FMLS
- 2021-10-04 Price Changed $195,000 GAMLS
- 2021-09-13 Relisted — GAMLS
- 2021-09-11 Relisted — FMLS
- 2021-08-03 Pending — FMLS
- 2021-08-02 Pending — GAMLS
- 2021-08-02 Contingent — FMLS
- 2021-07-08 Relisted — GAMLS
- 2021-07-08 Relisted — FMLS
- 2021-06-23 Pending — FMLS
- 2021-06-18 Pending — GAMLS
- 2021-06-18 Contingent — FMLS
- 2021-06-10 Listed $200,000 GAMLS
- 2021-06-10 Listed $200,000 FMLS
- 2019-10-18 Sold (Public Records) $191,000 Public Records
- 2019-10-17 Sold (MLS) $191,000 GAMLS
- 2019-10-17 Sold (MLS) $191,000 FMLS
- 2019-09-20 Pending — GAMLS
- 2019-09-20 Pending — FMLS
- 2019-09-05 Listed $195,900 GAMLS
- 2019-09-05 Listed $195,900 FMLS
- 2015-05-23 Price Changed $137,500 GAMLS
- 2015-05-08 Price Changed $137,500 FMLS
- 2015-05-08 Sold (Public Records) $137,500 Public Records
- 2015-05-07 Listing Removed — FMLS
- 2015-05-01 Sold (MLS) $137,500 GAMLS
- 2015-05-01 Sold (MLS) $137,500 FMLS
- 2015-05-01 Price Changed $144,900 FMLS
- 2015-04-29 Pending — GAMLS
- 2015-04-23 Contingent — FMLS
- 2015-04-22 Price Changed $144,900 GAMLS
- 2015-02-06 Listed $144,900 FMLS
- 2015-02-06 Listed $144,900 GAMLS
- 2012-05-30 Sold (Public Records) $47,000 Public Records
- 2012-05-22 Listing Removed — FMLS
- 2012-05-12 Sold (MLS) $47,000 FMLS
- 2012-01-31 Pending — FMLS
- 2012-01-05 Relisted — FMLS
- 2012-01-05 Price Changed $55,000 FMLS
- 2011-10-11 Pending — FMLS
- 2011-09-07 Listed $52,000 FMLS
Property tax history
+1.6%/yrLatest (2025): $3,368 · +121.9% YoY. Source: county tax records.
Cash-flow waterfall
monthlySold comps — $/sqft
last 12 mo · ≤1 miLoading sold comps…