 Duplex
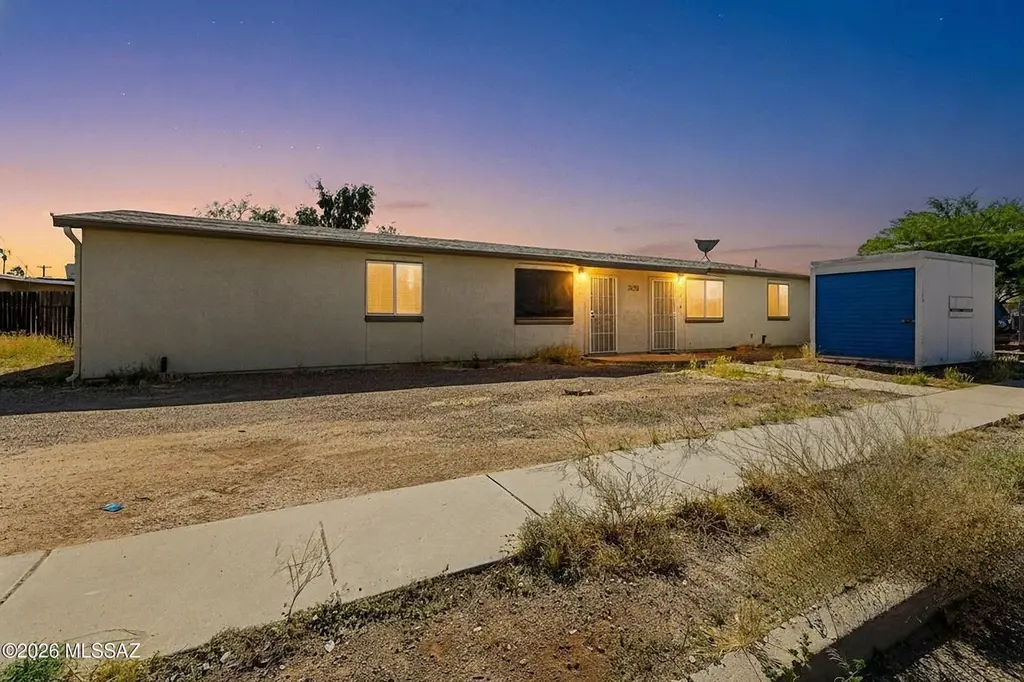
2039 S Sahuara Ave · Tucson, AZ
Flood risk 1/10 · Minimal
- FEMA flood zone
- X (unshaded)
- Chance of flooding over 30 yrs
- 0.0%
- Est. flood insurance / yr
- $507 – $1,088
Fire risk 1/10 · Minimal
- Est. fire insurance / yr
- $610 – $1,132
Heat risk 8/10 · Major
- Hot days now (above 105°F)
- 7 days/yr
- Hot days in 30 yrs
- 19 days/yr
Wind risk 1/10 · Minimal
- Chance of severe wind over 30 yrs
- —
Air-quality risk 1/10 · Minimal
- Unhealthy air days now
- 0 days/yr
- Unhealthy air days in 30 yrs
- 0 days/yr
Risk factors via First Street. Map © Google.
Why this score? — see what drove the D grade
The composite is a weighted blend of 9 inputs, each scored 0–100. Each bar is that input's sub-score; the figure is the points it added to the 100-point composite (weight × sub-score).
- Cash flow +14.3/30.0
- ARV discount +11.4/15.0
- DSCR +4.3/10.0
- Livability +3.7/5.0
- Rent growth +3.2/5.0
- 1% rule +3.0/10.0
- Condition / age +2.5/5.0
- Schools +1.6/10.0
- Appreciation +0.0/10.0
$299,000
🖨 Deal sheet (PDF) 📄 Offer letter ✓ Due diligence
Multi-family units
County records classify this as Multi-Family (2-4 Unit). Listing-text estimate: 2 units. confirmed
Listing remarks MLS
Well maintained duplex features one unit with 3 bedrooms/1 bath and other unit features 2 bedrooms/1 bath. 3 bedroom unit recently updated with new cabinets, counter tops, stove and dishwasher. Washer and dryers in each unit. Electric and water on separate meters. Close to DM AFB.
Key facts
- Espresso cabinetry
- In-unit laundry
- Recessed lighting
Tags
Property features AI
Finance
- Other: Zoned Pima County - CR1
- Financial info: 2 total units
Exterior
- Parking: 2 parking spaces total; Garage parking for each unit
- Utilities: Public water; Sewer connected
- Home design: Duplex; Single-story units; Both units furnished; Both units occupied
- Construction: Block and stucco construction; Built-Up and Rolled/Hot Mop roof
- Exterior features: Adjacent to alley; Paved road access; County-maintained road
Interior
- Kitchen: Refrigerator
- Bedrooms: Unit 1: 3 bedrooms (1st floor); Unit 2: 2 bedrooms (1st floor)
- Flooring: Carpet; Ceramic tile
- Bathrooms: Unit 1: 1 full bathroom; Unit 2: 1 full bathroom
- Heating & cooling: Natural gas heating; Has heating
- Interior features: Skylights
- Laundry & utility: Washer and dryer included
Neighborhood map
What this means for you Summary
Snapshot
- This is a 1×2bd/1.0ba + 1×3bd/1.0ba units multifamily listed at $299k.
Deal economics
- At list price, monthly cash flow is $52 ($626/yr) — positive. Per door: $26/mo.
- The deal already cash-flows at list — no discount required.
- To meet the 1% rule (rent ≥ 1% of price), the offer needs to be $239k (20.0% below list).
- Recommended offer: $239k (20.0% below list) — sets the bar for 1% rule.
- Cap rate 6.5% vs local median 3.7% in Tucson — top-decile yield for the area; either an underpriced asset or a hidden risk that comps aren't pricing in. Stress-test before assuming the spread holds.
Location & tenants
- Location reads 74/100 on livability (#17 in AZ, #4,502 nationally) — a middle-class / working-renter tenant base. Strengths: commute A+, cost of living A+, housing A+; Watch: health & safety C-, crime F, employment D-.
- Tucson Unified District (4403) (urban): math 14% / reading 23% proficiency, ranked #190 of 249 in AZ (top 76%) — low school quality limits family demand, transient renter base, plan for 1-2y turnover.
- Zoned schools: Wheeler Elementary School (math 22% / reading 32%, grade F, #600 of 1,109 statewide, top 56%, 416 students, 73% FRL); Ida Flood Dodge Traditional Middle Magnet School (math 27% / reading 32%, grade F, #84 of 218 statewide, top 41%, 396 students, 52% FRL); Palo Verde High Magnet School (math 8% / reading 12%, grade F, #343 of 381 statewide, top 93%, 691 students, 65% FRL) — zoned schools at 63% FRL track the district average.
- Market conditions: Rents rising (+2.6%/yr); 155 active listings in the ZIP; 22 comparable units currently listed for rent nearby; rentals lingering (median 46d on market — plan ~5-8 weeks vacancy on turnover, expect pricing pressure); 50% of comp listings sitting > 30 days — soft ceiling on asking rent; 5,268 units permitted in Pima County in 2024 (996 in 5+ unit buildings).
- At $2,392/mo this rent would consume 51% of the median local household income ($56k/yr) (locally 2616% of renters already pay >50% of income on rent) — very limited rent-growth headroom before tenants either downsize or default.
Forward outlook
- Local home prices are declining (-3.0%/yr); year-one equity from $2k of loan paydown is wiped out by about $9k of value loss. Plan a longer hold.
- Pima County population projected at +8% by 2050 — modest demand growth; plan on rents tracking national, not racing it.
Negotiation context
- It's been on market 61 days — a 6% lower offer ($281k) is reasonable based on typical stale-listing flexibility.
- 2 sale attempts since 6y ago; this cycle's ask has dropped $31k (9%) from the opening price — seller is motivated, your offer sets the floor, not the list.
- Current owner paid $219k; 37% above their basis — modest negotiation headroom, anchor on the comps not their cost.
Risks & watch-outs
- Climate carrying-cost: extreme-heat days projected 7→19/yr by 2055 (HVAC capex compounding) — expect insurance premiums to compound above CPI over the hold.
Questions for the listing agent
- It's been on market 61 days. Have you received any prior offers? Is the seller open to a 20% concession, seller financing, or rate buy-down credit?
- Can we see the unit-by-unit rent roll, current vacancy, and any below-market leases? What's the average tenancy length?
- What capital expenditures (roof, boiler, parking lot, exteriors) have been made in the last 5 years, and what's planned in the next 2?
- Why hasn't it sold? Are there any deal-killer items the seller is aware of (foundation, flood, title, zoning, code violations)?
- Is there a deadline driving the sale (1031 exchange, divorce, estate, relocation)? That informs how much negotiation room exists.
- Schools are D-rated, which usually means shorter tenancies and higher turnover. Who's the typical renter profile here, and what's been the actual vacancy rate?
- Crime grade is F in this area — have there been break-ins, vandalism, or insurance claims at this property in the last 3 years? What carrier currently insures it and at what premium?
- The area grade is low — what's the realistic commute time and amenity access for the typical tenant pool here? Any planned neighborhood developments (good or bad) we should know about?
- What's the average days-on-market for RENTAL listings here right now (not sales)? A rising rental-DOM trend means longer vacancies and softer asking-rent achievability than the comps imply.
- What's the recent tenant-quality profile in this submarket — average credit score on applications, eviction rate, late-payment / NSF rate, and stable-employment percentage? A property-management company in the area should have these aggregated.
- How much new apartment / multifamily construction is in the pipeline within 1–3 miles? Heavy new supply (>2% of stock underway) typically softens rents 12–24 months out; light construction supports rent growth.
Investment metrics
- 1% rule
- 0.80% ✗
- Cap rate
- 6.50%
- Cash-on-cash
- 0.75%
- DSCR
- 1.03
- GRM
- 10.4
CMA / ARV
- ARV (median comp)
- $327,099
- List price
- $299,000
- Delta
- -8.59%
- Verdict
- FAIR
- Comps
- 13 within 1.0 mi
Projected returns pro-forma
-3.0% appreciation · 2.61% rent growth · sell at horizon
- IRR
- -15.5%
- Equity multiple
- 0.45×
- Total profit
- $-46,166
- Equity at exit
- $44,582
- IRR
- -7.7%
- Equity multiple
- 0.52×
- Total profit
- $-40,151
- Equity at exit
- $25,852
Cash invested: $83,720 (down + closing). Projections, not guarantees.
Landlord ↔ Tenant lean methodology
- Overall (STATE)
- 87 Strongly Landlord-Friendly
- State Arizona
- 87 Strongly Landlord-Friendly · R+3
- County
- — inherits STATE
- City
- — inherits STATE
ZIP-level market 85711
- Rents YoY
- 2.6%
- Active inventory
- 155
- Price-to-rent
- 22.5×
Monthly cashflow live
- Estimated rent
- $2,392 high interval (Pro) →
- Mortgage (P&I)
- −$1,568
- Tax from tax record
- −$145 /mo · $1,739/yr
- Insurance
- −$125
- HOA
- −$0
- Vacancy / Maint / Mgmt
- −$502
- Net cashflow
- $52
Break-even live
Sensitivity live
| Price | -10% $221 | -5% $137 | +0% $52 | +5% $-32 | +10% $-117 |
|---|---|---|---|---|---|
| Rent | -10% $-137 | -5% $-42 | +0% $52 | +5% $147 | +10% $241 |
| Rate | -1.0pp $203 | -0.5pp $128 | base $52 | +0.5pp $-25 | +1.0pp $-104 |
2-unit breakdown (identical units grouped — click to expand)
| Units | Beds | Baths | Est. rent |
|---|---|---|---|
| 1× unit | 2 | 1 | $1,110 |
| 1× unit | 3 | 1 | $1,282 |
| Total (2 units) | $2,392 | ||
UW: 25.0% down · 7.5% · 30yr · 1.5% tax · 5.0% vac · 8.0% maint · 8.0% mgmt
Financing live
Cash to close
- Down payment
- $74,750
- Closing costs
- $8,970
- Reserves months
- —
- Total cash needed
- —
Loan-product check · same deal, 3 products live
Conventional
25% down · 7.5% · 30yr
- Down + closing
- —
- Monthly P&I
- —
- Monthly cashflow
- —
- DSCR
- —
- Eligible?
- —
Personal DTI + credit; lowest rate.
DSCR
20% down · 8.5% · 30yr
- Down + closing
- —
- Monthly P&I
- —
- Monthly cashflow
- —
- DSCR
- —
- Eligible?
- —
No personal income docs; deal must DSCR.
Hard money
10% down · 12.0% · 12mo
- Down + closing
- —
- Monthly P&I
- —
- Monthly cashflow
- —
- DSCR
- —
- Eligible?
- —
Short-term bridge; refi at stabilization.
Rent comps 22 comps
| Address | Beds | Baths | Sqft | Rent | $/sqft | DOM | Units | Dist |
|---|---|---|---|---|---|---|---|---|
| 1868 S Poetry Ln Tucson, AZ | 3.0 | 2.5 | 1624 | $1,925 | $1.19 | 45d | 1 | 0.15mi |
| 1833 S Poetry Ln Tucson, AZ | 3.0 | 2.0 | 1500 | $1,850 | $1.23 | 45d | 1 | 0.19mi |
| 6158 E 31st St Tucson, AZ | 3.0 | 2.0 | 1414 | $1,800 | $1.27 | 45d | 1 | 0.34mi |
| 5962 E 25th St Tucson, AZ | 3.0 | 2.0 | 1830 | $2,050 | $1.12 | 45d | 1 | 0.39mi |
| 5402 E 30th St Apt E1 Tucson, AZ | 4.0 | 1.5 | 1400 | $1,530 | $1.09 | 45d | 1 | 0.62mi |
| 1641 S Cloverland Ave Tucson, AZ | 3.0 | 2.0 | 1600 | $1,760 | $1.10 | 5d | 1 | 0.87mi |
| 6539 E Golf Links Rd Tucson, AZ | 3.0 | 2.0 | 1805 | $1,500 | $0.83 | 45d | 1 | 0.91mi |
| 6479 E Nelson Dr Tucson, AZ | 3.0 | 2.0 | 1567 | $1,695 | $1.08 | 18d | 1 | 0.94mi |
| 6442 E Mary Dr Tucson, AZ | 4.0 | 2.0 | 1567 | $1,800 | $1.15 | 5d | 1 | 0.96mi |
| 1702 S Avenida del Sol Tucson, AZ | 3.0 | 2.0 | 1697 | $1,845 | $1.09 | 45d | 1 | 0.97mi |
| 5674 E Eastland St Tucson, AZ | 3.0 | 2.0 | 1431 | $1,645 | $1.15 | 45d | 1 | 0.97mi |
| 5624 E 18th St Tucson, AZ | 3.0 | 2.0 | 1458 | $2,300 | $1.58 | 21d | 1 | 1.05mi |
| 6222 E Eli St Tucson, AZ | 3.0 | 2.0 | 1600 | $1,600 | $1.00 | 25d | 1 | 1.05mi |
| 1051 S Duke Dr Tucson, AZ | 3.0 | 1.0 | 1400 | $1,595 | $1.14 | 21d | 1 | 1.06mi |
| 8090 Ironwood St Tucson, AZ | 2.0–4.0 | 1.0–2.5 | 1638 | $3,000 | $1.83 | 13d | 1 | 1.12mi |
| 2020 S Avenida Ursa Tucson, AZ | 4.0 | 2.0 | 1500 | $1,795 | $1.20 | 45d | 1 | 1.19mi |
| 2161 S Avenida Planeta Tucson, AZ | 4.0 | 2.0 | 1895 | $1,845 | $0.97 | 4d | 1 | 1.35mi |
| 501 S Harvard Ave Tucson, AZ | 4.0 | 2.0 | 1900 | $2,400 | $1.26 | 18d | 1 | 1.38mi |
| 7033 E Calle Orion Tucson, AZ | 4.0 | 2.0 | 1533 | $1,795 | $1.17 | 45d | 1 | 1.40mi |
| 7033 E Calle Canis Tucson, AZ | 4.0 | 2.0 | 1626 | $1,650 | $1.01 | 16d | 1 | 1.40mi |
| 7058 E Calle Betelgeux Tucson, AZ | 4.0 | 2.0 | 1625 | $1,795 | $1.10 | 45d | 1 | 1.45mi |
| 525 S Rosemont Ave Tucson, AZ | 4.0 | 2.0 | 1410 | $1,795 | $1.27 | 17d | 1 | 1.46mi |
Listing history 21 events
-
2026-06-21days on market $299,000 Active 61 DOM
-
2026-06-18days on market $299,000 Active 58 DOM
-
2026-06-17days on market $299,000 Active 57 DOM
-
2026-06-16days on market $299,000 Active 56 DOM
-
2026-06-15days on market $299,000 Active 55 DOM
-
2026-06-13days on market $299,000 Active 53 DOM
-
2026-06-10days on market $299,000 Active 50 DOM
-
2026-06-09days on market $299,000 Active 49 DOM
-
2026-06-08days on market $299,000 Active 48 DOM
-
2026-06-07days on market $299,000 Active 47 DOM
-
2026-06-05days on market $299,000 Active 44 DOM
-
2026-06-03days on market $299,000 Active 43 DOM
-
2026-06-02days on market $299,000 Active 42 DOM
-
2026-06-01days on market $299,000 Active 41 DOM
-
2026-05-31days on market $299,000 Active 40 DOM
-
2026-05-12price $299,000 735-char remark
-
2026-04-21$330,000 Active 735-char remark
-
2020-06-29soldstatus $219,000 Closed 282-char remark
Show marketing remark (282 chars)
Well maintained duplex features one unit with 3 bedrooms/1 bath and other unit features 2 bedrooms/1 bath. 3 bedroom unit recently updated with new cabinets, counter tops, stove and dishwasher. Washer and dryers in each unit. Electric and water on separate meters. Close to DM AFB.
-
2020-06-29soldstatus $219,000
Show marketing remark (282 chars)
Well maintained duplex features one unit with 3 bedrooms/1 bath and other unit features 2 bedrooms/1 bath. 3 bedroom unit recently updated with new cabinets, counter tops, stove and dishwasher. Washer and dryers in each unit. Electric and water on separate meters. Close to DM AFB.
-
2020-04-19historical Active Contingent 282-char remark
Show marketing remark (282 chars)
Well maintained duplex features one unit with 3 bedrooms/1 bath and other unit features 2 bedrooms/1 bath. 3 bedroom unit recently updated with new cabinets, counter tops, stove and dishwasher. Washer and dryers in each unit. Electric and water on separate meters. Close to DM AFB.
-
2020-04-11$219,000 Active 282-char remark
Show marketing remark (282 chars)
Well maintained duplex features one unit with 3 bedrooms/1 bath and other unit features 2 bedrooms/1 bath. 3 bedroom unit recently updated with new cabinets, counter tops, stove and dishwasher. Washer and dryers in each unit. Electric and water on separate meters. Close to DM AFB.
ⓘ Source: listings_history table (triggers on properties + properties_extension) + one-shot
backfill from property_details.listing_events for pre-trigger history.
Tax reassessment forecast AZ · Resets to sale price
- Current annual tax
- $1,739 · $145/mo
- Projected year-2 tax
- $1,973 · $164/mo
- Expected delta
- +$234/yr (+$20/mo · 13.5%)
ⓘ Screening estimate from a state-policy table — verify with the county assessor before closing.
Climate risk First Street
- Flood 1/10 Low FEMA zone X (unshaded) · 0% chance over 30 yrs
- Wildfire 1/10 Low
- Heat 8/10 Severe 7 d/yr ≥105°F today · 19 d/yr by 30 yrs out
- Wind 1/10 Low
- Air quality 1/10 Low 0 unhealthy d/yr today · 0 by 30 yrs out
Nearby sold comps map
Loading sold comps map…
Walkable amenities ~0.75 mi
Loading nearby amenities…
Taxation est. · year 1
- Rental income
- $28,704
- − Mortgage interest
- −$16,749
- − Property taxes
- −$1,739
- − Insurance
- −$1,495
- − Repairs & maintenance
- −$2,296
- − Management
- −$2,296
- − Depreciation
- −$8,698
- Taxable loss
- −$4,569
- Est. tax savings @ 24.0%
- +$1,097
- After-tax cash flow
- $1,723/yr
For passive investors: Depreciation is non-cash, so a rental often shows a tax loss while cash-flowing — sheltering income. Rental losses are passive: they offset passive income freely, and up to $25,000/yr can offset ordinary (W-2) income if you actively participate and your MAGI is under $100k (phasing out to $0 by $150k); unused losses carry forward. On sale, claimed depreciation is recaptured at up to 25%, and gains may owe capital-gains tax (a 1031 exchange can defer both). Figures are a year-1 estimate at your 24.0% rate — not tax advice; consult a CPA.
Schools (NCES district)
- District
- Tucson Unified District (4403)
- NCES district ID
- 0408800
- Math proficiency
- 14% ▼ -17.00%
- Reading proficiency
- 23% ▼ -11.00%
- Median HH income
- $40,962
- Composite
- 15.78/100
- National rank
- #9270
- State rank
- #190 of 249 in AZ
Livability — Tucson
- Score
- 74/100
- State rank
- #17
- US rank
- #4502
Category grades
Schools grade is shown separately in the Schools card above.
Census & demographics
- Census place
- Tucson, AZ
- County
- Pima County · 1,012,107 people
- City population
- 839,336
- Metro
- Tucson, AZ
- Population (ZIP)
- 42,558
- Household income
- $56,121
- Rent vs Own
- Severe rent burden
- 2616.0
Population outlook (Pima County) Hauer SSP2
- Today (2025)
- 1,066,056 people
- By 2030
- 1,086,684 · +1.9%
- By 2040
- 1,117,160 · +4.8%
- By 2050
- 1,149,778 · +7.9%
- By 2075
- 1,271,480 · +19.3%
- By 2100
- 1,321,160 · +23.9%
Race, ethnicity, and origin ACS 2023
- Neighborhood character
- Diverse neighborhood (Simpson 0.64)
- Race & ethnicity
- White 45% Hispanic / Latino 39% Two or more races 21% Black 6% Asian 3% Native American 3%
- Hispanic origin (detail)
- Mexican 36%
- Common ancestry
- Lithuanian 2% Romanian 2% Italian 2%
- Foreign-born
- 12% · Canada, China, Vietnam
- Languages at home
- 75% English-only · Spanish 19% Other Indo-European 1% Other Asian/Pacific 1%
Political lean MEDSL · Pima
- 2024 margin
- D (+15.2) · D 57.0% · R 41.8% · Other 1.2%
- 2008→2024 swing
- +9.1pp toward D · 2008: 6.1pp · 2024: 15.2pp
- All cycles
- 2024: D+15.2 2020: D+18.7 2016: D+13.5 2012: D+5.8 2008: D+6.1
Not yet ingested
- Civics
- —
Market trends
- HPI YoY
- ▼ -368.96%
- Current HPI
- 285.6805
- Rent YoY
- ▲ 2.61%
- Metro
- Tucson, AZ
- State GDP YoY
- ▲ 4.54%
- F500 in state
- 20
Industry mix (Fortune 500 HQ in AZ)
| Industry | F500 HQs | Revenue |
|---|---|---|
| Technology | 2 | $13B |
|
||
| Mining / Metals | 1 | $23B |
|
||
| Environmental Services | 1 | $16B |
|
||
| Metals / Steel | 1 | $14B |
|
||
| Technology Distribution | 1 | $9B |
|
||
| Homebuilding | 1 | $8B |
|
||
Price history
+36.5% since first listed6 events — show timeline
- 2026-05-12 Price Changed $299,000 MLSSAZ
- 2026-04-21 Listed $330,000 MLSSAZ
- 2020-06-29 Sold (Public Records) $219,000 Public Records
- 2020-06-29 Sold (MLS) $219,000 MLSSAZ
- 2020-04-19 Contingent — MLSSAZ
- 2020-04-11 Listed $219,000 MLSSAZ
Property tax history
+1.7%/yrLatest (2025): $1,739 · -8.1% YoY. Source: county tax records.
Cash-flow waterfall
monthlySold comps — $/sqft
last 12 mo · ≤1 miLoading sold comps…