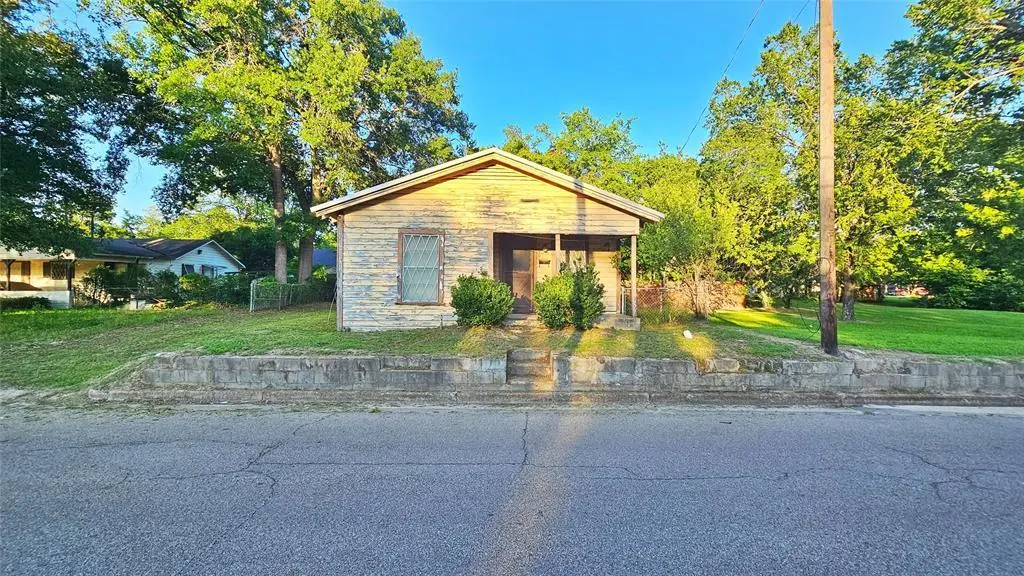
300 Carter St · Sulphur Springs, TX
Flood risk 1/10 · Minimal
- FEMA flood zone
- X (unshaded)
- Chance of flooding over 30 yrs
- 0.0%
- Est. flood insurance / yr
- $507 – $1,088
Fire risk 4/10 · Minor
- Est. fire insurance / yr
- $1,222 – $2,270
Heat risk 7/10 · Major
- Hot days now (above 109°F)
- 7 days/yr
- Hot days in 30 yrs
- 24 days/yr
Wind risk 6/10 · Moderate
- Chance of severe wind over 30 yrs
- 27.0%
Air-quality risk 2/10 · Minimal
- Unhealthy air days now
- 0 days/yr
- Unhealthy air days in 30 yrs
- 1 days/yr
Risk factors via First Street. Map © Google.
Why this score? — see what drove the B- grade
The composite is a weighted blend of 9 inputs, each scored 0–100. Each bar is that input's sub-score; the figure is the points it added to the 100-point composite (weight × sub-score).
- Cash flow +30.0/30.0
- 1% rule +10.0/10.0
- DSCR +10.0/10.0
- ARV discount +7.5/15.0
- Schools +3.6/10.0
- Livability +3.5/5.0
- Rent growth +2.5/5.0
- Condition / age +2.5/5.0
- Appreciation +0.0/10.0
$59,500
🖨 Deal sheet 📄 Offer letter ✓ Due diligence
Listing remarks
ATTENTION INVESTORS! This diamond in the rough is priced well below the Tax Assessed Value. Located close to Downtown Sulphur Springs and the newly revamped Pacific Park. Ideal for a quick fix and flip or renovate and keep for rental income.
Key facts
- Pacific park
- 8,015 sq ft lot
- Built 1946
Tags
Property features AI
Finance
- Other: Lot less than 0.5 acre (approx. 0.184 acre); No horse permitted; Will not subdivide
- Financial info: Loan type: Treat as clear; No second mortgage
- HOA & community: No association
Exterior
- Parking: Covered parking for 1 vehicle; Driveway
- Utilities: City water; City sewer; Cable available; Individual gas meter
- Home design: Single-family residence; One story; Residential property
- Construction: Metal roof; Built in 1946
- Exterior features: Easement for utilities; Asphalt access/driveway
Interior
- Kitchen: Appliances: Other
- Bedrooms: 3 bedrooms on the main level (including primary bedroom on main level)
- Bathrooms: 1 full bathroom
- Interior features: Cable TV available; High-speed internet available; One living area; One dining area; Total of 5 rooms
- Laundry & utility: Individual gas meter
Neighborhood map
What this means for you Summary
Snapshot
- This is a 3-bed/1.0-bath single-family listed at $60k.
Deal economics
- At list price, monthly cash flow is $1k ($14k/yr) — positive.
- The deal already cash-flows at list — no discount required.
- Meets the 1% rule at list price ($2k rent vs $60k).
- Cap rate 29.3% vs local median 4.3% in Sulphur Springs — top-decile yield for the area; either an underpriced asset or a hidden risk that comps aren't pricing in. Stress-test before assuming the spread holds.
Location & tenants
- Location reads 70/100 on livability (#350 in TX) — a middle-class / working-renter tenant base. Strengths: cost of living A+, housing A+, crime A; Watch: employment D+, schools D, amenities F.
- Sulphur Springs ISD (town): math 46% / reading 40% proficiency, ranked #323 of 826 in TX (top 39%) — families likely to look elsewhere, expect single-tenant / working-renter base with shorter leases.
- Market conditions: 378 active listings in the ZIP; 3 comparable units currently listed for rent nearby; rentals lingering (median 44d on market — plan ~5-8 weeks vacancy on turnover, expect pricing pressure); 100% of comp listings sitting > 30 days — soft ceiling on asking rent; 66 units permitted in Hopkins County in 2024 (0 in 5+ unit buildings).
- This rent runs 35% of the median local income ($70k/yr) — at the standard rent-burdened threshold; future hikes will face affordability resistance.
Forward outlook
- Local home prices are declining (-3.0%/yr); year-one equity from $411 of loan paydown is wiped out by about $2k of value loss. Plan a longer hold.
- Hopkins County population projected at +6% by 2050 — modest demand growth; plan on rents tracking national, not racing it.
- At projected returns (-3.0% appreciation + 3.0% rent growth), your $17k cash investment doubles in ~2 years — after that, you're playing with house money.
Negotiation context
- Only 2 days on market — expect competitive offers; lowballing is unlikely to land.
Risks & watch-outs
- Watch-outs: built in 1946 — expect roof / HVAC / electrical / plumbing capex.
- Climate carrying-cost: major wind risk, 27% chance of damaging wind over 30y; extreme-heat days projected 7→24/yr by 2055 (HVAC capex compounding) — expect insurance premiums to compound above CPI over the hold.
Questions for the listing agent
- Built in 1946 — when were the roof, HVAC, electrical panel, plumbing, and water heater last replaced?
- Is there a deadline driving the sale (1031 exchange, divorce, estate, relocation)? That informs how much negotiation room exists.
- Schools are D-rated, which usually means shorter tenancies and higher turnover. Who's the typical renter profile here, and what's been the actual vacancy rate?
- What's the average days-on-market for RENTAL listings here right now (not sales)? A rising rental-DOM trend means longer vacancies and softer asking-rent achievability than the comps imply.
- What's the recent tenant-quality profile in this submarket — average credit score on applications, eviction rate, late-payment / NSF rate, and stable-employment percentage? A property-management company in the area should have these aggregated.
- How much new for-sale + rental construction is in the pipeline within 1–3 miles? Heavy new supply typically softens prices + rents 12–24 months out; constrained supply supports both.
Investment metrics
- 1% rule
- 3.39% ✓
- Cap rate
- 29.26%
- Cash-on-cash
- 82.03%
- DSCR
- 4.65
- GRM
- 2.5
CMA / ARV
- ARV (on-the-fly)
- $133,826
- Comps found
- 7
Show comp detail 7 sales within ~0.75 mi
| Address | Dist | Beds/Ba | Sqft | Sold | Price | $/sf | Match |
|---|---|---|---|---|---|---|---|
| 130 Jackson St N | 0.34mi | 2/1.0 (-1) | 872 (+3%) | 7mo | $137,900 | $158 | 68 |
| 312 Calvert St | 0.22mi | 3/2.0 | 841 (-1%) | 23mo | $169,000 | $201 | 65 |
| 814 Freeman St | 0.28mi | 2/1.0 (-1) | 750 (-12%) | 6mo | $119,900 | $160 | 57 |
| 211 Weaver Dr | 0.34mi | 2/1.0 (-1) | 780 (-8%) | 13mo | $132,000 | $169 | 55 |
| 207 Whitworth St | 0.61mi | 2/1.0 (-1) | 872 (+3%) | 11mo | $125,000 | $143 | 53 |
| 318 Beckham St W | 0.40mi | 2/1.0 (-1) | 970 (+14%) | 10mo | $59,900 | $62 | 44 |
| 611 Lamar St | 0.45mi | 2/1.0 (-1) | 725 (-14%) | 17mo | $109,000 | $150 | 36 |
Match score weights: distance 35% · size 25% · config 20% · recency 20%. Top-matched comps best support the ARV.
Projected returns pro-forma
-3.0% appreciation · 3.0% rent growth · sell at horizon
- IRR
- 82.3%
- Equity multiple
- 4.78×
- Total profit
- $62,951
- Equity at exit
- $8,872
- IRR
- 85.7%
- Equity multiple
- 9.91×
- Total profit
- $148,453
- Equity at exit
- $5,144
Cash invested: $16,660 (down + closing). Projections, not guarantees.
Landlord ↔ Tenant lean methodology
- Overall (STATE)
- 87 Strongly Landlord-Friendly
- State Texas
- 87 Strongly Landlord-Friendly · R+5
- County
- — inherits STATE
- City
- — inherits STATE
ZIP-level market 75482
- Active inventory
- 378
- Price-to-rent
- 2.5×
Monthly cashflow live
- Estimated rent
- $2,019 medium interval (Pro) →
- Mortgage (P&I)
- −$312
- Tax from tax record
- −$119 /mo · $1,434/yr
- Insurance
- −$25
- HOA
- −$0
- Vacancy / Maint / Mgmt
- −$424
- Net cashflow
- $1,139
Break-even live
UW: 25.0% down · 7.5% · 30yr · 1.5% tax · 5.0% vac · 8.0% maint · 8.0% mgmt
Financing live
Cash to close
- Down payment
- $14,875
- Closing costs
- $1,785
- Reserves months
- —
- Total cash needed
- —
Loan-product check · same deal, 3 products live
Conventional
25% down · 7.5% · 30yr
- Down + closing
- —
- Monthly P&I
- —
- Monthly cashflow
- —
- DSCR
- —
- Eligible?
- —
Personal DTI + credit; lowest rate.
DSCR
20% down · 8.5% · 30yr
- Down + closing
- —
- Monthly P&I
- —
- Monthly cashflow
- —
- DSCR
- —
- Eligible?
- —
No personal income docs; deal must DSCR.
Hard money
10% down · 12.0% · 12mo
- Down + closing
- —
- Monthly P&I
- —
- Monthly cashflow
- —
- DSCR
- —
- Eligible?
- —
Short-term bridge; refi at stabilization.
Rent comps 3 comps
| Address | Beds | Baths | Sqft | Rent | $/sqft | DOM | Units | Dist |
|---|---|---|---|---|---|---|---|---|
| 709 Fuller St Sulphur Springs, TX | 3.0 | 2.0 | 1100 | $2,200 | $2.00 | 43d | 1 | 0.18mi |
| 325 League St S Sulphur Springs, TX | 3.0 | 1.0 | 1112 | $2,000 | $1.80 | 43d | 1 | 1.37mi |
| 210 Duckworth St Sulphur Springs, TX | 1.0–2.0 | 1.0 | 700 | $1,000 | $1.43 | 43d | 2 | 1.49mi |
Listing history 3 events
-
2026-06-19days on market $59,500 Active 2 DOM
-
2026-06-18remarks 241-char remark
-
2026-06-18$59,500 Active 1 DOM
ⓘ Source: listings_history table (triggers on properties + properties_extension) + one-shot
backfill from property_details.listing_events for pre-trigger history.
Tax reassessment forecast TX · Resets to sale price
- Current annual tax
- $1,434 · $119/mo
- Projected year-2 tax
- $1,434 · $119/mo
- Expected delta
- $0/yr ($0/mo · 0.0%)
ⓘ Screening estimate from a state-policy table — verify with the county assessor before closing.
Climate risk First Street
- Flood 1/10 Low FEMA zone X (unshaded) · 0% chance over 30 yrs
- Wildfire 4/10 Moderate
- Heat 7/10 Severe 7 d/yr ≥109°F today · 24 d/yr by 30 yrs out
- Wind 6/10 Major 27% chance of damaging wind over 30 yrs
- Air quality 2/10 Low 0 unhealthy d/yr today · 1 by 30 yrs out
Nearby sold comps map
Loading sold comps map…
Walkable amenities ~0.75 mi
Loading nearby amenities…
Taxation est. · year 1
- Rental income
- $24,230
- − Mortgage interest
- −$3,333
- − Property taxes
- −$1,434
- − Insurance
- −$298
- − Repairs & maintenance
- −$1,938
- − Management
- −$1,938
- − Depreciation
- −$1,731
- Taxable income
- $13,558
- Est. tax owed @ 24.0%
- −$3,254
- After-tax cash flow
- $10,412/yr
For passive investors: Depreciation is non-cash, so a rental often shows a tax loss while cash-flowing — sheltering income. Rental losses are passive: they offset passive income freely, and up to $25,000/yr can offset ordinary (W-2) income if you actively participate and your MAGI is under $100k (phasing out to $0 by $150k); unused losses carry forward. On sale, claimed depreciation is recaptured at up to 25%, and gains may owe capital-gains tax (a 1031 exchange can defer both). Figures are a year-1 estimate at your 24.0% rate — not tax advice; consult a CPA.
Schools (NCES district)
- District
- Sulphur Springs ISD
- NCES district ID
- 4841820
- Math proficiency
- 46% ▼ -7.00%
- Reading proficiency
- 40% ▼ -4.00%
- Median HH income
- $42,871
- Composite
- 36.33/100
- National rank
- #4692
- State rank
- #323 of 826 in TX
Livability — Sulphur Springs
- Score
- 70/100
- State rank
- #350
- US rank
- #7665
Category grades
Schools grade is shown separately in the Schools card above.
Census & demographics
- Census place
- Sulphur Springs, TX
- County
- Hopkins County · 26,483 people
- City population
- 26,483
- Metro
- Sulphur Springs, TX
- Population (ZIP)
- 26,483
- Household income
- $69,970
- Rent vs Own
- Severe rent burden
- 543.0
Population outlook (Hopkins County) Hauer SSP2
- Today (2025)
- 38,107 people
- By 2030
- 38,867 · +2.0%
- By 2040
- 40,009 · +5.0%
- By 2050
- 40,448 · +6.1%
- By 2075
- 40,669 · +6.7%
- By 2100
- 37,234 · -2.3%
Race, ethnicity, and origin ACS 2023
- Neighborhood character
- Predominantly White (70%)
- Race & ethnicity
- White 70% Hispanic / Latino 17% Black 9% Two or more races 7% Asian 1%
- Hispanic origin (detail)
- Mexican 15%
- Common ancestry
- Slovak 2% Lithuanian 2% Iranian 1%
- Foreign-born
- 9% · Canada, Vietnam
- Languages at home
- 84% English-only · Spanish 14% Vietnamese 1%
Political lean MEDSL · Hopkins
- 2024 margin
- Solid R (+64.6) · D 17.4% · R 82.0%
- 2008→2024 swing
- -20.0pp toward R · 2008: -44.7pp · 2024: -64.6pp
- All cycles
- 2024: R+64.6 2020: R+60.7 2016: R+60.8 2012: R+55.4 2008: R+44.7
Not yet ingested
- Civics
- —
Market trends
- HPI YoY
- ▼ -125.79%
- Current HPI
- 156.0526
- Rent YoY
- —
- Metro
- Sulphur Springs, TX
- State GDP YoY
- ▲ 3.95%
- F500 in state
- 110
Industry mix (Fortune 500 HQ in TX)
| Industry | F500 HQs | Revenue |
|---|---|---|
| Energy | 16 | $1,198B |
|
||
| Technology | 5 | $198B |
|
||
| Engineering / Construction | 4 | $72B |
|
||
| Energy Services | 3 | $60B |
|
||
| Utilities | 3 | $41B |
|
||
| Healthcare | 2 | $330B |
|
||
Price history
1 event — show timeline
- 2026-06-17 Listed $59,500 NTREIS
Property tax history
+10.1%/yrLatest (2025): $1,434 · +4.7% YoY. Source: county tax records.
Cash-flow waterfall
monthlySold comps — $/sqft
last 12 mo · ≤1 miLoading sold comps…