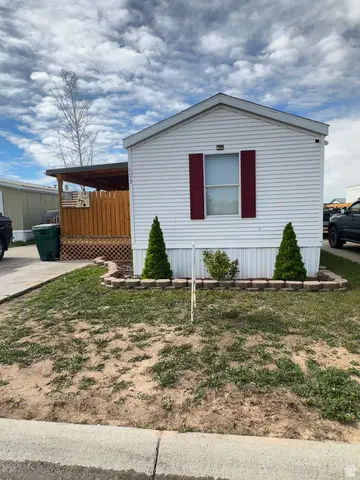
150 E 750 N #103 · Vernal, UT
Flood risk 1/10 · Minimal
- FEMA flood zone
- X (unshaded)
- Chance of flooding over 30 yrs
- 0.0%
- Est. flood insurance / yr
- $507 – $1,088
Fire risk 6/10 · Moderate
- Est. fire insurance / yr
- $453 – $841
Heat risk 3/10 · Minor
- Hot days now (above 92°F)
- 7 days/yr
- Hot days in 30 yrs
- 19 days/yr
Wind risk 1/10 · Minimal
- Chance of severe wind over 30 yrs
- —
Air-quality risk 3/10 · Minor
- Unhealthy air days now
- 3 days/yr
- Unhealthy air days in 30 yrs
- 3 days/yr
Risk factors via First Street. Map © Google.
Why this score? — see what drove the B grade
The composite is a weighted blend of 9 inputs, each scored 0–100. Each bar is that input's sub-score; the figure is the points it added to the 100-point composite (weight × sub-score).
- Cash flow +30.0/30.0
- 1% rule +10.0/10.0
- DSCR +10.0/10.0
- ARV discount +7.5/15.0
- Condition / age +4.0/5.0
- Livability +3.8/5.0
- Rent growth +3.5/5.0
- Schools +3.1/10.0
- Appreciation +0.0/10.0
$85,000
🖨 Deal sheet 📄 Offer letter ✓ Due diligence
Listing remarks
Check out this well- maintained single wide mobile home offering comfort and functionality. Enjoy a well built spacious covered and gated porch. Yard that is already fenced will be great for pets. Inside, fresh paint and stylish LVP flooring throughout the main living space. The open concept kitchen, dining area flows seamlessly into a family room, perfect for hosting guests. With 3 bedrooms and 2 bathroom. It is a great opportunity for affordable living with thoughtful updates already in place. Lot rent $600. Square footage and property details are an estimate. Buyer is to verify all info.
Key facts
- Covered porch
- Open concept kitchen
- Fresh paint
Tags
Property features AI
Finance
- Financial info: Annual tax amount reported
Exterior
- Parking: Driveway / on-site parking (implied)
- Utilities: Natural gas connected; Electricity connected; Water connected (culinary); Sewer connected
- Home design: Mobile home; Faces east; Residential use
- Construction: Aluminum exterior; Asphalt roof; Built and currently standing
- Exterior features: Covered deck; Partially fenced yard; Paved road access; Storage shed(s)
Interior
- Kitchen: Refrigerator; Gas range / free-standing range/oven
- Bedrooms: Three main-level bedrooms
- Flooring: Carpet; Laminate
- Bathrooms: One full bathroom; One three-quarter bathroom
- Heating & cooling: Forced air heating (gas central); Central air conditioning
- Interior features: Updated kitchen; Garbage disposal; Range hood; Full blinds; Skylights
- Laundry & utility: Electric dryer hookup
Neighborhood map
What this means for you Summary
Snapshot
- This is a 3-bed/2.0-bath manufactured listed at $85k. Condition is rated good.
Deal economics
- At list price, monthly cash flow is $647 ($8k/yr) — positive.
- The deal already cash-flows at list — no discount required.
- Meets the 1% rule at list price ($2k rent vs $85k).
- Recommended offer: $82k (3.0% below list) — sets the bar for market timing.
Location & tenants
- Location reads 75/100 on livability (#60 in UT, #3,813 nationally) — a middle-class / working-renter tenant base. Strengths: commute A+, cost of living A+, amenities A; Watch: crime D+, health & safety D+, employment F.
- Uintah District (town): math 34% / reading 34% proficiency, ranked #60 of 80 in UT (top 75%) — families likely to look elsewhere, expect single-tenant / working-renter base with shorter leases.
- Zoned schools: Ashley School (math 32% / reading 18%, grade F, #472 of 585 statewide, top 81%, 517 students, 58% FRL); Uintah Middle School (math 37% / reading 42%, grade F, #75 of 138 statewide, top 56%, 669 students, 40% FRL); Uintah High (math 18% / reading 36%, grade F, #131 of 171 statewide, top 79%, 1,808 students, 31% FRL).
- Market conditions: Rents rising fast (+4.1%/yr); 276 active listings in the ZIP; solid renter incomes; 85 units permitted in Uintah County in 2024 (0 in 5+ unit buildings).
Forward outlook
- Local home prices are declining (-3.0%/yr); year-one equity from $588 of loan paydown is wiped out by about $3k of value loss. Plan a longer hold.
- Uintah County population projected at +72% by 2050 — long-run rental-demand tailwind backs the buy-and-hold thesis.
- At projected returns (-3.0% appreciation + 4.1% rent growth), your $24k cash investment doubles in ~4 years — after that, you're playing with house money.
Negotiation context
- It's been on market 41 days — a 3% lower offer ($82k) is reasonable based on typical stale-listing flexibility.
Risks & watch-outs
- Climate carrying-cost: major wildfire risk — expect insurance premiums to compound above CPI over the hold.
Questions for the listing agent
- It's been on market 41 days. Have you received any prior offers? Is the seller open to a 3% concession, seller financing, or rate buy-down credit?
- Is there a deadline driving the sale (1031 exchange, divorce, estate, relocation)? That informs how much negotiation room exists.
- Schools are D-rated, which usually means shorter tenancies and higher turnover. Who's the typical renter profile here, and what's been the actual vacancy rate?
- Crime grade is D in this area — have there been break-ins, vandalism, or insurance claims at this property in the last 3 years? What carrier currently insures it and at what premium?
- What's the average days-on-market for RENTAL listings here right now (not sales)? A rising rental-DOM trend means longer vacancies and softer asking-rent achievability than the comps imply.
- What's the recent tenant-quality profile in this submarket — average credit score on applications, eviction rate, late-payment / NSF rate, and stable-employment percentage? A property-management company in the area should have these aggregated.
- How much new for-sale + rental construction is in the pipeline within 1–3 miles? Heavy new supply typically softens prices + rents 12–24 months out; constrained supply supports both.
Investment metrics
- 1% rule
- 1.84% ✓
- Cap rate
- 15.42%
- Cash-on-cash
- 32.60%
- DSCR
- 2.45
- GRM
- 4.5
CMA / ARV
No comps found within radius.
Projected returns pro-forma
-3.0% appreciation · 4.07% rent growth · sell at horizon
- IRR
- 28.9%
- Equity multiple
- 2.22×
- Total profit
- $29,130
- Equity at exit
- $12,674
- IRR
- 36.9%
- Equity multiple
- 4.60×
- Total profit
- $85,617
- Equity at exit
- $7,349
Cash invested: $23,800 (down + closing). Projections, not guarantees.
Landlord ↔ Tenant lean methodology
- Overall (STATE)
- 86 Strongly Landlord-Friendly
- State Utah
- 86 Strongly Landlord-Friendly · R+15
- County
- — inherits STATE
- City
- — inherits STATE
ZIP-level market 84078
- Rents YoY
- 4.1%
- Active inventory
- 276
- Price-to-rent
- 4.5×
Monthly cashflow live
- Estimated rent
- $1,562 medium interval (Pro) →
- Mortgage (P&I)
- −$446
- Tax est. 1.5%
- −$106 /mo · $1,275/yr
- Insurance
- −$35
- HOA
- −$0
- Vacancy / Maint / Mgmt
- −$328
- Net cashflow
- $647
Break-even live
UW: 25.0% down · 7.5% · 30yr · 1.5% tax · 5.0% vac · 8.0% maint · 8.0% mgmt
Financing live
Cash to close
- Down payment
- $21,250
- Closing costs
- $2,550
- Reserves months
- —
- Total cash needed
- —
Loan-product check · same deal, 3 products live
Conventional
25% down · 7.5% · 30yr
- Down + closing
- —
- Monthly P&I
- —
- Monthly cashflow
- —
- DSCR
- —
- Eligible?
- —
Personal DTI + credit; lowest rate.
DSCR
20% down · 8.5% · 30yr
- Down + closing
- —
- Monthly P&I
- —
- Monthly cashflow
- —
- DSCR
- —
- Eligible?
- —
No personal income docs; deal must DSCR.
Hard money
10% down · 12.0% · 12mo
- Down + closing
- —
- Monthly P&I
- —
- Monthly cashflow
- —
- DSCR
- —
- Eligible?
- —
Short-term bridge; refi at stabilization.
Listing history 16 events
-
2026-06-18days on market $85,000 Active 41 DOM
-
2026-06-17days on market $85,000 Active 40 DOM
-
2026-06-16days on market $85,000 Active 39 DOM
-
2026-06-15days on market $85,000 Active 38 DOM
-
2026-06-14days on market $85,000 Active 36 DOM
-
2026-06-12days on market $85,000 Active 35 DOM
-
2026-06-09days on market $85,000 Active 32 DOM
-
2026-06-08days on market $85,000 Active 31 DOM
-
2026-06-07days on market $85,000 Active 30 DOM
-
2026-06-02days on market $85,000 Active 25 DOM
-
2026-06-01status $85,000 Active 24 DOM
-
2026-06-01days on market $85,000 Backup 24 DOM
-
2026-05-31days on market $85,000 Backup 23 DOM
-
2026-05-30days on market $85,000 Backup 22 DOM
-
2026-05-18historical Backup
-
2026-05-08$85,000 Active
ⓘ Source: listings_history table (triggers on properties + properties_extension) + one-shot
backfill from property_details.listing_events for pre-trigger history.
Climate risk First Street
- Flood 1/10 Low FEMA zone X (unshaded) · 0% chance over 30 yrs
- Wildfire 6/10 Major
- Heat 3/10 Moderate 7 d/yr ≥92°F today · 19 d/yr by 30 yrs out
- Wind 1/10 Low
- Air quality 3/10 Moderate 3 unhealthy d/yr today · 3 by 30 yrs out
Nearby sold comps map
Loading sold comps map…
Walkable amenities ~0.75 mi
Loading nearby amenities…
Taxation est. · year 1
- Rental income
- $18,744
- − Mortgage interest
- −$4,761
- − Property taxes
- −$1,275
- − Insurance
- −$425
- − Repairs & maintenance
- −$1,500
- − Management
- −$1,500
- − Depreciation
- −$2,473
- Taxable income
- $6,811
- Est. tax owed @ 24.0%
- −$1,635
- After-tax cash flow
- $6,124/yr
For passive investors: Depreciation is non-cash, so a rental often shows a tax loss while cash-flowing — sheltering income. Rental losses are passive: they offset passive income freely, and up to $25,000/yr can offset ordinary (W-2) income if you actively participate and your MAGI is under $100k (phasing out to $0 by $150k); unused losses carry forward. On sale, claimed depreciation is recaptured at up to 25%, and gains may owe capital-gains tax (a 1031 exchange can defer both). Figures are a year-1 estimate at your 24.0% rate — not tax advice; consult a CPA.
Condition & rehab AI · 12 photos
This well-maintained single-wide mobile home offers a spacious covered porch and fresh updates throughout, making it a great opportunity for affordable living.
Value-add opportunities
- Both Paint exterior — Enhances curb appeal and value.
- Both Clean gutters — Improves drainage and overall appearance.
Renovation cost estimate screening
Value-add ROI direction
- Both Paint exterior — Enhances curb appeal and value. ↑
- Both Clean gutters — Improves drainage and overall appearance. ↑
ⓘ Cost ranges are severity-bucket heuristics (US national rule-of-thumb). Get contractor quotes + a written scope before underwriting a rehab budget.
Schools (NCES district)
- District
- Uintah District
- NCES district ID
- 4901080
- Math proficiency
- 34% ▼ -4.00%
- Reading proficiency
- 34% ▼ -4.00%
- Median HH income
- $62,125
- Composite
- 30.69/100
- National rank
- #6177
- State rank
- #60 of 80 in UT
Livability — Vernal
- Score
- 75/100
- State rank
- #60
- US rank
- #3813
Category grades
Schools grade is shown separately in the Schools card above.
Census & demographics
- County
- Uintah County · 30,975 people
- City population
- 30,975
- Metro
- Vernal, UT
- Population (ZIP)
- 30,975
- Household income
- $75,113
- Rent vs Own
- Severe rent burden
- 223.0
Population outlook (Uintah County) Hauer SSP2
- Today (2025)
- 49,582 people
- By 2030
- 56,006 · +13.0%
- By 2040
- 70,034 · +41.2%
- By 2050
- 85,323 · +72.1%
- By 2075
- 124,396 · +150.9%
- By 2100
- 154,630 · +211.9%
Race, ethnicity, and origin ACS 2023
- Neighborhood character
- Predominantly White (83%)
- Race & ethnicity
- White 83% Hispanic / Latino 8% Two or more races 8% Native American 3%
- Hispanic origin (detail)
- Mexican 7%
- Common ancestry
- Italian 6% Slovak 3% Portuguese 1%
- Foreign-born
- 2% · Canada
- Languages at home
- 96% English-only · Spanish 3% Other Asian/Pacific 1%
Political lean MEDSL · Uintah
- 2024 margin
- Solid R (+73.6) · D 12.3% · R 85.9% · Other 1.8%
- 2008→2024 swing
- -4.8pp toward R · 2008: -68.8pp · 2024: -73.6pp
- All cycles
- 2024: R+73.6 2020: R+75.8 2016: R+68.9 2012: R+81.3 2008: R+68.8
Not yet ingested
- Civics
- —
Market trends
- HPI YoY
- ▼ -304.65%
- Current HPI
- 197.5429
- Rent YoY
- ▲ 4.07%
- Metro
- Vernal, UT
- State GDP YoY
- ▲ 3.54%
- F500 in state
- 2
Industry mix (Fortune 500 HQ in UT)
| Industry | F500 HQs | Revenue |
|---|---|---|
| Financial Services | 1 | $3B |
|
||
Price history
2 events — show timeline
- 2026-05-18 Contingent — WFRMLS
- 2026-05-08 Listed $85,000 WFRMLS
Cash-flow waterfall
monthlySold comps — $/sqft
last 12 mo · ≤1 miLoading sold comps…