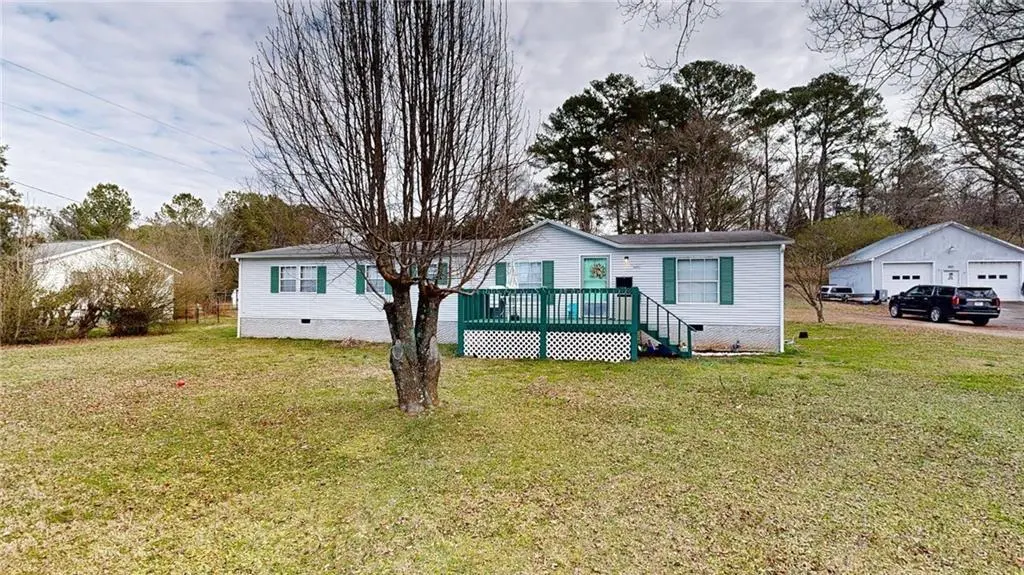
189 Boyd Valley Rd · Rome, GA
Flood risk 7/10 · Major
- FEMA flood zone
- X (unshaded)
- Chance of flooding over 30 yrs
- 0.99%
- Est. flood insurance / yr
- $507 – $1,088
Fire risk 6/10 · Moderate
- Est. fire insurance / yr
- $963 – $1,789
Heat risk 6/10 · Moderate
- Hot days now (above 104°F)
- 7 days/yr
- Hot days in 30 yrs
- 20 days/yr
Wind risk 4/10 · Minor
- Chance of severe wind over 30 yrs
- 18.0%
Air-quality risk 3/10 · Minor
- Unhealthy air days now
- 3 days/yr
- Unhealthy air days in 30 yrs
- 4 days/yr
Risk factors via First Street. Map © Google.
Why this score? — see what drove the C grade
The composite is a weighted blend of 9 inputs, each scored 0–100. Each bar is that input's sub-score; the figure is the points it added to the 100-point composite (weight × sub-score).
- Cash flow +20.6/30.0
- ARV discount +15.0/15.0
- DSCR +6.5/10.0
- 1% rule +4.1/10.0
- Rent growth +4.1/5.0
- Schools +3.5/10.0
- Livability +3.2/5.0
- Condition / age +2.5/5.0
- Appreciation +0.0/10.0
$160,900
🖨 Deal sheet 📄 Offer letter ✓ Due diligence
Listing remarks MLS
Check out this well maintained 3 bed/ 2 bath mobile home sitting on .69 of an acre. Upon entering the home you have your living room and master bed/bath to the right. To the left you have your kitchen. To the other side of the kitchen is another living room/ flex space, your two additional secondary bedrooms and a bath. This floor plan is great for someone who has elderly parents, teenagers or just likes the split bedroom plan. If that's not enough you have a large flat lot, with an outbuilding. This home is approximately 5 miles from the cutest town, with great shopping and restaurants, and Berry University. Schedule your showing and let's make a deal.
Key facts
- 0.69 acre lot
- Built 1996
- Listed 150 days
Neighborhood map
What this means for you Summary
Snapshot
- This is a 3-bed/2.0-bath other listed at $161k.
Deal economics
- At list price, monthly cash flow is $148 ($2k/yr) — positive.
- The deal already cash-flows at list — no discount required.
- To meet the 1% rule (rent ≥ 1% of price), the offer needs to be $147k (8.6% below list).
- Recommended offer: $142k (12.0% below list) — sets the bar for market timing.
- Cap rate 7.9% vs local median 3.3% in Rome — top-decile yield for the area; either an underpriced asset or a hidden risk that comps aren't pricing in. Stress-test before assuming the spread holds.
Location & tenants
- Location reads 64/100 on livability (#266 in GA) — a middle-class / working-renter tenant base. Strengths: cost of living A+, housing A+, health & safety A+; Watch: schools F, crime F, amenities F.
- Floyd County (rural): math 41% / reading 40% proficiency, ranked #45 of 174 in GA (top 26%) — families likely to look elsewhere, expect single-tenant / working-renter base with shorter leases.
- Market conditions: Rents rising fast (+6.3%/yr); 411 active listings in the ZIP; 355 units permitted in Floyd County in 2024 (0 in 5+ unit buildings).
Forward outlook
- Local home prices are declining (-3.0%/yr); year-one equity from $1k of loan paydown is wiped out by about $5k of value loss. Plan a longer hold.
- Floyd County population projected to shrink 6% by 2050 — rents likely to lag national; underwrite the cash flow, not the appreciation.
Negotiation context
- It's been on market 150 days — a 12% lower offer ($142k) is reasonable based on typical stale-listing flexibility.
- 10 sale attempts since 11y ago; this cycle's ask has dropped $14k (8%) from the opening price — seller is motivated, your offer sets the floor, not the list.
Risks & watch-outs
- Watch-outs: flood insurance adds $66/mo.
- Climate carrying-cost: major flood risk; major wildfire risk; extreme-heat days projected 7→20/yr by 2055 (HVAC capex compounding) — expect insurance premiums to compound above CPI over the hold.
Questions for the listing agent
- It's been on market 150 days. Have you received any prior offers? Is the seller open to a 12% concession, seller financing, or rate buy-down credit?
- What's the actual annual flood-insurance premium (NFIP or private), and is the property in a SFHA with mandatory coverage?
- Why hasn't it sold? Are there any deal-killer items the seller is aware of (foundation, flood, title, zoning, code violations)?
- Is there a deadline driving the sale (1031 exchange, divorce, estate, relocation)? That informs how much negotiation room exists.
- Schools are F-rated, which usually means shorter tenancies and higher turnover. Who's the typical renter profile here, and what's been the actual vacancy rate?
- Crime grade is F in this area — have there been break-ins, vandalism, or insurance claims at this property in the last 3 years? What carrier currently insures it and at what premium?
- What's the average days-on-market for RENTAL listings here right now (not sales)? A rising rental-DOM trend means longer vacancies and softer asking-rent achievability than the comps imply.
- What's the recent tenant-quality profile in this submarket — average credit score on applications, eviction rate, late-payment / NSF rate, and stable-employment percentage? A property-management company in the area should have these aggregated.
- How much new for-sale + rental construction is in the pipeline within 1–3 miles? Heavy new supply typically softens prices + rents 12–24 months out; constrained supply supports both.
Investment metrics
- 1% rule
- 0.91% ✗
- Cap rate
- 7.89%
- Cash-on-cash
- 5.72%
- DSCR
- 1.25
- GRM
- 9.1
CMA / ARV
- ARV (median comp)
- $239,789
- List price
- $160,900
- Delta
- -32.90%
- Verdict
- UNDERPRICED
- Comps
- 11 within 1.0 mi
Projected returns pro-forma
-3.0% appreciation · 6.28% rent growth · sell at horizon
- IRR
- -6.8%
- Equity multiple
- 0.74×
- Total profit
- $-11,653
- Equity at exit
- $23,991
- IRR
- 6.2%
- Equity multiple
- 1.53×
- Total profit
- $23,869
- Equity at exit
- $13,912
Cash invested: $45,052 (down + closing). Projections, not guarantees.
Landlord ↔ Tenant lean methodology
- Overall (STATE)
- 90 Strongly Landlord-Friendly
- State Georgia
- 90 Strongly Landlord-Friendly · R+3
- County
- — inherits STATE
- City
- — inherits STATE
ZIP-level market 30161
- Rents YoY
- 6.3%
- Active inventory
- 411
- Price-to-rent
- 9.1×
Monthly cashflow live
- Estimated rent
- $1,471 medium interval (Pro) →
- Mortgage (P&I)
- −$844
- Tax from tax record
- −$37 /mo · $438/yr
- Insurance
- −$67
- Flood insurance flood zone
- −$66 /mo · $798/yr
- HOA
- −$0
- Vacancy / Maint / Mgmt
- −$309
- Net cashflow
- $148
Break-even live
UW: 25.0% down · 7.5% · 30yr · 1.5% tax · 5.0% vac · 8.0% maint · 8.0% mgmt
Financing live
Cash to close
- Down payment
- $40,225
- Closing costs
- $4,827
- Reserves months
- —
- Total cash needed
- —
Loan-product check · same deal, 3 products live
Conventional
25% down · 7.5% · 30yr
- Down + closing
- —
- Monthly P&I
- —
- Monthly cashflow
- —
- DSCR
- —
- Eligible?
- —
Personal DTI + credit; lowest rate.
DSCR
20% down · 8.5% · 30yr
- Down + closing
- —
- Monthly P&I
- —
- Monthly cashflow
- —
- DSCR
- —
- Eligible?
- —
No personal income docs; deal must DSCR.
Hard money
10% down · 12.0% · 12mo
- Down + closing
- —
- Monthly P&I
- —
- Monthly cashflow
- —
- DSCR
- —
- Eligible?
- —
Short-term bridge; refi at stabilization.
Listing history 39 events
-
2026-06-18days on market $160,900 Active 150 DOM
-
2026-06-17days on market $160,900 Active 149 DOM
-
2026-06-16days on market $160,900 Active 148 DOM
-
2026-06-15days on market $160,900 Active 147 DOM
-
2026-06-14days on market $160,900 Active 145 DOM
-
2026-06-13days on market $160,900 Active 144 DOM
-
2026-06-10days on market $160,900 Active 142 DOM
-
2026-06-09days on market $160,900 Active 141 DOM
-
2026-06-08days on market $160,900 Active 140 DOM
-
2026-06-07days on market $160,900 Active 139 DOM
-
2026-06-03days on market $160,900 Active 135 DOM
-
2026-06-02days on market $160,900 Active 134 DOM
-
2026-06-01days on market $160,900 Active 133 DOM
-
2026-05-31days on market $160,900 Active 132 DOM
-
2026-05-30days on market $160,900 Active 131 DOM
-
2026-01-16$174,900 New 662-char remark
Show marketing remark (662 chars)
Check out this well maintained 3 bed/ 2 bath mobile home sitting on .69 of an acre. Upon entering the home you have your living room and master bed/bath to the right. To the left you have your kitchen. To the other side of the kitchen is another living room/ flex space, your two additional secondary bedrooms and a bath. This floor plan is great for someone who has elderly parents, teenagers or just likes the split bedroom plan. If that's not enough you have a large flat lot, with an outbuilding. This home is approximately 5 miles from the cutest town, with great shopping and restaurants, and Berry University. Schedule your showing and let's make a deal.
-
2026-01-16$174,900 Active 662-char remark
Show marketing remark (662 chars)
Check out this well maintained 3 bed/ 2 bath mobile home sitting on .69 of an acre. Upon entering the home you have your living room and master bed/bath to the right. To the left you have your kitchen. To the other side of the kitchen is another living room/ flex space, your two additional secondary bedrooms and a bath. This floor plan is great for someone who has elderly parents, teenagers or just likes the split bedroom plan. If that's not enough you have a large flat lot, with an outbuilding. This home is approximately 5 miles from the cutest town, with great shopping and restaurants, and Berry University. Schedule your showing and let's make a deal.
-
2025-06-28soldstatus $143,000 Sold
-
2025-06-28soldstatus $143,000 Closed
-
2025-06-12historical Active Under Contract
-
2025-06-12historical Active Under Contract
-
2025-05-29$125,000 New
-
2025-05-29$125,000 Active
-
2017-09-25soldstatus $45,000 Sold
-
2017-09-25soldstatus $45,000
-
2017-03-31status Under Contract
-
2017-03-31$50,000 New
-
2017-02-08historical
-
2017-01-31status Back on Market
-
2017-01-29historical
-
2016-08-01$50,000 New
-
2016-05-01historical
-
2016-04-07price $50,000
-
2015-10-29status Back On Market
-
2015-10-10historical
-
2015-10-06status Back On Market
-
2015-10-01historical
-
2015-04-02$59,900 New
-
1998-11-13soldstatus $6,000
ⓘ Source: listings_history table (triggers on properties + properties_extension) + one-shot
backfill from property_details.listing_events for pre-trigger history.
Tax reassessment forecast GA · Resets to sale price
- Current annual tax
- $438 · $37/mo
- Projected year-2 tax
- $1,480 · $123/mo
- Expected delta
- +$1,042/yr (+$87/mo · 237.7%)
ⓘ Screening estimate from a state-policy table — verify with the county assessor before closing.
Climate risk First Street
- Flood 7/10 Severe FEMA zone X (unshaded) · 99% chance over 30 yrs
- Wildfire 6/10 Major
- Heat 6/10 Major 7 d/yr ≥104°F today · 20 d/yr by 30 yrs out
- Wind 4/10 Moderate 18% chance of damaging wind over 30 yrs
- Air quality 3/10 Moderate 3 unhealthy d/yr today · 4 by 30 yrs out
Nearby sold comps map
Loading sold comps map…
Walkable amenities ~0.75 mi
Loading nearby amenities…
Taxation est. · year 1
- Rental income
- $17,652
- − Mortgage interest
- −$9,013
- − Property taxes
- −$438
- − Insurance
- −$1,602
- − Repairs & maintenance
- −$1,412
- − Management
- −$1,412
- − Depreciation
- −$4,681
- Taxable loss
- −$906
- Est. tax savings @ 24.0%
- +$218
- After-tax cash flow
- $1,997/yr
For passive investors: Depreciation is non-cash, so a rental often shows a tax loss while cash-flowing — sheltering income. Rental losses are passive: they offset passive income freely, and up to $25,000/yr can offset ordinary (W-2) income if you actively participate and your MAGI is under $100k (phasing out to $0 by $150k); unused losses carry forward. On sale, claimed depreciation is recaptured at up to 25%, and gains may owe capital-gains tax (a 1031 exchange can defer both). Figures are a year-1 estimate at your 24.0% rate — not tax advice; consult a CPA.
Schools (NCES district)
- District
- Floyd County
- NCES district ID
- 1302190
- Math proficiency
- 41% ▼ -5.00%
- Reading proficiency
- 40% ▼ -4.00%
- Median HH income
- $47,083
- Composite
- 34.64/100
- National rank
- #5143
- State rank
- #45 of 174 in GA
Livability — Rome
- Score
- 64/100
- State rank
- #266
- US rank
- #14459
Category grades
Schools grade is shown separately in the Schools card above.
Census & demographics
- County
- Floyd County · 77,706 people
- City population
- 77,706
- Metro
- Rome, GA
- Population (ZIP)
- 34,705
- Household income
- $61,667
- Rent vs Own
- Severe rent burden
- 1104.0
Population outlook (Floyd County) Hauer SSP2
- Today (2025)
- 96,321 people
- By 2030
- 95,532 · -0.8%
- By 2040
- 93,332 · -3.1%
- By 2050
- 90,850 · -5.7%
- By 2075
- 84,989 · -11.8%
- By 2100
- 76,097 · -21.0%
Race, ethnicity, and origin ACS 2023
- Neighborhood character
- Predominantly White (68%)
- Race & ethnicity
- White 68% Black 20% Hispanic / Latino 7% Two or more races 6% Asian 1%
- Hispanic origin (detail)
- Mexican 2%
- Common ancestry
- Slovak 3% Serbian 2% Italian 2%
- Foreign-born
- 5% · Canada
- Languages at home
- 91% English-only · Spanish 5% Other Indo-European 1%
Political lean MEDSL · Floyd
- 2024 margin
- Solid R (+42.0) · D 28.8% · R 70.7%
- 2008→2024 swing
- -5.6pp toward R · 2008: -36.4pp · 2024: -42.0pp
- All cycles
- 2024: R+42.0 2020: R+41.1 2016: R+43.5 2012: R+39.9 2008: R+36.4
Not yet ingested
- Civics
- —
Market trends
- HPI YoY
- ▼ -186.06%
- Current HPI
- 257.8168
- Rent YoY
- ▲ 6.28%
- Metro
- Rome, GA
- State GDP YoY
- ▲ 2.66%
- F500 in state
- 28
Industry mix (Fortune 500 HQ in GA)
| Industry | F500 HQs | Revenue |
|---|---|---|
| Paper / Packaging | 2 | $29B |
|
||
| Retail | 1 | $160B |
|
||
| Transportation / Logistics | 1 | $91B |
|
||
| Airlines | 1 | $62B |
|
||
| Consumer Goods | 1 | $47B |
|
||
| Utilities | 1 | $25B |
|
||
Price history
+2815.0% since first listed24 events — show timeline
- 2026-01-16 Listed $174,900 FMLS
- 2026-01-16 Listed $174,900 GAMLS
- 2025-06-28 Sold (MLS) $143,000 FMLS
- 2025-06-28 Sold (MLS) $143,000 GAMLS
- 2025-06-12 Contingent — GAMLS
- 2025-06-12 Contingent — FMLS
- 2025-05-29 Listed $125,000 FMLS
- 2025-05-29 Listed $125,000 GAMLS
- 2017-09-25 Sold (Public Records) $45,000 Public Records
- 2017-09-25 Sold (MLS) $45,000 GAMLS
- 2017-03-31 Pending — GAMLS
- 2017-03-31 Listed $50,000 GAMLS
- 2017-02-08 Listing Removed — GAMLS
- 2017-01-31 Relisted — GAMLS
- 2017-01-29 Listing Removed — GAMLS
- 2016-08-01 Listed $50,000 GAMLS
- 2016-05-01 Listing Removed — GAMLS
- 2016-04-07 Price Changed $50,000 GAMLS
- 2015-10-29 Relisted — GAMLS
- 2015-10-10 Listing Removed — GAMLS
- 2015-10-06 Relisted — GAMLS
- 2015-10-01 Listing Removed — GAMLS
- 2015-04-02 Listed $59,900 GAMLS
- 1998-11-13 Sold (Public Records) $6,000 Public Records
Property tax history
+17.4%/yrLatest (2025): $438 · +12.6% YoY. Source: county tax records.
Cash-flow waterfall
monthlySold comps — $/sqft
last 12 mo · ≤1 miLoading sold comps…