00 33rd St · Hidalgo, TX
Flood risk 3/10 · Minor
- FEMA flood zone
- X (shaded)
- Chance of flooding over 30 yrs
- 0.2%
- Est. flood insurance / yr
- $507 – $1,088
Fire risk 3/10 · Minor
- Est. fire insurance / yr
- $1,222 – $2,270
Heat risk 9/10 · Severe
- Hot days now (above 111°F)
- 7 days/yr
- Hot days in 30 yrs
- 21 days/yr
Wind risk 8/10 · Major
- Chance of severe wind over 30 yrs
- 99.0%
Air-quality risk 1/10 · Minimal
- Unhealthy air days now
- 0 days/yr
- Unhealthy air days in 30 yrs
- 0 days/yr
Risk factors via First Street. Map © Google.
Why this score? — see what drove the D grade
The composite is a weighted blend of 9 inputs, each scored 0–100. Each bar is that input's sub-score; the figure is the points it added to the 100-point composite (weight × sub-score).
- Cash flow +11.9/30.0
- Appreciation +10.0/10.0
- ARV discount +4.5/15.0
- 1% rule +3.5/10.0
- DSCR +3.5/10.0
- Livability +3.4/5.0
- Rent growth +2.5/5.0
- Schools +2.5/10.0
- Condition / age +2.5/5.0
$229,000
🖨 Deal sheet 📄 Offer letter ✓ Due diligence
Listing remarks
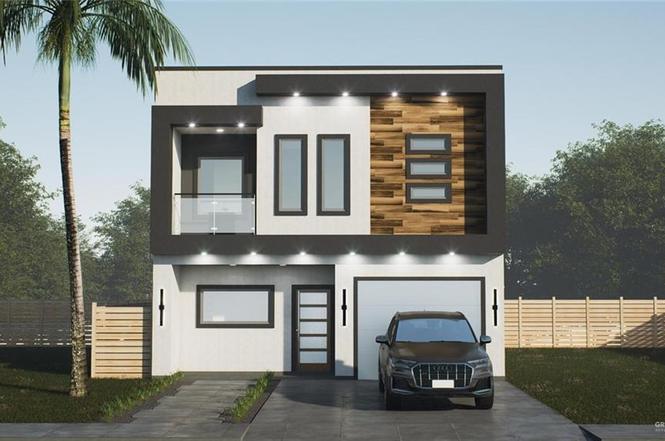
Discover your new home in the brand-new, gated community of Sonoma Terrace. These modern, energy-efficient garden homes offer the perfect blend of style and convenience. Each two-story home features a functional layout with all the living space downstairs, including a half bath, an open-concept living area, and a kitchen. Upstairs, you'll find three spacious bedrooms and two full bathrooms. Choose from four different floor plans to find the perfect fit for your lifestyle. Select a home with either a one-car or two-car garage to suit your needs. Enjoy the peace of mind of a secure, gated community with easy access to all local schools. This is your chance to own a brand-new home in a highly
Key facts
- Gated community
- Local schools
- Functional layout
Tags
Property features AI
Finance
- Other: Lot features: approx. 0.0465 acres (2,025.98 sq ft)
- HOA & community: Community association: Sonoma Terrace Owners Assn; Association fee $200 annually; POA mandatory with $250 transfer fee; Community features include curbs and sidewalks
Exterior
- Parking: Attached garage (garage faces front); Approximately 1.5 covered parking spaces (1.5 garage spaces total)
- Security: Smoke detectors; Gated community
- Utilities: Public water; City sewer; Electric power
- Home design: Single-family property; New construction: No
- Construction: Stucco construction; Shingle roof; Slab foundation; Built area approximately 1,241
- Exterior features: Wood fencing; Patio with slab; Controlled access; Sidewalks; Paved road
Interior
- Kitchen: Microwave; No conveying appliances
- Flooring: Tile flooring
- Bathrooms: 2 full bathrooms; 1 half bathroom
- Heating & cooling: Central heating (electric); Central air conditioning (electric); Thermostat (energy feature)
- Interior features: Entrance foyer; Quartz countertops; Ceiling fans; Microwave; Double-pane windows; No window coverings; 1-year equipment warranty
- Laundry & utility: Laundry room with washer/dryer connections; Electric water heater
Neighborhood map
What this means for you Summary
Snapshot
- This is a 3-bed/2.5-bath single-family listed at $229k.
Deal economics
- At list price, monthly cash flow is $-59 ($-709/yr) — negative.
- To cash-flow at today's rent, offer at most $220k (3.7% below list).
- To meet the 1% rule (rent ≥ 1% of price), the offer needs to be $195k (14.8% below list).
- Recommended offer: $195k (14.8% below list) — sets the bar for 1% rule.
- Cap rate 6.0% vs local median 4.2% in Hidalgo — top-decile yield for the area; either an underpriced asset or a hidden risk that comps aren't pricing in. Stress-test before assuming the spread holds.
Location & tenants
- Location reads 68/100 on livability (#488 in TX) — a middle-class / working-renter tenant base. Strengths: cost of living A+, housing A+, crime A-; Watch: schools D-, amenities F, commute F.
- Valley View ISD (suburban): math 24% / reading 38% proficiency, ranked #631 of 826 in TX (top 76%) — families likely to look elsewhere, expect single-tenant / working-renter base with shorter leases; 85% free/reduced lunch — lower-income household profile, screen leases tightly.
- Market conditions: 98 active listings in the ZIP; 1 comparable units currently listed for rent nearby; 7,378 units permitted in Hidalgo County in 2024 (641 in 5+ unit buildings).
Forward outlook
- In year one you build about $24k of equity ($2k loan paydown + $23k appreciation (10.0% local appreciation)).
- Hidalgo County population projected at +28% by 2050 — long-run rental-demand tailwind backs the buy-and-hold thesis.
- At projected returns (10.0% appreciation + 3.0% rent growth), your $64k cash investment doubles in ~3 years — after that, you're playing with house money.
- By year 2, paydown + projected appreciation supports a ~$39k cash-out refi (75% LTV) — recoverable capital for the next deal without selling this one.
Negotiation context
- It's been on market 127 days — a 12% lower offer ($202k) is reasonable based on typical stale-listing flexibility.
Risks & watch-outs
- Climate carrying-cost: severe wind risk, 99% chance of damaging wind over 30y; extreme-heat days projected 7→21/yr by 2055 (HVAC capex compounding) — expect insurance premiums to compound above CPI over the hold.
Questions for the listing agent
- What do current leases actually rent for vs. the listed asking? Can we see a recent rent roll and the last 12 months of T-12 income?
- It's been on market 127 days. Have you received any prior offers? Is the seller open to a 15% concession, seller financing, or rate buy-down credit?
- What does the HOA fee cover, when was the last increase, and are there any pending special assessments or reserve-fund shortfalls?
- Why hasn't it sold? Are there any deal-killer items the seller is aware of (foundation, flood, title, zoning, code violations)?
- Is there a deadline driving the sale (1031 exchange, divorce, estate, relocation)? That informs how much negotiation room exists.
- Schools are D-rated, which usually means shorter tenancies and higher turnover. Who's the typical renter profile here, and what's been the actual vacancy rate?
- The area grade is low — what's the realistic commute time and amenity access for the typical tenant pool here? Any planned neighborhood developments (good or bad) we should know about?
- What's the average days-on-market for RENTAL listings here right now (not sales)? A rising rental-DOM trend means longer vacancies and softer asking-rent achievability than the comps imply.
- What's the recent tenant-quality profile in this submarket — average credit score on applications, eviction rate, late-payment / NSF rate, and stable-employment percentage? A property-management company in the area should have these aggregated.
- How much new for-sale + rental construction is in the pipeline within 1–3 miles? Heavy new supply typically softens prices + rents 12–24 months out; constrained supply supports both.
Investment metrics
- 1% rule
- 0.85% ✗
- Cap rate
- 5.98%
- Cash-on-cash
- -1.11%
- DSCR
- 0.95
- GRM
- 9.8
CMA / ARV
- ARV (on-the-fly)
- $214,693
- Comps found
- 12
Show comp detail 12 sales within ~0.75 mi
| Address | Dist | Beds/Ba | Sqft | Sold | Price | $/sf | Match |
|---|---|---|---|---|---|---|---|
| 3009 Laurel St | 0.22mi | 3/2.0 | 1,250 (+1%) | 6mo | $234,000 | $187 | 82 |
| 1305 N Sabinas St | 0.07mi | 3/2.0 | 1,403 (+13%) | 3mo | $185,000 | $132 | 71 |
| 2900 E Palo Blanco St | 0.24mi | 3/2.5 | 1,348 (+9%) | 6mo | $232,900 | $173 | 69 |
| 2911 E Palo Blanco Ave | 0.19mi | 3/2.5 | 1,415 (+14%) | 14mo | $227,900 | $161 | 56 |
| 2908 Monterrey St | 0.74mi | 3/2.0 | 1,263 (+2%) | 11mo | $155,000 | $123 | 51 |
| 2703 Torreon St | 0.62mi | 3/2.0 | 1,371 (+10%) | 2mo | $239,000 | $174 | 50 |
| 3000 Jarilla Ave | 0.34mi | 3/2.0 | 1,392 (+12%) | 14mo | $173,000 | $124 | 50 |
| 2601 E Retama St | 0.46mi | 3/2.0 | 1,378 (+11%) | 11mo | $254,900 | $185 | 49 |
| 2905 E Zarzamora Ave | 0.43mi | 3/2.5 | 1,401 (+13%) | 13mo | $250,000 | $178 | 48 |
| 2412 Sabinal Ave | 0.63mi | 3/2.0 | 1,405 (+13%) | 1mo | $229,000 | $163 | 46 |
| 2410 E Tamarindo Ave | 0.65mi | 3/2.0 | 1,386 (+12%) | 6mo | $240,000 | $173 | 43 |
| 2310 E Sabinal Ave | 0.73mi | 3/2.5 | 1,414 (+14%) | 1mo | $249,500 | $176 | 42 |
Match score weights: distance 35% · size 25% · config 20% · recency 20%. Top-matched comps best support the ARV.
Projected returns pro-forma
10.0% appreciation · 3.0% rent growth · sell at horizon
- IRR
- 23.5%
- Equity multiple
- 2.89×
- Total profit
- $120,997
- Equity at exit
- $206,301
- IRR
- 20.9%
- Equity multiple
- 6.60×
- Total profit
- $359,355
- Equity at exit
- $444,897
Cash invested: $64,120 (down + closing). Projections, not guarantees.
Landlord ↔ Tenant lean methodology
- Overall (STATE)
- 87 Strongly Landlord-Friendly
- State Texas
- 87 Strongly Landlord-Friendly · R+5
- County
- — inherits STATE
- City
- — inherits STATE
ZIP-level market 78557
- Home prices YoY
- 17.9%
- Active inventory
- 98
- Price-to-rent
- 9.8×
Monthly cashflow live
- Estimated rent
- $1,950 medium interval (Pro) →
- Mortgage (P&I)
- −$1,201
- Tax est. 1.5%
- −$286 /mo · $3,435/yr
- Insurance
- −$95
- HOA
- −$17
- Vacancy / Maint / Mgmt
- −$410
- Net cashflow
- $-59
Break-even live
UW: 25.0% down · 7.5% · 30yr · 1.5% tax · 5.0% vac · 8.0% maint · 8.0% mgmt
Financing live
Cash to close
- Down payment
- $57,250
- Closing costs
- $6,870
- Reserves months
- —
- Total cash needed
- —
Loan-product check · same deal, 3 products live
Conventional
25% down · 7.5% · 30yr
- Down + closing
- —
- Monthly P&I
- —
- Monthly cashflow
- —
- DSCR
- —
- Eligible?
- —
Personal DTI + credit; lowest rate.
DSCR
20% down · 8.5% · 30yr
- Down + closing
- —
- Monthly P&I
- —
- Monthly cashflow
- —
- DSCR
- —
- Eligible?
- —
No personal income docs; deal must DSCR.
Hard money
10% down · 12.0% · 12mo
- Down + closing
- —
- Monthly P&I
- —
- Monthly cashflow
- —
- DSCR
- —
- Eligible?
- —
Short-term bridge; refi at stabilization.
Rent comps 1 comps
| Address | Beds | Baths | Sqft | Rent | $/sqft | DOM | Units | Dist |
|---|---|---|---|---|---|---|---|---|
| 2304 E Tamarindo Ave Hidalgo, TX | 3.0 | 2.0 | 1442 | $1,950 | $1.35 | 23d | 1 | 0.78mi |
HOA detail
- Monthly dues
- $17 · $204/yr
- Likely covers
- security
Listing history 17 events
-
2026-06-19days on market $229,000 Active 127 DOM
-
2026-06-18days on market $229,000 Active 126 DOM
-
2026-06-17days on market $229,000 Active 125 DOM
-
2026-06-16days on market $229,000 Active 124 DOM
-
2026-06-15days on market $229,000 Active 123 DOM
-
2026-06-14days on market $229,000 Active 121 DOM
-
2026-06-12days on market $229,000 Active 120 DOM
-
2026-06-09days on market $229,000 Active 117 DOM
-
2026-06-08days on market $229,000 Active 116 DOM
-
2026-06-07days on market $229,000 Active 115 DOM
-
2026-06-05days on market $229,000 Active 112 DOM
-
2026-06-03days on market $229,000 Active 111 DOM
-
2026-06-02days on market $229,000 Active 110 DOM
-
2026-06-01days on market $229,000 Active 109 DOM
-
2026-05-31days on market $229,000 Active 108 DOM
-
2026-05-30days on market $229,000 Active 107 DOM
-
2026-02-12$229,000 Active
ⓘ Source: listings_history table (triggers on properties + properties_extension) + one-shot
backfill from property_details.listing_events for pre-trigger history.
Climate risk First Street
- Flood 3/10 Moderate FEMA zone X (shaded) · 20% chance over 30 yrs
- Wildfire 3/10 Moderate
- Heat 9/10 Extreme 7 d/yr ≥111°F today · 21 d/yr by 30 yrs out
- Wind 8/10 Severe 99% chance of damaging wind over 30 yrs
- Air quality 1/10 Low 0 unhealthy d/yr today · 0 by 30 yrs out
Nearby sold comps map
Loading sold comps map…
Walkable amenities ~0.75 mi
Loading nearby amenities…
Taxation est. · year 1
- Rental income
- $23,400
- − Mortgage interest
- −$12,828
- − Property taxes
- −$3,435
- − Insurance
- −$1,145
- − Repairs & maintenance
- −$1,872
- − Management
- −$1,872
- − HOA
- −$204
- − Depreciation
- −$6,662
- Taxable loss
- −$4,617
- Est. tax savings @ 24.0%
- +$1,108
- After-tax cash flow
- $399/yr
For passive investors: Depreciation is non-cash, so a rental often shows a tax loss while cash-flowing — sheltering income. Rental losses are passive: they offset passive income freely, and up to $25,000/yr can offset ordinary (W-2) income if you actively participate and your MAGI is under $100k (phasing out to $0 by $150k); unused losses carry forward. On sale, claimed depreciation is recaptured at up to 25%, and gains may owe capital-gains tax (a 1031 exchange can defer both). Figures are a year-1 estimate at your 24.0% rate — not tax advice; consult a CPA.
Schools (NCES district)
- District
- Valley View ISD
- NCES district ID
- 4843800
- Math proficiency
- 24% ▼ -42.00%
- Reading proficiency
- 38% ▼ -16.00%
- Median HH income
- $33,158
- Composite
- 25.37/100
- National rank
- #7473
- State rank
- #631 of 826 in TX
Livability — Hidalgo
- Score
- 68/100
- State rank
- #488
- US rank
- #9681
Category grades
Schools grade is shown separately in the Schools card above.
Census & demographics
- Census place
- Hidalgo, TX
- City population
- 14,250
- Population (ZIP)
- 14,250
Population outlook (Hidalgo County) Hauer SSP2
- Today (2025)
- 955,232 people
- By 2030
- 1,009,774 · +5.7%
- By 2040
- 1,120,332 · +17.3%
- By 2050
- 1,225,036 · +28.2%
- By 2075
- 1,439,189 · +50.7%
- By 2100
- 1,533,429 · +60.5%
Race, ethnicity, and origin ACS 2023
- Neighborhood character
- Predominantly Hispanic (99%)
- Race & ethnicity
- Hispanic / Latino 99% Two or more races 47%
- Hispanic origin (detail)
- Mexican 93%
- Foreign-born
- 39% · Canada
- Languages at home
- 6% English-only · Spanish 94%
Political lean MEDSL · Hidalgo
- 2024 margin
- Toss-up / Even · D 48.1% · R 51.0%
- 2008→2024 swing
- -41.6pp toward R · 2008: 38.7pp · 2024: -2.9pp
- All cycles
- 2024: R+2.9 2020: D+17.1 2016: D+40.5 2012: D+41.8 2008: D+38.7
Not yet ingested
- Civics
- —
Market trends
- HPI YoY
- ▲ 34.26%
- Current HPI
- 225.701
- Rent YoY
- —
- Metro
- —
- State GDP YoY
- ▲ 3.95%
- F500 in state
- 110
Industry mix (Fortune 500 HQ in TX)
| Industry | F500 HQs | Revenue |
|---|---|---|
| Energy | 16 | $1,198B |
|
||
| Technology | 5 | $198B |
|
||
| Engineering / Construction | 4 | $72B |
|
||
| Energy Services | 3 | $60B |
|
||
| Utilities | 3 | $41B |
|
||
| Healthcare | 2 | $330B |
|
||
Price history
1 event — show timeline
- 2026-02-12 Listed $229,000 MCALLENMLS
Cash-flow waterfall
monthlySold comps — $/sqft
last 12 mo · ≤1 miLoading sold comps…