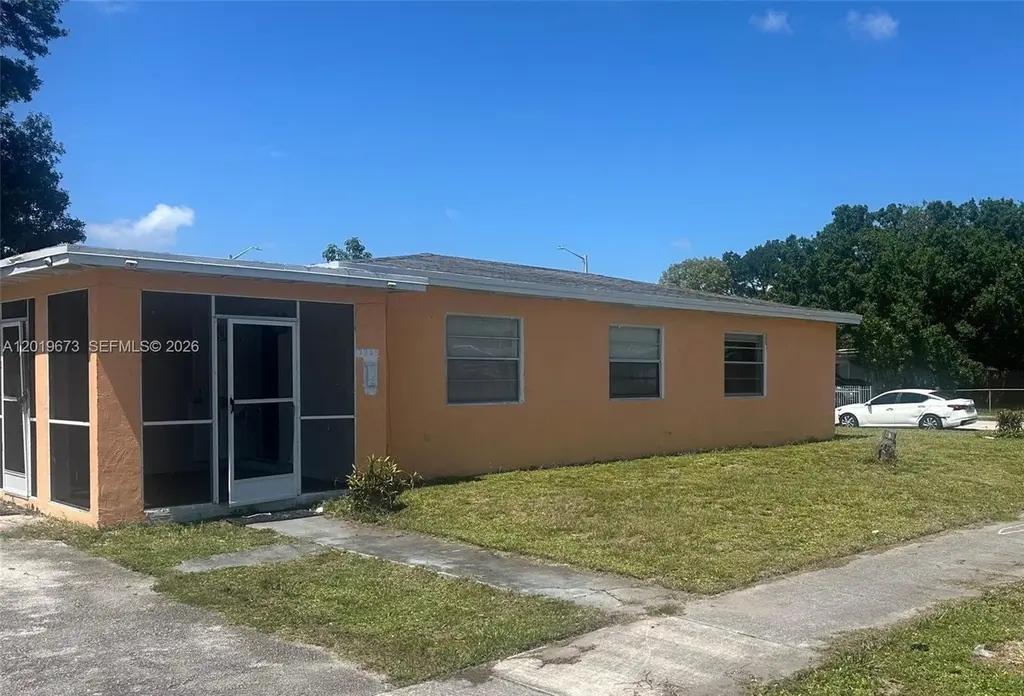
2925 NW 5th St · Boulevard Gardens, FL
Flood risk 1/10 · Minimal
- FEMA flood zone
- X (shaded)
- Chance of flooding over 30 yrs
- 0.0%
- Est. flood insurance / yr
- $507 – $1,088
Fire risk 1/10 · Minimal
- Est. fire insurance / yr
- $947 – $1,759
Heat risk 9/10 · Severe
- Hot days now (above 105°F)
- 5 days/yr
- Hot days in 30 yrs
- 18 days/yr
Wind risk 10/10 · Severe
- Chance of severe wind over 30 yrs
- 99.0%
Air-quality risk 2/10 · Minimal
- Unhealthy air days now
- 2 days/yr
- Unhealthy air days in 30 yrs
- 2 days/yr
Risk factors via First Street. Map © Google.
Why this score? — see what drove the D+ grade
The composite is a weighted blend of 9 inputs, each scored 0–100. Each bar is that input's sub-score; the figure is the points it added to the 100-point composite (weight × sub-score).
- Cash flow +12.5/30.0
- ARV discount +11.1/15.0
- Livability +4.2/5.0
- Schools +4.1/10.0
- 1% rule +4.0/10.0
- DSCR +3.7/10.0
- Rent growth +3.2/5.0
- Condition / age +2.5/5.0
- Appreciation +0.0/10.0
$299,900
🖨 Deal sheet 📄 Offer letter ✓ Due diligence
Listing remarks
Great opportunity to bring your vision to life with this 3 bedroom, 1 bathroom situated on a spacious corner lot near downtown Fort Lauderdale. This home features a living and dining room combination, tile flooring throughout, spacious bedrooms, and a large kitchen with plenty of potential. Enjoy relaxing on the screened front lanai overlooking the oversized yard with room to expand, garden, or entertain. Conveniently located close to major roadways, parks, shopping, dining, entertainment, and the beautiful South Florida beaches. Ideal opportunity for investors, renovators, or buyers looking to customize a home in a prime location. All information recorded in the MLS is intended to be accur
Key facts
- Close to parks
- Oversized yard
- Large kitchen
Tags
Property features AI
Exterior
- Parking: Driveway
- Utilities: Public water; Public sewer
- Home design: Single-story; Faces south; Resale property
- Construction: Brick and block construction; Shingle roof
- Exterior features: Enclosed porch; Screened porch
Interior
- Bedrooms: Bedroom located on the main level
- Flooring: Tile
- Bathrooms: 1 full bathroom
- Heating & cooling: Central electric heating; Central electric cooling (air conditioning)
- Interior features: First floor entry; Bedroom on main level; Tile flooring
Neighborhood map
What this means for you Summary
Snapshot
- This is a 3-bed/1.0-bath single-family listed at $300k.
Deal economics
- At list price, monthly cash flow is $-45 ($-543/yr) — negative.
- To cash-flow at today's rent, offer at most $292k (2.7% below list).
- To meet the 1% rule (rent ≥ 1% of price), the offer needs to be $270k (9.9% below list).
- Recommended offer: $270k (9.9% below list) — sets the bar for 1% rule.
Location & tenants
- Location reads 85/100 on livability (#22 in FL, #511 nationally) — a professional / high-income tenant draw. Strengths: crime A+, commute A+, housing A+; Watch: amenities F.
- Broward (suburban): math 42% / reading 53% proficiency, ranked #46 of 73 in FL (top 63%) — families likely to look elsewhere, expect single-tenant / working-renter base with shorter leases.
- Market conditions: Rents rising (+2.8%/yr); 585 active listings in the ZIP; 40 comparable units currently listed for rent nearby; rentals at typical pace (median 24d on market — plan ~3-4 weeks tenant-placement turnaround); 2,111 units permitted in Broward County in 2024 (1,265 in 5+ unit buildings).
- At $2,702/mo this rent would consume 60% of the median local household income ($54k/yr) (locally 5068% of renters already pay >50% of income on rent) — very limited rent-growth headroom before tenants either downsize or default.
Forward outlook
- Local home prices are declining (-3.0%/yr); year-one equity from $2k of loan paydown is wiped out by about $9k of value loss. Plan a longer hold.
- Broward County population projected at +34% by 2050 — long-run rental-demand tailwind backs the buy-and-hold thesis.
Negotiation context
- It's been on market 29 days — a 2% lower offer ($295k) is reasonable based on typical stale-listing flexibility.
- 2 sale attempts with the ask held roughly flat each time — persistent listings suggest the price (not the market) is what's stuck; bring a comps-based counter.
Risks & watch-outs
- Watch-outs: built in 1955 — expect roof / HVAC / electrical / plumbing capex.
- Climate carrying-cost: severe wind risk, 99% chance of damaging wind over 30y; extreme-heat days projected 5→18/yr by 2055 (HVAC capex compounding) — expect insurance premiums to compound above CPI over the hold.
Questions for the listing agent
- What do current leases actually rent for vs. the listed asking? Can we see a recent rent roll and the last 12 months of T-12 income?
- Built in 1955 — when were the roof, HVAC, electrical panel, plumbing, and water heater last replaced?
- Is there a deadline driving the sale (1031 exchange, divorce, estate, relocation)? That informs how much negotiation room exists.
- The area grade is low — what's the realistic commute time and amenity access for the typical tenant pool here? Any planned neighborhood developments (good or bad) we should know about?
- What's the average days-on-market for RENTAL listings here right now (not sales)? A rising rental-DOM trend means longer vacancies and softer asking-rent achievability than the comps imply.
- What's the recent tenant-quality profile in this submarket — average credit score on applications, eviction rate, late-payment / NSF rate, and stable-employment percentage? A property-management company in the area should have these aggregated.
- How much new for-sale + rental construction is in the pipeline within 1–3 miles? Heavy new supply typically softens prices + rents 12–24 months out; constrained supply supports both.
Investment metrics
- 1% rule
- 0.90% ✗
- Cap rate
- 6.11%
- Cash-on-cash
- -0.65%
- DSCR
- 0.97
- GRM
- 9.3
CMA / ARV
- ARV (on-the-fly)
- $325,650
- Comps found
- 1
Show comp detail 1 sale within ~0.75 mi
| Address | Dist | Beds/Ba | Sqft | Sold | Price | $/sf | Match |
|---|---|---|---|---|---|---|---|
| 881 NW 34th Way | 0.75mi | 3/2.0 | 1,102 (+13%) | 23mo | $368,000 | $334 | 20 |
Match score weights: distance 35% · size 25% · config 20% · recency 20%. Top-matched comps best support the ARV.
Projected returns pro-forma
-3.0% appreciation · 2.78% rent growth · sell at horizon
- IRR
- -17.6%
- Equity multiple
- 0.38×
- Total profit
- $-51,968
- Equity at exit
- $44,716
- IRR
- -10.0%
- Equity multiple
- 0.39×
- Total profit
- $-50,968
- Equity at exit
- $25,930
Cash invested: $83,972 (down + closing). Projections, not guarantees.
Landlord ↔ Tenant lean methodology
- Overall (STATE)
- 87 Strongly Landlord-Friendly
- State Florida
- 87 Strongly Landlord-Friendly · R+3
- County
- — inherits STATE
- City
- — inherits STATE
ZIP-level market 33311
- Rents YoY
- 2.8%
- Active inventory
- 585
- Price-to-rent
- 9.3×
Monthly cashflow live
- Estimated rent
- $2,702 high interval (Pro) →
- Mortgage (P&I)
- −$1,573
- Tax from tax record
- −$482 /mo · $5,784/yr
- Insurance
- −$125
- HOA
- −$0
- Vacancy / Maint / Mgmt
- −$567
- Net cashflow
- $-45
Break-even live
UW: 25.0% down · 7.5% · 30yr · 1.5% tax · 5.0% vac · 8.0% maint · 8.0% mgmt
Financing live
Cash to close
- Down payment
- $74,975
- Closing costs
- $8,997
- Reserves months
- —
- Total cash needed
- —
Loan-product check · same deal, 3 products live
Conventional
25% down · 7.5% · 30yr
- Down + closing
- —
- Monthly P&I
- —
- Monthly cashflow
- —
- DSCR
- —
- Eligible?
- —
Personal DTI + credit; lowest rate.
DSCR
20% down · 8.5% · 30yr
- Down + closing
- —
- Monthly P&I
- —
- Monthly cashflow
- —
- DSCR
- —
- Eligible?
- —
No personal income docs; deal must DSCR.
Hard money
10% down · 12.0% · 12mo
- Down + closing
- —
- Monthly P&I
- —
- Monthly cashflow
- —
- DSCR
- —
- Eligible?
- —
Short-term bridge; refi at stabilization.
Rent comps 40 comps
| Address | Beds | Baths | Sqft | Rent | $/sqft | DOM | Units | Dist |
|---|---|---|---|---|---|---|---|---|
| 2900 NW 5th Ct Fort Lauderdale, FL | 4.0 | 2.0 | 1112 | $3,250 | $2.92 | 18d | 1 | 0.10mi |
| 540 NW 31st Ave Fort Lauderdale, FL | 4.0 | 2.0 | 1097 | $2,900 | $2.64 | 7d | 1 | 0.14mi |
| 280 NW 31st Ave Fort Lauderdale, FL | 3.0 | 2.0 | 884 | $2,700 | $3.05 | 17d | 1 | 0.24mi |
| 721 NW 33rd Ave Lauderhill, FL | 3.0 | 2.0 | 874 | $2,750 | $3.15 | 4d | 1 | 0.41mi |
| 3025 NW 8th Rd Fort Lauderdale, FL | 3.0 | 1.0 | 947 | $2,520 | $2.66 | 24d | 1 | 0.44mi |
| 500 NW 24th Ave Apt 27 Fort Lauderdale, FL | 2.0 | 1.0 | 660 | $1,850 | $2.80 | 24d | 1 | 0.64mi |
| 2500 NW 9th Ct Fort Lauderdale, FL | 3.0 | 2.0 | 780 | $2,375 | $3.04 | 19d | 1 | 0.78mi |
| 2941 NW 11th Ct Fort Lauderdale, FL | 3.0 | 1.0 | 968 | $2,200 | $2.27 | 24d | 1 | 0.81mi |
| 420 SW 27th Ave Fort Lauderdale, FL | 3.0 | 1.0–2.0 | 1024 | $3,759 | $3.67 | 24d | 1 | 0.82mi |
| 2701 SW 4th Pl Fort Lauderdale, FL | 2.0 | 2.0 | 820 | $2,430 | $2.96 | 5d | 8 | 0.83mi |
| 661 NW 21st Ter Unit 2 Fort Lauderdale, FL | 2.0 | 1.0 | 670 | $1,800 | $2.69 | 17d | 1 | 0.83mi |
| 101 SW 22nd Ave Fort Lauderdale, FL | 3.0 | 2.0 | 1010 | $7,500 | $7.43 | 16d | 1 | 0.86mi |
| 2231 NW 9th Pl Unit H Fort Lauderdale, FL | 3.0 | 2.0 | 864 | $2,700 | $3.12 | 10d | 1 | 0.91mi |
| 401 SW 25th Ave Fort Lauderdale, FL | 3.0 | 1.5 | 1065 | $3,200 | $3.00 | 7d | 1 | 0.91mi |
| 2621 Riverland Dr Unit 2 Fort Lauderdale, FL | 3.0 | 1.0 | 1012 | $2,300 | $2.27 | 21d | 1 | 1.01mi |
| 433 SW 22nd Ter Fort Lauderdale, FL | 2.0 | 1.0 | 744 | $2,450 | $3.29 | 24d | 1 | 1.04mi |
| 1040 NW 23rd Ter Fort Lauderdale, FL | 3.0 | 1.0 | 900 | $2,550 | $2.83 | 24d | 1 | 1.04mi |
| 331 NW 39th Ave #1 Plantation, FL | 4.0 | 1.0 | 1096 | $3,000 | $2.74 | 24d | 1 | 1.08mi |
| 439-441 NW 18th Ave Fort Lauderdale, FL | 3.0 | 1.0 | 900 | $2,200 | $2.44 | 15d | 1 | 1.11mi |
| 600 NW 18th Ave Unit E Fort Lauderdale, FL | 2.0 | 2.0 | 1100 | $2,400 | $2.18 | 24d | 1 | 1.12mi |
| 2571 NW 13th Ct Unit 3 Fort Lauderdale, FL | 2.0 | 1.0 | 700 | $1,600 | $2.29 | 24d | 1 | 1.16mi |
| 2571 NW 13th Ct Unit C Fort Lauderdale, FL | 2.0 | 1.0 | 700 | $1,600 | $2.29 | 20d | 1 | 1.16mi |
| 335 N State Road 7 Plantation, FL | 1.0–3.0 | 1.0–2.0 | 1051 | $3,000 | $2.85 | 1d | 26 | 1.18mi |
| 2330 NW 13th St Fort Lauderdale, FL | 2.0 | 1.0 | 750 | $2,700 | $3.60 | 24d | 1 | 1.20mi |
| 107 SW 18th Ave Unit 7 Fort Lauderdale, FL | 2.0 | 1.0 | 900 | $1,675 | $1.86 | 24d | 1 | 1.21mi |
| 2611 SW 9th St Fort Lauderdale, FL | 2.0 | 1.0 | 790 | $1,850 | $2.34 | 24d | 1 | 1.21mi |
| 2451 NW 13th Ct Fort Lauderdale, FL | 2.0 | 1.0 | 600 | $1,650 | $2.75 | 24d | 1 | 1.21mi |
| 2620 NW 14th Ct Unit 2620 Fort Lauderdale, FL | 3.0 | 2.0 | 1080 | $2,900 | $2.69 | 2d | 1 | 1.21mi |
| 2708 NW 15th St Fort Lauderdale, FL | 2.0 | 1.0 | 750 | $1,700 | $2.27 | 24d | 1 | 1.22mi |
| 3429 NW 13th St Fort Lauderdale, FL | 3.0 | 2.5 | 1120 | $2,595 | $2.32 | 24d | 1 | 1.25mi |
| 2349 NW 13th Ct Unit 2349 Fort Lauderdale, FL | 2.0 | 1.0 | 572 | $1,750 | $3.06 | 24d | 1 | 1.25mi |
| 3484 NW 13th St Fort Lauderdale, FL | 2.0 | 2.5 | 1120 | $2,100 | $1.88 | 24d | 1 | 1.26mi |
| 433 NW 15th Way Fort Lauderdale, FL | 2.0 | 2.0 | 1000 | $3,799 | $3.80 | 16d | 1 | 1.26mi |
| 533 NW 15th Way Fort Lauderdale, FL | 3.0 | 1.0 | 1067 | $2,198 | $2.06 | 24d | 1 | 1.26mi |
| 2791 NW 15th Ct Unit B Fort Lauderdale, FL | 3.0 | 2.0 | 1020 | $2,450 | $2.40 | 24d | 1 | 1.28mi |
| 1805 SW 4th Ct Fort Lauderdale, FL | 2.0 | 2.0 | 1100 | $2,000 | $1.82 | 24d | 1 | 1.29mi |
| 3507 NW 13th St Unit 3507 Lauderhill, FL | 2.0 | 2.5 | 1120 | $2,450 | $2.19 | 5d | 1 | 1.30mi |
| 1436 NW 24th Ter Fort Lauderdale, FL | 3.0 | 1.0 | 992 | $2,500 | $2.52 | 24d | 1 | 1.30mi |
| 424 NW 15th Ter Fort Lauderdale, FL | 2.0 | 1.0 | 600 | $1,695 | $2.83 | 24d | 1 | 1.35mi |
| 4271 NW 5th St Plantation, FL | 1.0–2.0 | 1.0 | 526 | $1,800 | $3.42 | 20d | 2 | 1.36mi |
Listing history 15 events
-
2026-06-18days on market $299,900 Active 29 DOM
-
2026-06-17days on market $299,900 Active 28 DOM
-
2026-06-16days on market $299,900 Active 27 DOM
-
2026-06-15days on market $299,900 Active 26 DOM
-
2026-06-13days on market $299,900 Active 24 DOM
-
2026-06-09days on market $299,900 Active 20 DOM
-
2026-06-08days on market $299,900 Active 19 DOM
-
2026-06-07days on market $299,900 Active 18 DOM
-
2026-06-04days on market $299,900 Active 15 DOM
-
2026-06-03days on market $299,900 Active 14 DOM
-
2026-06-02days on market $299,900 Active 13 DOM
-
2026-06-01days on market $299,900 Active 12 DOM
-
2026-05-31days on market $299,900 Active 11 DOM
-
2026-05-20$299,900 Active
-
2026-03-18$5,000 Active
ⓘ Source: listings_history table (triggers on properties + properties_extension) + one-shot
backfill from property_details.listing_events for pre-trigger history.
Tax reassessment forecast FL · Resets to sale price
- Current annual tax
- $5,784 · $482/mo
- Projected year-2 tax
- $5,784 · $482/mo
- Expected delta
- $0/yr ($0/mo · 0.0%)
ⓘ Screening estimate from a state-policy table — verify with the county assessor before closing.
Climate risk First Street
- Flood 1/10 Low FEMA zone X (shaded) · 0% chance over 30 yrs
- Wildfire 1/10 Low
- Heat 9/10 Extreme 5 d/yr ≥105°F today · 18 d/yr by 30 yrs out
- Wind 10/10 Extreme 99% chance of damaging wind over 30 yrs
- Air quality 2/10 Low 2 unhealthy d/yr today · 2 by 30 yrs out
Nearby sold comps map
Loading sold comps map…
Walkable amenities ~0.75 mi
Loading nearby amenities…
Taxation est. · year 1
- Rental income
- $32,421
- − Mortgage interest
- −$16,799
- − Property taxes
- −$5,784
- − Insurance
- −$1,500
- − Repairs & maintenance
- −$2,594
- − Management
- −$2,594
- − Depreciation
- −$8,724
- Taxable loss
- −$5,573
- Est. tax savings @ 24.0%
- +$1,337
- After-tax cash flow
- $795/yr
For passive investors: Depreciation is non-cash, so a rental often shows a tax loss while cash-flowing — sheltering income. Rental losses are passive: they offset passive income freely, and up to $25,000/yr can offset ordinary (W-2) income if you actively participate and your MAGI is under $100k (phasing out to $0 by $150k); unused losses carry forward. On sale, claimed depreciation is recaptured at up to 25%, and gains may owe capital-gains tax (a 1031 exchange can defer both). Figures are a year-1 estimate at your 24.0% rate — not tax advice; consult a CPA.
Schools (NCES district)
- District
- Broward
- NCES district ID
- 1200180
- Math proficiency
- 42% ▼ -18.00%
- Reading proficiency
- 53% ▼ -5.00%
- Median HH income
- $52,139
- Composite
- 40.88/100
- National rank
- #3621
- State rank
- #46 of 73 in FL
Livability — Boulevard Gardens
- Score
- 85/100
- State rank
- #22
- US rank
- #511
Category grades
Schools grade is shown separately in the Schools card above.
Census & demographics
- Census place
- Boulevard Gardens, FL
- County
- Broward County · 1,963,430 people
- Metro
- Miami-Fort Lauderdale-Pompano Beach, FL
- Population (ZIP)
- 74,898
- Household income
- $53,973
- Rent vs Own
- Severe rent burden
- 5068.0
Population outlook (Broward County) Hauer SSP2
- Today (2025)
- 2,207,033 people
- By 2030
- 2,360,704 · +7.0%
- By 2040
- 2,661,208 · +20.6%
- By 2050
- 2,946,698 · +33.5%
- By 2075
- 3,602,273 · +63.2%
- By 2100
- 3,970,984 · +79.9%
Race, ethnicity, and origin ACS 2023
- Neighborhood character
- Predominantly Black (77%)
- Race & ethnicity
- Black 77% Two or more races 9% White 9% Hispanic / Latino 9%
- Hispanic origin (detail)
- Mexican 1% Puerto Rican 2% Cuban 1%
- Common ancestry
- Hispanic 15% Lithuanian 1% Romanian 0%
- Foreign-born
- 24% · Canada, Jamaica
- Languages at home
- 78% English-only · French/Haitian/Cajun 14% Spanish 6% Other Indo-European 1%
Political lean MEDSL · Broward
- 2024 margin
- D (+17.0) · D 58.0% · R 41.0%
- 2008→2024 swing
- -17.8pp toward R · 2008: 34.7pp · 2024: 17.0pp
- All cycles
- 2024: D+17.0 2020: D+29.8 2016: D+35.0 2012: D+34.9 2008: D+34.7
Not yet ingested
- Civics
- —
Market trends
- HPI YoY
- ▼ -300.68%
- Current HPI
- 535.2504
- Rent YoY
- ▲ 2.78%
- Metro
- Miami-Fort Lauderdale-Pompano Beach, FL
- State GDP YoY
- ▲ 3.28%
- F500 in state
- 36
Industry mix (Fortune 500 HQ in FL)
| Industry | F500 HQs | Revenue |
|---|---|---|
| Industrial Technology | 2 | $29B |
|
||
| Insurance | 2 | $17B |
|
||
| Retail | 1 | $60B |
|
||
| Technology Distribution | 1 | $58B |
|
||
| Homebuilding | 1 | $35B |
|
||
| Technology Manufacturing | 1 | $35B |
|
||
Price history
+5898.0% since first listed2 events — show timeline
- 2026-05-20 Listed $299,900 MARMLS
- 2026-03-18 Listed $5,000 NFMLS
Property tax history
+19.5%/yrLatest (2025): $5,784 · +7.1% YoY. Source: county tax records.
Cash-flow waterfall
monthlySold comps — $/sqft
last 12 mo · ≤1 miLoading sold comps…