10407 Twin Oak Dr · Oak Ridge North, TX
Flood risk 7/10 · Major
- FEMA flood zone
- X (shaded)
- Chance of flooding over 30 yrs
- 0.99%
- Est. flood insurance / yr
- $507 – $1,088
Fire risk 5/10 · Moderate
- Est. fire insurance / yr
- $1,222 – $2,270
Heat risk 8/10 · Major
- Hot days now (above 111°F)
- 7 days/yr
- Hot days in 30 yrs
- 23 days/yr
Wind risk 8/10 · Major
- Chance of severe wind over 30 yrs
- 99.0%
Air-quality risk 3/10 · Minor
- Unhealthy air days now
- 2 days/yr
- Unhealthy air days in 30 yrs
- 3 days/yr
Risk factors via First Street. Map © Google.
Why this score? — see what drove the D+ grade
The composite is a weighted blend of 9 inputs, each scored 0–100. Each bar is that input's sub-score; the figure is the points it added to the 100-point composite (weight × sub-score).
- ARV discount +13.5/15.0
- Cash flow +11.7/30.0
- Schools +5.1/10.0
- Livability +4.2/5.0
- DSCR +3.5/10.0
- Rent growth +3.5/5.0
- 1% rule +3.1/10.0
- Condition / age +2.5/5.0
- Appreciation +0.0/10.0
$275,000
🖨 Deal sheet 📄 Offer letter ✓ Due diligence
Listing remarks
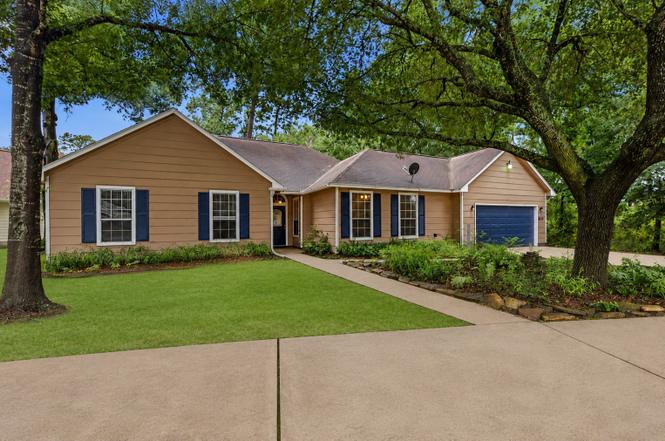
Welcome home to this beautifully updated one-story in the desirable Lake Chateau Woods community! Offering 3 bedrooms, 3 full baths, and a private home office, this thoughtfully designed home features manufactured wood and tile flooring throughout with no carpet. The updated kitchen showcases granite countertops, abundant cabinetry, and a functional layout perfect for everyday living and entertaining. The spacious living areas flow seamlessly to a peaceful backyard retreat complete with a large deck, ideal for enjoying your morning coffee or relaxing evenings. A circle driveway provides ample parking and added curb appeal. Additional updates include a 2023 A/C and furnace for peace of mind.
Key facts
- Large deck
- Updated kitchen
- Tile flooring
Tags
Property features AI
Finance
- Other: Lease not considered
Exterior
- Parking: Attached garage with 2 spaces; Garage with garage door opener; Circular driveway
- Security: Smoke detectors
- Utilities: Public water; Public sewer
- Home design: Residential property; Built in 1997; Slab foundation; Composition roof
- Construction: Cement siding construction
- Exterior features: Deck; Patio; Private yard; Fenced backyard; Corner lot; Subdivision lot; Wooded lot
Interior
- Kitchen: Dishwasher; Disposal; Gas oven; Gas range; Microwave; Oven; Refrigerator; ENERGY STAR qualified appliances
- Bedrooms: 6 total rooms (includes bedrooms and other living spaces)
- Flooring: Engineered hardwood; Tile
- Bathrooms: 3 full bathrooms; Double vanities (where applicable)
- Heating & cooling: Central heating (gas); Central air conditioning (electric); Has heating and cooling
- Interior features: High ceilings; Kitchen and family room combo; Pantry; Double vanity; Tub with shower; Vanity; Window treatments; Ceiling fans; Programmable thermostat; Reverse osmosis water system; Gas fireplace with gas log
- Laundry & utility: Washer and dryer included; Washer hookup; Electric dryer hookup; Gas dryer hookup
Neighborhood map
What this means for you Summary
Snapshot
- This is a 3-bed/2.5-bath single-family listed at $275k.
Deal economics
- At list price, monthly cash flow is $-146 ($-2k/yr) — negative.
- To cash-flow at today's rent, offer at most $249k (9.4% below list).
- To meet the 1% rule (rent ≥ 1% of price), the offer needs to be $224k (18.6% below list).
- Recommended offer: $224k (18.6% below list) — sets the bar for 1% rule.
- Cap rate 5.9% vs local median 3.1% in Oak Ridge North — top-decile yield for the area; either an underpriced asset or a hidden risk that comps aren't pricing in. Stress-test before assuming the spread holds.
Location & tenants
- Location reads 84/100 on livability (#8 in TX, #708 nationally) — a professional / high-income tenant draw. Strengths: employment A+, housing A+, crime B+; Watch: amenities D+.
- Conroe ISD (other): math 57% / reading 57% proficiency, ranked #69 of 826 in TX (top 8%) — acceptable for families but not a draw, mixed tenant base, ~2y average lease.
- Zoned schools: Oak Ridge H S (math 48% / reading 62%, grade C, #373 of 1,632 statewide, top 23%, 2,672 students, 42% FRL).
- Market conditions: Rents rising (+3.9%/yr); 316 active listings in the ZIP; 3 comparable units currently listed for rent nearby; rentals at typical pace (median 22d on market — plan ~3-4 weeks tenant-placement turnaround); high-income renter base; 13,259 units permitted in Montgomery County in 2024 (1,402 in 5+ unit buildings).
Forward outlook
- Local home prices are declining (-3.0%/yr); year-one equity from $2k of loan paydown is wiped out by about $8k of value loss. Plan a longer hold.
- Montgomery County population projected at +65% by 2050 — long-run rental-demand tailwind backs the buy-and-hold thesis.
Negotiation context
- Only 1 days on market — expect competitive offers; lowballing is unlikely to land.
- 5 sale attempts since 9y ago with the ask held roughly flat each time — persistent listings suggest the price (not the market) is what's stuck; bring a comps-based counter.
Risks & watch-outs
- Watch-outs: flood insurance adds $66/mo.
- Climate carrying-cost: major flood risk; severe wind risk, 99% chance of damaging wind over 30y; moderate wildfire risk; extreme-heat days projected 7→23/yr by 2055 (HVAC capex compounding) — expect insurance premiums to compound above CPI over the hold.
Questions for the listing agent
- What do current leases actually rent for vs. the listed asking? Can we see a recent rent roll and the last 12 months of T-12 income?
- What's the actual annual flood-insurance premium (NFIP or private), and is the property in a SFHA with mandatory coverage?
- Is there a deadline driving the sale (1031 exchange, divorce, estate, relocation)? That informs how much negotiation room exists.
- Schools are A-rated — typically a magnet for longer-tenancy family renters. What's the average tenant stay here, and is there a school-zone premium baked into asking?
- The area grade is low — what's the realistic commute time and amenity access for the typical tenant pool here? Any planned neighborhood developments (good or bad) we should know about?
- What's the average days-on-market for RENTAL listings here right now (not sales)? A rising rental-DOM trend means longer vacancies and softer asking-rent achievability than the comps imply.
- What's the recent tenant-quality profile in this submarket — average credit score on applications, eviction rate, late-payment / NSF rate, and stable-employment percentage? A property-management company in the area should have these aggregated.
- How much new for-sale + rental construction is in the pipeline within 1–3 miles? Heavy new supply typically softens prices + rents 12–24 months out; constrained supply supports both.
Investment metrics
- 1% rule
- 0.81% ✗
- Cap rate
- 5.95%
- Cash-on-cash
- -1.24%
- DSCR
- 0.95
- GRM
- 10.2
CMA / ARV
- ARV (on-the-fly)
- $317,188
- Comps found
- 12
Show comp detail 12 sales within ~0.75 mi
| Address | Dist | Beds/Ba | Sqft | Sold | Price | $/sf | Match |
|---|---|---|---|---|---|---|---|
| 1310 Beech Dr | 0.11mi | 3/2.0 | 1,747 (-1%) | 8mo | $274,999 | $157 | 84 |
| 10507 Twin Oak Dr | 0.07mi | 3/2.0 | 1,702 (-4%) | 6mo | $264,900 | $156 | 83 |
| 10348 Stone Gate Dr | 0.23mi | 3/2.0 | 1,820 (+3%) | 3mo | $279,500 | $154 | 80 |
| 1016 Chateau Woods Parkway Dr | 0.37mi | 3/2.0 | 1,763 (-0%) | 2mo | $445,000 | $252 | 78 |
| 1452 Glenoaks Dr | 0.18mi | 3/2.5 | 1,646 (-7%) | 7mo | $294,900 | $179 | 74 |
| 1619 Ashway St | 0.44mi | 3/3.0 | 1,856 (+5%) | 2mo | $349,900 | $189 | 68 |
| 10732 Twin Oaks Dr | 0.22mi | 3/2.0 | 1,550 (-12%) | 7mo | $250,000 | $161 | 61 |
| 1011 Chateau Woods Parkway Dr | 0.33mi | 3/3.0 | 1,988 (+12%) | 4mo | $495,000 | $249 | 59 |
| 10921 Oriole Pl | 0.35mi | 3/2.0 | 1,542 (-13%) | 1mo | $279,999 | $182 | 59 |
| 10208 Jewel Ct | 0.46mi | 3/2.5 | 1,937 (+9%) | 6mo | $275,000 | $142 | 58 |
| 603 Springwood Dr | 0.69mi | 3/2.0 | 1,686 (-5%) | 2mo | $287,000 | $170 | 56 |
| 619 Pinewood Dr | 0.68mi | 3/2.0 | 1,544 (-13%) | 0mo | $310,000 | $201 | 44 |
Match score weights: distance 35% · size 25% · config 20% · recency 20%. Top-matched comps best support the ARV.
Projected returns pro-forma
-3.0% appreciation · 3.88% rent growth · sell at horizon
- IRR
- -19.1%
- Equity multiple
- 0.33×
- Total profit
- $-51,800
- Equity at exit
- $41,003
- IRR
- -9.9%
- Equity multiple
- 0.37×
- Total profit
- $-48,530
- Equity at exit
- $23,777
Cash invested: $77,000 (down + closing). Projections, not guarantees.
Landlord ↔ Tenant lean methodology
- Overall (STATE)
- 87 Strongly Landlord-Friendly
- State Texas
- 87 Strongly Landlord-Friendly · R+5
- County
- — inherits STATE
- City
- — inherits STATE
ZIP-level market 77385
- Home prices YoY
- -27.5%
- Rents YoY
- 3.9%
- Active inventory
- 316
- Price-to-rent
- 10.2×
Monthly cashflow live
- Estimated rent
- $2,239 medium interval (Pro) →
- Mortgage (P&I)
- −$1,442
- Tax from tax record
- −$291 /mo · $3,497/yr
- Insurance
- −$115
- Flood insurance flood zone
- −$66 /mo · $798/yr
- HOA
- −$0
- Vacancy / Maint / Mgmt
- −$470
- Net cashflow
- $-146
Break-even live
UW: 25.0% down · 7.5% · 30yr · 1.5% tax · 5.0% vac · 8.0% maint · 8.0% mgmt
Financing live
Cash to close
- Down payment
- $68,750
- Closing costs
- $8,250
- Reserves months
- —
- Total cash needed
- —
Loan-product check · same deal, 3 products live
Conventional
25% down · 7.5% · 30yr
- Down + closing
- —
- Monthly P&I
- —
- Monthly cashflow
- —
- DSCR
- —
- Eligible?
- —
Personal DTI + credit; lowest rate.
DSCR
20% down · 8.5% · 30yr
- Down + closing
- —
- Monthly P&I
- —
- Monthly cashflow
- —
- DSCR
- —
- Eligible?
- —
No personal income docs; deal must DSCR.
Hard money
10% down · 12.0% · 12mo
- Down + closing
- —
- Monthly P&I
- —
- Monthly cashflow
- —
- DSCR
- —
- Eligible?
- —
Short-term bridge; refi at stabilization.
Rent comps 3 comps
| Address | Beds | Baths | Sqft | Rent | $/sqft | DOM | Units | Dist |
|---|---|---|---|---|---|---|---|---|
| 10648 Fussel Rd Conroe, TX | 4.0 | 2.0 | 1708 | $2,300 | $1.35 | 43d | 1 | 0.75mi |
| 32331 Summer Park Ln Conroe, TX | 3.0 | 2.0 | 1796 | $2,000 | $1.11 | 22d | 1 | 1.39mi |
| 2519 Braley Park Ln Conroe, TX | 3.0 | 2.0 | 1802 | $2,049 | $1.14 | 14d | 1 | 1.45mi |
Listing history 2 events
-
2026-06-17remarks 699-char remark
-
2026-06-17$275,000 Active 1 DOM
ⓘ Source: listings_history table (triggers on properties + properties_extension) + one-shot
backfill from property_details.listing_events for pre-trigger history.
Tax reassessment forecast TX · Resets to sale price
- Current annual tax
- $3,497 · $291/mo
- Projected year-2 tax
- $5,032 · $419/mo
- Expected delta
- +$1,536/yr (+$128/mo · 43.9%)
ⓘ Screening estimate from a state-policy table — verify with the county assessor before closing.
Climate risk First Street
- Flood 7/10 Severe FEMA zone X (shaded) · 99% chance over 30 yrs
- Wildfire 5/10 Major
- Heat 8/10 Severe 7 d/yr ≥111°F today · 23 d/yr by 30 yrs out
- Wind 8/10 Severe 99% chance of damaging wind over 30 yrs
- Air quality 3/10 Moderate 2 unhealthy d/yr today · 3 by 30 yrs out
Nearby sold comps map
Loading sold comps map…
Walkable amenities ~0.75 mi
Loading nearby amenities…
Taxation est. · year 1
- Rental income
- $26,869
- − Mortgage interest
- −$15,404
- − Property taxes
- −$3,497
- − Insurance
- −$2,172
- − Repairs & maintenance
- −$2,150
- − Management
- −$2,150
- − Depreciation
- −$8,000
- Taxable loss
- −$6,504
- Est. tax savings @ 24.0%
- +$1,561
- After-tax cash flow
- $-188/yr
For passive investors: Depreciation is non-cash, so a rental often shows a tax loss while cash-flowing — sheltering income. Rental losses are passive: they offset passive income freely, and up to $25,000/yr can offset ordinary (W-2) income if you actively participate and your MAGI is under $100k (phasing out to $0 by $150k); unused losses carry forward. On sale, claimed depreciation is recaptured at up to 25%, and gains may owe capital-gains tax (a 1031 exchange can defer both). Figures are a year-1 estimate at your 24.0% rate — not tax advice; consult a CPA.
Schools (NCES district)
- District
- Conroe ISD
- NCES district ID
- 4815000
- Math proficiency
- 57% ▼ -6.00%
- Reading proficiency
- 57% ▼ -1.00%
- Median HH income
- $71,541
- Composite
- 50.65/100
- National rank
- #1833
- State rank
- #69 of 826 in TX
Livability — Oak Ridge North
- Score
- 84/100
- State rank
- #8
- US rank
- #708
Category grades
Schools grade is shown separately in the Schools card above.
Census & demographics
- County
- Montgomery County · 663,713 people
- Metro
- Houston-The Woodlands-Sugar Land, TX
- Population (ZIP)
- 28,156
- Household income
- $117,118
- Rent vs Own
- Severe rent burden
- 471.0
Population outlook (Montgomery County) Hauer SSP2
- Today (2025)
- 713,896 people
- By 2030
- 805,263 · +12.8%
- By 2040
- 992,708 · +39.1%
- By 2050
- 1,179,590 · +65.2%
- By 2075
- 1,628,084 · +128.1%
- By 2100
- 1,937,880 · +171.5%
Race, ethnicity, and origin ACS 2023
- Neighborhood character
- Diverse neighborhood (Simpson 0.63)
- Race & ethnicity
- White 53% Hispanic / Latino 27% Two or more races 16% Black 11% Asian 5%
- Hispanic origin (detail)
- Mexican 15% Puerto Rican 2% Cuban 1%
- Common ancestry
- Slovak 3% Romanian 2% Italian 2%
- Foreign-born
- 15% · Canada, Jamaica, Vietnam
- Languages at home
- 76% English-only · Spanish 16% Other Indo-European 2% Other Asian/Pacific 1%
Political lean MEDSL · Montgomery
- 2024 margin
- Solid R (+45.5) · D 26.8% · R 72.3%
- 2008→2024 swing
- +7.2pp toward D · 2008: -52.7pp · 2024: -45.5pp
- All cycles
- 2024: R+45.5 2020: R+43.8 2016: R+51.4 2012: R+60.7 2008: R+52.7
Not yet ingested
- Civics
- —
Market trends
- HPI YoY
- ▼ -91.09%
- Current HPI
- 239.9434
- Rent YoY
- ▲ 3.88%
- Metro
- Houston-The Woodlands-Sugar Land, TX
- State GDP YoY
- ▲ 3.95%
- F500 in state
- 110
Industry mix (Fortune 500 HQ in TX)
| Industry | F500 HQs | Revenue |
|---|---|---|
| Energy | 16 | $1,198B |
|
||
| Technology | 5 | $198B |
|
||
| Engineering / Construction | 4 | $72B |
|
||
| Energy Services | 3 | $60B |
|
||
| Utilities | 3 | $41B |
|
||
| Healthcare | 2 | $330B |
|
||
Price history
+22.2% since first listed10 events — show timeline
- 2026-06-17 Listed $275,000 HARMLS
- 2020-03-18 Listing Removed — HARMLS
- 2019-10-31 Relisted — HARMLS
- 2019-10-31 Listing Removed — HARMLS
- 2019-10-31 Listed $225,000 HARMLS
- 2018-01-04 Relisted — HARMLS
- 2018-01-04 Listing Removed — HARMLS
- 2017-08-28 Listing Removed — HARMLS
- 2017-07-18 Listed $225,000 HARMLS
- 1997-02-12 Sold (Public Records) — Public Records
Property tax history
+1.9%/yrLatest (2025): $3,497 · -4.3% YoY. Source: county tax records.
Cash-flow waterfall
monthlySold comps — $/sqft
last 12 mo · ≤1 miLoading sold comps…