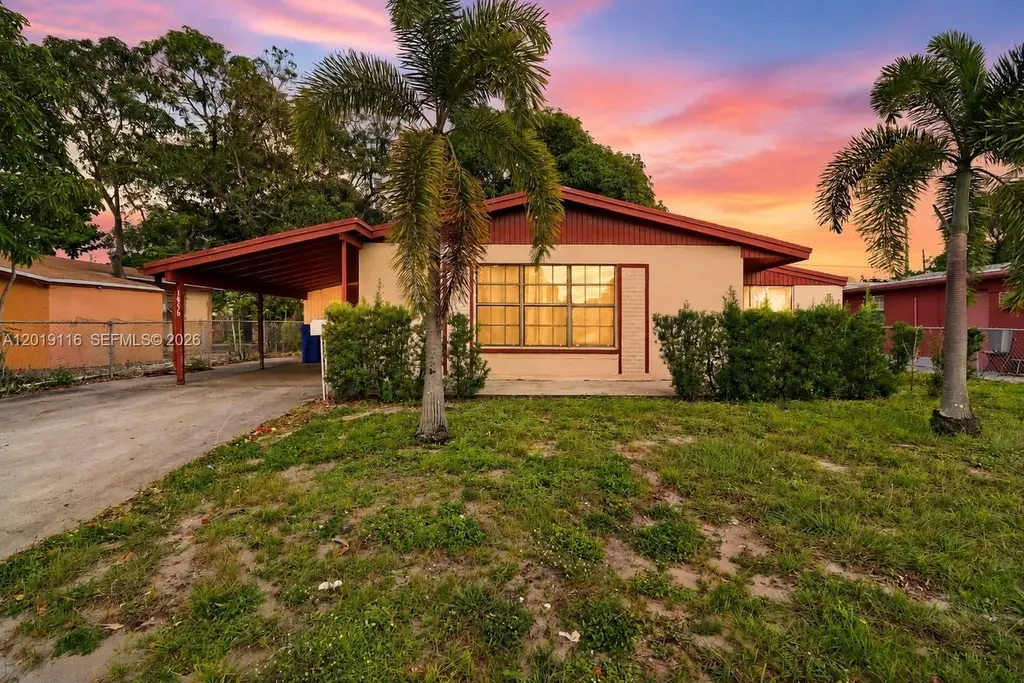
1856 NW 6th Ave · Pompano Beach, FL
Flood risk 1/10 · Minimal
- FEMA flood zone
- X (shaded)
- Chance of flooding over 30 yrs
- 0.0%
- Est. flood insurance / yr
- $507 – $1,088
Fire risk 1/10 · Minimal
- Est. fire insurance / yr
- $947 – $1,759
Heat risk 10/10 · Severe
- Hot days now (above 106°F)
- 7 days/yr
- Hot days in 30 yrs
- 27 days/yr
Wind risk 10/10 · Severe
- Chance of severe wind over 30 yrs
- 99.0%
Air-quality risk 2/10 · Minimal
- Unhealthy air days now
- 1 days/yr
- Unhealthy air days in 30 yrs
- 3 days/yr
Risk factors via First Street. Map © Google.
Why this score? — see what drove the F grade
The composite is a weighted blend of 9 inputs, each scored 0–100. Each bar is that input's sub-score; the figure is the points it added to the 100-point composite (weight × sub-score).
- Cash flow +13.2/30.0
- Schools +4.1/10.0
- DSCR +3.9/10.0
- 1% rule +3.7/10.0
- Livability +3.7/5.0
- Rent growth +3.0/5.0
- Condition / age +2.5/5.0
- ARV discount +0.0/15.0
- Appreciation +0.0/10.0
$370,000
🖨 Deal sheet 📄 Offer letter ✓ Due diligence
Listing remarks MLS
Great investment property or First Time Home buyer!! Currently a 2/1, but can be easily converted back to a 3/1. Large yard, new AC, carport and utility shed.
Key facts
- 6,000 sq ft lot
- Parking
- Built 1968
Property features AI
Finance
- Financial info: Pets allowed with no restrictions
Exterior
- Parking: Covered carport (1 space)
- Utilities: Public water; Public sewer
- Home design: Single-story; Faces west; RS-4 zoning
- Construction: Block construction; Shingle roof; Effective year built
- Exterior features: Fence; Open patio; Porch; Shed(s)
Interior
- Kitchen: Electric range; Refrigerator
- Flooring: Ceramic tile; Laminate
- Bathrooms: 1 full bathroom
- Heating & cooling: Central heating; Central air conditioning
- Interior features: First-floor entry; Bedroom on main level
- Laundry & utility: Washer; Dryer; Laundry / Utility room
Neighborhood map
What this means for you Summary
Snapshot
- This is a 4-bed/1.0-bath single-family listed at $370k.
Deal economics
- At list price, monthly cash flow is $-10 ($-118/yr) — negative.
- To cash-flow at today's rent, offer at most $368k (0.5% below list).
- To meet the 1% rule (rent ≥ 1% of price), the offer needs to be $324k (12.5% below list).
- Recommended offer: $324k (12.5% below list) — sets the bar for 1% rule.
- Cap rate 6.3% vs local median 3.1% in Pompano Beach — top-decile yield for the area; either an underpriced asset or a hidden risk that comps aren't pricing in. Stress-test before assuming the spread holds.
Location & tenants
- Location reads 74/100 on livability (#284 in FL, #4,541 nationally) — a middle-class / working-renter tenant base. Strengths: commute A+, housing A+, cost of living B+; Watch: schools D+, employment D+, amenities F.
- Broward (suburban): math 42% / reading 53% proficiency, ranked #46 of 73 in FL (top 63%) — families likely to look elsewhere, expect single-tenant / working-renter base with shorter leases.
- Market conditions: Rents rising (+2.1%/yr); 338 active listings in the ZIP; 21 comparable units currently listed for rent nearby; rentals at typical pace (median 24d on market — plan ~3-4 weeks tenant-placement turnaround); 2,111 units permitted in Broward County in 2024 (1,265 in 5+ unit buildings).
- At $3,236/mo this rent would consume 60% of the median local household income ($65k/yr) (locally 2870% of renters already pay >50% of income on rent) — very limited rent-growth headroom before tenants either downsize or default.
Forward outlook
- Local home prices are declining (-3.0%/yr); year-one equity from $3k of loan paydown is wiped out by about $11k of value loss. Plan a longer hold.
- Broward County population projected at +34% by 2050 — long-run rental-demand tailwind backs the buy-and-hold thesis.
Negotiation context
- It's been on market 32 days — a 3% lower offer ($359k) is reasonable based on typical stale-listing flexibility.
- 2 sale attempts since 6y ago with the ask held roughly flat each time — persistent listings suggest the price (not the market) is what's stuck; bring a comps-based counter.
- Current owner paid $173k; list at $370k implies a 114% gain — meaningful room to come down on a strong offer.
Risks & watch-outs
- Climate carrying-cost: severe wind risk, 99% chance of damaging wind over 30y; extreme-heat days projected 7→27/yr by 2055 (HVAC capex compounding) — expect insurance premiums to compound above CPI over the hold.
Questions for the listing agent
- What do current leases actually rent for vs. the listed asking? Can we see a recent rent roll and the last 12 months of T-12 income?
- It's been on market 32 days. Have you received any prior offers? Is the seller open to a 13% concession, seller financing, or rate buy-down credit?
- Built in 1968 — when were the roof, HVAC, electrical panel, plumbing, and water heater last replaced?
- Is there a deadline driving the sale (1031 exchange, divorce, estate, relocation)? That informs how much negotiation room exists.
- Schools are D-rated, which usually means shorter tenancies and higher turnover. Who's the typical renter profile here, and what's been the actual vacancy rate?
- The area grade is low — what's the realistic commute time and amenity access for the typical tenant pool here? Any planned neighborhood developments (good or bad) we should know about?
- What's the average days-on-market for RENTAL listings here right now (not sales)? A rising rental-DOM trend means longer vacancies and softer asking-rent achievability than the comps imply.
- What's the recent tenant-quality profile in this submarket — average credit score on applications, eviction rate, late-payment / NSF rate, and stable-employment percentage? A property-management company in the area should have these aggregated.
- How much new for-sale + rental construction is in the pipeline within 1–3 miles? Heavy new supply typically softens prices + rents 12–24 months out; constrained supply supports both.
Investment metrics
- 1% rule
- 0.87% ✗
- Cap rate
- 6.26%
- Cash-on-cash
- -0.11%
- DSCR
- 0.99
- GRM
- 9.5
CMA / ARV
- ARV (on-the-fly)
- $295,000
- Comps found
- 3
Show comp detail 3 sales within ~0.75 mi
| Address | Dist | Beds/Ba | Sqft | Sold | Price | $/sf | Match |
|---|---|---|---|---|---|---|---|
| 656 NW 21st St | 0.23mi | 3/1.0 (-1) | 1,020 (+2%) | 18mo | $395,000 | $387 | 66 |
| 381 NW 16th St | 0.33mi | 3/1.0 (-1) | 950 (-5%) | 10mo | $280,000 | $295 | 63 |
| 1521 NW 2nd Ave | 0.59mi | 3/1.0 (-1) | 968 (-3%) | 5mo | $280,000 | $289 | 58 |
Match score weights: distance 35% · size 25% · config 20% · recency 20%. Top-matched comps best support the ARV.
Projected returns pro-forma
-3.0% appreciation · 2.12% rent growth · sell at horizon
- IRR
- -17.5%
- Equity multiple
- 0.39×
- Total profit
- $-63,369
- Equity at exit
- $55,168
- IRR
- -11.2%
- Equity multiple
- 0.35×
- Total profit
- $-67,217
- Equity at exit
- $31,991
Cash invested: $103,600 (down + closing). Projections, not guarantees.
Landlord ↔ Tenant lean methodology
- Overall (STATE)
- 87 Strongly Landlord-Friendly
- State Florida
- 87 Strongly Landlord-Friendly · R+3
- County
- — inherits STATE
- City
- — inherits STATE
ZIP-level market 33060
- Home prices YoY
- -23.6%
- Rents YoY
- 2.1%
- Active inventory
- 338
- Price-to-rent
- 9.5×
Monthly cashflow live
- Estimated rent
- $3,236 high interval (Pro) →
- Mortgage (P&I)
- −$1,940
- Tax from tax record
- −$472 /mo · $5,659/yr
- Insurance
- −$154
- HOA
- −$0
- Vacancy / Maint / Mgmt
- −$679
- Net cashflow
- $-10
Break-even live
UW: 25.0% down · 7.5% · 30yr · 1.5% tax · 5.0% vac · 8.0% maint · 8.0% mgmt
Financing live
Cash to close
- Down payment
- $92,500
- Closing costs
- $11,100
- Reserves months
- —
- Total cash needed
- —
Loan-product check · same deal, 3 products live
Conventional
25% down · 7.5% · 30yr
- Down + closing
- —
- Monthly P&I
- —
- Monthly cashflow
- —
- DSCR
- —
- Eligible?
- —
Personal DTI + credit; lowest rate.
DSCR
20% down · 8.5% · 30yr
- Down + closing
- —
- Monthly P&I
- —
- Monthly cashflow
- —
- DSCR
- —
- Eligible?
- —
No personal income docs; deal must DSCR.
Hard money
10% down · 12.0% · 12mo
- Down + closing
- —
- Monthly P&I
- —
- Monthly cashflow
- —
- DSCR
- —
- Eligible?
- —
Short-term bridge; refi at stabilization.
Rent comps 21 comps
| Address | Beds | Baths | Sqft | Rent | $/sqft | DOM | Units | Dist |
|---|---|---|---|---|---|---|---|---|
| 1881 NW 5th Ter Pompano Beach, FL | 3.0 | 2.0 | 1152 | $3,400 | $2.95 | 7d | 1 | 0.02mi |
| 1881 NW 5th Ter Unit 1881 Pompano Beach, FL | 3.0 | 2.0 | 1152 | $3,400 | $2.95 | 24d | 1 | 0.02mi |
| 774 NW 16th Pl Pompano Beach, FL | 3.0 | 2.0 | 1446 | $3,000 | $2.07 | 24d | 1 | 0.26mi |
| 1592 NW 7th Ter Pompano Beach, FL | 5.0 | 2.0 | 1217 | $2,700 | $2.22 | 24d | 1 | 0.38mi |
| 171 NW 19th St Pompano Beach, FL | 3.0 | 2.0 | 1215 | $3,250 | $2.67 | 24d | 1 | 0.42mi |
| 10 NW 19th St Pompano Beach, FL | 4.0 | 2.0 | 1215 | $2,990 | $2.46 | 24d | 1 | 0.55mi |
| 2001 NE 1st Ave Pompano Beach, FL | 5.0 | 2.0 | 1431 | $3,100 | $2.17 | 3d | 1 | 0.57mi |
| 2001 NE 1st Ave Unit 1 Pompano Beach, FL | 5.0 | 2.0 | 1431 | $3,100 | $2.17 | 16d | 1 | 0.57mi |
| 1670 NE 1st Ave Pompano Beach, FL | 3.0 | 2.0 | 1200 | $3,300 | $2.75 | 24d | 1 | 0.65mi |
| 1921 NE 2nd Ave Pompano Beach, FL | 3.0 | 2.0 | 1261 | $2,960 | $2.35 | 22d | 1 | 0.66mi |
| 2001 NE 2nd Ter Pompano Beach, FL | 3.0 | 2.0 | 999 | $3,000 | $3.00 | 24d | 1 | 0.71mi |
| 229 NE 26th Ct Pompano Beach, FL | 3.0 | 2.0 | 1145 | $3,000 | $2.62 | 22d | 1 | 1.02mi |
| 110 NE 30th St Pompano Beach, FL | 3.0 | 2.0 | 1418 | $4,400 | $3.10 | 24d | 1 | 1.09mi |
| 704 NW 3rd Ave Pompano Beach, FL | 3.0 | 1.0 | 1156 | $2,600 | $2.25 | 24d | 1 | 1.15mi |
| 3329 NW 11th Ave Unit 3329 Pompano Beach, FL | 3.0 | 2.5 | 1420 | $2,800 | $1.97 | 24d | 1 | 1.28mi |
| 1087 NW 33rd Mnr Pompano Beach, FL | 3.0 | 2.5 | 1495 | $2,675 | $1.79 | 24d | 1 | 1.31mi |
| 1307 Partridge Close #67 Pompano Beach, FL | 4.0 | 2.5 | 1500 | $2,500 | $1.67 | 14d | 1 | 1.36mi |
| 1307 Partridge Close Pompano Beach, FL | 4.0 | 2.5 | 1500 | $2,500 | $1.67 | 7d | 1 | 1.36mi |
| 2621 NE 8th Ave Pompano Beach, FL | 3.0 | 2.0 | 1200 | $2,650 | $2.21 | 5d | 1 | 1.39mi |
| 3313 Quail Close #3313 Pompano Beach, FL | 3.0 | 2.5 | 1420 | $2,500 | $1.76 | 24d | 1 | 1.42mi |
| 20 NW 7th Ave #6 Pompano Beach, FL | 3.0 | 1.5 | 1088 | $2,150 | $1.98 | 15d | 1 | 1.47mi |
Listing history 22 events
-
2026-06-18days on market $370,000 Active 32 DOM
-
2026-06-17days on market $370,000 Active 31 DOM
-
2026-06-16days on market $370,000 Active 30 DOM
-
2026-06-15days on market $370,000 Active 29 DOM
-
2026-06-13days on market $370,000 Active 27 DOM
-
2026-06-09days on market $370,000 Active 23 DOM
-
2026-06-08days on market $370,000 Active 22 DOM
-
2026-06-07days on market $370,000 Active 21 DOM
-
2026-06-04days on market $370,000 Active 18 DOM
-
2026-06-03days on market $370,000 Active 17 DOM
-
2026-06-02days on market $370,000 Active 16 DOM
-
2026-06-01days on market $370,000 Active 15 DOM
-
2026-05-31days on market $370,000 Active 14 DOM
-
2026-05-17$370,000 Active
-
2020-10-16soldstatus $173,000
-
2020-10-14soldstatus $150,000 Closed 160-char remark
Show marketing remark (160 chars)
Great investment property or First Time Home buyer!! Currently a 2/1, but can be easily converted back to a 3/1. Large yard, new AC, carport and utility shed.
-
2020-09-14historical Active Under Contract 160-char remark
Show marketing remark (160 chars)
Great investment property or First Time Home buyer!! Currently a 2/1, but can be easily converted back to a 3/1. Large yard, new AC, carport and utility shed.
-
2020-09-10price $199,900 160-char remark
Show marketing remark (160 chars)
Great investment property or First Time Home buyer!! Currently a 2/1, but can be easily converted back to a 3/1. Large yard, new AC, carport and utility shed.
-
2020-08-22price $209,999 160-char remark
Show marketing remark (160 chars)
Great investment property or First Time Home buyer!! Currently a 2/1, but can be easily converted back to a 3/1. Large yard, new AC, carport and utility shed.
-
2020-08-20price $210,000 160-char remark
Show marketing remark (160 chars)
Great investment property or First Time Home buyer!! Currently a 2/1, but can be easily converted back to a 3/1. Large yard, new AC, carport and utility shed.
-
2020-08-18price $220,000 160-char remark
Show marketing remark (160 chars)
Great investment property or First Time Home buyer!! Currently a 2/1, but can be easily converted back to a 3/1. Large yard, new AC, carport and utility shed.
-
2020-07-31$225,000 Active 160-char remark
Show marketing remark (160 chars)
Great investment property or First Time Home buyer!! Currently a 2/1, but can be easily converted back to a 3/1. Large yard, new AC, carport and utility shed.
ⓘ Source: listings_history table (triggers on properties + properties_extension) + one-shot
backfill from property_details.listing_events for pre-trigger history.
Tax reassessment forecast FL · Resets to sale price
- Current annual tax
- $5,659 · $472/mo
- Projected year-2 tax
- $5,659 · $472/mo
- Expected delta
- $0/yr ($0/mo · 0.0%)
ⓘ Screening estimate from a state-policy table — verify with the county assessor before closing.
Climate risk First Street
- Flood 1/10 Low FEMA zone X (shaded) · 0% chance over 30 yrs
- Wildfire 1/10 Low
- Heat 10/10 Extreme 7 d/yr ≥106°F today · 27 d/yr by 30 yrs out
- Wind 10/10 Extreme 99% chance of damaging wind over 30 yrs
- Air quality 2/10 Low 1 unhealthy d/yr today · 3 by 30 yrs out
Nearby sold comps map
Loading sold comps map…
Walkable amenities ~0.75 mi
Loading nearby amenities…
Taxation est. · year 1
- Rental income
- $38,828
- − Mortgage interest
- −$20,726
- − Property taxes
- −$5,659
- − Insurance
- −$1,850
- − Repairs & maintenance
- −$3,106
- − Management
- −$3,106
- − Depreciation
- −$10,764
- Taxable loss
- −$6,382
- Est. tax savings @ 24.0%
- +$1,532
- After-tax cash flow
- $1,414/yr
For passive investors: Depreciation is non-cash, so a rental often shows a tax loss while cash-flowing — sheltering income. Rental losses are passive: they offset passive income freely, and up to $25,000/yr can offset ordinary (W-2) income if you actively participate and your MAGI is under $100k (phasing out to $0 by $150k); unused losses carry forward. On sale, claimed depreciation is recaptured at up to 25%, and gains may owe capital-gains tax (a 1031 exchange can defer both). Figures are a year-1 estimate at your 24.0% rate — not tax advice; consult a CPA.
Schools (NCES district)
- District
- Broward
- NCES district ID
- 1200180
- Math proficiency
- 42% ▼ -18.00%
- Reading proficiency
- 53% ▼ -5.00%
- Median HH income
- $52,139
- Composite
- 40.88/100
- National rank
- #3621
- State rank
- #46 of 73 in FL
Livability — Pompano Beach
- Score
- 74/100
- State rank
- #284
- US rank
- #4541
Category grades
Schools grade is shown separately in the Schools card above.
Census & demographics
- Census place
- Pompano Beach, FL
- County
- Broward County · 1,963,430 people
- City population
- 155,861
- Metro
- Miami-Fort Lauderdale-Pompano Beach, FL
- Population (ZIP)
- 37,233
- Household income
- $64,819
- Rent vs Own
- Severe rent burden
- 2870.0
Population outlook (Broward County) Hauer SSP2
- Today (2025)
- 2,207,033 people
- By 2030
- 2,360,704 · +7.0%
- By 2040
- 2,661,208 · +20.6%
- By 2050
- 2,946,698 · +33.5%
- By 2075
- 3,602,273 · +63.2%
- By 2100
- 3,970,984 · +79.9%
Race, ethnicity, and origin ACS 2023
- Neighborhood character
- Diverse neighborhood (Simpson 0.69)
- Race & ethnicity
- Black 38% White 33% Hispanic / Latino 26% Two or more races 14%
- Hispanic origin (detail)
- Mexican 9% Puerto Rican 2% Cuban 3% Dominican 1%
- Common ancestry
- Hispanic 13% Romanian 2% Slovak 1%
- Foreign-born
- 31% · Canada, Jamaica
- Languages at home
- 60% English-only · Spanish 23% French/Haitian/Cajun 13% Other Indo-European 2%
Political lean MEDSL · Broward
- 2024 margin
- D (+17.0) · D 58.0% · R 41.0%
- 2008→2024 swing
- -17.8pp toward R · 2008: 34.7pp · 2024: 17.0pp
- All cycles
- 2024: D+17.0 2020: D+29.8 2016: D+35.0 2012: D+34.9 2008: D+34.7
Not yet ingested
- Civics
- —
Market trends
- HPI YoY
- ▼ -131.09%
- Current HPI
- 425.3083
- Rent YoY
- ▲ 2.12%
- Metro
- Miami-Fort Lauderdale-Pompano Beach, FL
- State GDP YoY
- ▲ 3.28%
- F500 in state
- 36
Industry mix (Fortune 500 HQ in FL)
| Industry | F500 HQs | Revenue |
|---|---|---|
| Industrial Technology | 2 | $29B |
|
||
| Insurance | 2 | $17B |
|
||
| Retail | 1 | $60B |
|
||
| Technology Distribution | 1 | $58B |
|
||
| Homebuilding | 1 | $35B |
|
||
| Technology Manufacturing | 1 | $35B |
|
||
Price history
+64.4% since first listed9 events — show timeline
- 2026-05-17 Listed $370,000 MARMLS
- 2020-10-16 Sold (Public Records) $173,000 Public Records
- 2020-10-14 Sold (MLS) $150,000 MARMLS
- 2020-09-14 Contingent — MARMLS
- 2020-09-10 Price Changed $199,900 MARMLS
- 2020-08-22 Price Changed $209,999 MARMLS
- 2020-08-20 Price Changed $210,000 MARMLS
- 2020-08-18 Price Changed $220,000 MARMLS
- 2020-07-31 Listed $225,000 MARMLS
Property tax history
+10.4%/yrLatest (2025): $5,659 · +7.2% YoY. Source: county tax records.
Cash-flow waterfall
monthlySold comps — $/sqft
last 12 mo · ≤1 miLoading sold comps…