213 Gates Rd · Nemacolin, PA
Flood risk 1/10 · Minimal
- FEMA flood zone
- X (unshaded)
- Chance of flooding over 30 yrs
- 0.0%
- Est. flood insurance / yr
- $473 – $860
Fire risk 1/10 · Minimal
- Est. fire insurance / yr
- $511 – $949
Heat risk 3/10 · Minor
- Hot days now (above 98°F)
- 7 days/yr
- Hot days in 30 yrs
- 17 days/yr
Wind risk 2/10 · Minimal
- Chance of severe wind over 30 yrs
- —
Air-quality risk 2/10 · Minimal
- Unhealthy air days now
- 1 days/yr
- Unhealthy air days in 30 yrs
- 2 days/yr
Risk factors via First Street. Map © Google.
Why this score? — see what drove the B grade
The composite is a weighted blend of 9 inputs, each scored 0–100. Each bar is that input's sub-score; the figure is the points it added to the 100-point composite (weight × sub-score).
- Cash flow +30.0/30.0
- 1% rule +10.0/10.0
- DSCR +10.0/10.0
- ARV discount +7.5/15.0
- Appreciation +6.7/10.0
- Schools +3.0/10.0
- Livability +2.8/5.0
- Rent growth +2.5/5.0
- Condition / age +2.5/5.0
$35,000
🖨 Deal sheet 📄 Offer letter ✓ Due diligence
Listing remarks
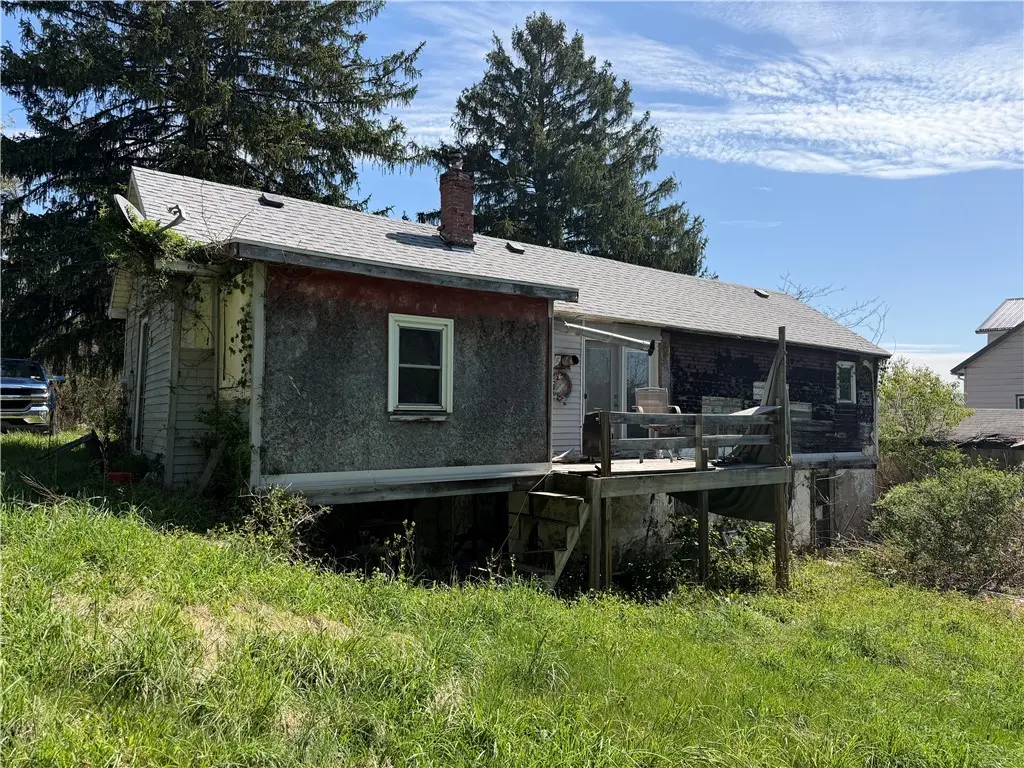
This 2-bedroom, 1-bath home offers a great opportunity to bring your vision to life. Featuring a newer roof (2023) and a spacious layout, this property sits on a generous lot with room to expand, garden, or create your ideal outdoor space. The home includes a full basement, deck, and plenty of natural light throughout. With some TLC, this could be a fantastic starter home, rental, or flip. Conveniently located and packed with potential—don’t miss your chance to transform this property into something special!
Key facts
- 2.91 acre lot
- Built 1920
- Listed 50 days
Property features AI
Finance
- HOA & community: Public transportation nearby
Exterior
- Utilities: Public water; Septic tank
- Home design: Resale property
- Construction: Asphalt roof
- Exterior features: Approximately 2.9-acre lot
Interior
- Bathrooms: 1 full bathroom
- Heating & cooling: Forced air heating; Coal heating; Central air conditioning
- Interior features: Walk-up basement
Neighborhood map
What this means for you Summary
Snapshot
- This is a 2-bed/1.0-bath single-family listed at $35k.
Deal economics
- At list price, monthly cash flow is $434 ($5k/yr) — positive.
- The deal already cash-flows at list — no discount required.
- Meets the 1% rule at list price ($868 rent vs $35k).
- Recommended offer: $34k (3.0% below list) — sets the bar for market timing.
Location & tenants
- Location reads 56/100 on livability (#1,646 in PA) — a working-class tenant base; expect higher turnover. Strengths: cost of living A+, crime A; Watch: schools F, amenities F, commute F.
- Albert Gallatin Area SD (rural): math 26% / reading 46% proficiency, ranked #419 of 539 in PA (top 78%) — families likely to look elsewhere, expect single-tenant / working-renter base with shorter leases.
- Market conditions: 5 active listings in the ZIP; 201 units permitted in Fayette County in 2024 (10 in 5+ unit buildings).
Forward outlook
- In year one you build about $1k of equity ($242 loan paydown + $1k appreciation (3.4% local appreciation)).
- Fayette County population projected at -19% by 2050 — secular population decline; favor cash flow + early exit over multi-decade hold.
- At projected returns (3.4% appreciation + 3.0% rent growth), your $10k cash investment doubles in ~2 years — after that, you're playing with house money.
Negotiation context
- It's been on market 50 days — a 3% lower offer ($34k) is reasonable based on typical stale-listing flexibility.
- Current owner paid $6k; list at $35k implies a 483% gain — meaningful room to come down on a strong offer.
Risks & watch-outs
- Watch-outs: built in 1920 — expect roof / HVAC / electrical / plumbing capex.
Questions for the listing agent
- It's been on market 50 days. Have you received any prior offers? Is the seller open to a 3% concession, seller financing, or rate buy-down credit?
- Built in 1920 — when were the roof, HVAC, electrical panel, plumbing, and water heater last replaced?
- Is there a deadline driving the sale (1031 exchange, divorce, estate, relocation)? That informs how much negotiation room exists.
- Schools are F-rated, which usually means shorter tenancies and higher turnover. Who's the typical renter profile here, and what's been the actual vacancy rate?
- What's the average days-on-market for RENTAL listings here right now (not sales)? A rising rental-DOM trend means longer vacancies and softer asking-rent achievability than the comps imply.
- What's the recent tenant-quality profile in this submarket — average credit score on applications, eviction rate, late-payment / NSF rate, and stable-employment percentage? A property-management company in the area should have these aggregated.
- How much new for-sale + rental construction is in the pipeline within 1–3 miles? Heavy new supply typically softens prices + rents 12–24 months out; constrained supply supports both.
Investment metrics
- 1% rule
- 2.48% ✓
- Cap rate
- 21.17%
- Cash-on-cash
- 53.15%
- DSCR
- 3.36
- GRM
- 3.4
CMA / ARV
- ARV (median comp)
- $152,036
- List price
- $35,000
- Delta
- -76.98%
- Verdict
- UNDERPRICED
- Comps
- 3 within 1.0 mi
Projected returns pro-forma
3.42% appreciation · 3.0% rent growth · sell at horizon
- IRR
- 58.7%
- Equity multiple
- 4.33×
- Total profit
- $32,669
- Equity at exit
- $16,577
- IRR
- 57.9%
- Equity multiple
- 8.82×
- Total profit
- $76,626
- Equity at exit
- $26,219
Cash invested: $9,800 (down + closing). Projections, not guarantees.
Landlord ↔ Tenant lean methodology
- Overall (STATE)
- 62 Landlord-Friendly
- State Pennsylvania
- 62 Landlord-Friendly · EVEN
- County
- — inherits STATE
- City
- — inherits STATE
ZIP-level market 15410
- Home prices YoY
- 2.6%
- Active inventory
- 5
- Price-to-rent
- 3.4×
Monthly cashflow live
- Estimated rent
- $868 medium interval (Pro) →
- Mortgage (P&I)
- −$184
- Tax from tax record
- −$53 /mo · $640/yr
- Insurance
- −$15
- HOA
- −$0
- Vacancy / Maint / Mgmt
- −$182
- Net cashflow
- $434
Break-even live
UW: 25.0% down · 7.5% · 30yr · 1.5% tax · 5.0% vac · 8.0% maint · 8.0% mgmt
Financing live
Cash to close
- Down payment
- $8,750
- Closing costs
- $1,050
- Reserves months
- —
- Total cash needed
- —
Loan-product check · same deal, 3 products live
Conventional
25% down · 7.5% · 30yr
- Down + closing
- —
- Monthly P&I
- —
- Monthly cashflow
- —
- DSCR
- —
- Eligible?
- —
Personal DTI + credit; lowest rate.
DSCR
20% down · 8.5% · 30yr
- Down + closing
- —
- Monthly P&I
- —
- Monthly cashflow
- —
- DSCR
- —
- Eligible?
- —
No personal income docs; deal must DSCR.
Hard money
10% down · 12.0% · 12mo
- Down + closing
- —
- Monthly P&I
- —
- Monthly cashflow
- —
- DSCR
- —
- Eligible?
- —
Short-term bridge; refi at stabilization.
Listing history 17 events
-
2026-06-17status $35,000 Pending 50 DOM
-
2026-06-17days on market $35,000 Active 50 DOM
-
2026-06-16days on market $35,000 Active 49 DOM
-
2026-06-15days on market $35,000 Active 48 DOM
-
2026-06-14days on market $35,000 Active 46 DOM
-
2026-06-13days on market $35,000 Active 45 DOM
-
2026-06-10days on market $35,000 Active 43 DOM
-
2026-06-09days on market $35,000 Active 42 DOM
-
2026-06-08days on market $35,000 Active 41 DOM
-
2026-06-07pricedays on market $35,000 Active 40 DOM
-
2026-06-02days on market $40,000 Active 35 DOM
-
2026-06-01days on market $40,000 Active 34 DOM
-
2026-05-31days on market $40,000 Active 33 DOM
-
2026-05-30days on market $40,000 Active 32 DOM
-
2026-05-13price $40,000 525-char remark
-
2026-04-22$55,000 Active 525-char remark
-
2001-07-05soldstatus $6,000
ⓘ Source: listings_history table (triggers on properties + properties_extension) + one-shot
backfill from property_details.listing_events for pre-trigger history.
Tax reassessment forecast PA · Partial reset (capped growth)
- Current annual tax
- $640 · $53/mo
- Projected year-2 tax
- $640 · $53/mo
- Expected delta
- $0/yr ($0/mo · 0.0%)
ⓘ Screening estimate from a state-policy table — verify with the county assessor before closing.
Climate risk First Street
- Flood 1/10 Low FEMA zone X (unshaded) · 0% chance over 30 yrs
- Wildfire 1/10 Low
- Heat 3/10 Moderate 7 d/yr ≥98°F today · 17 d/yr by 30 yrs out
- Wind 2/10 Low
- Air quality 2/10 Low 1 unhealthy d/yr today · 2 by 30 yrs out
Nearby sold comps map
Loading sold comps map…
Walkable amenities ~0.75 mi
Loading nearby amenities…
Taxation est. · year 1
- Rental income
- $10,413
- − Mortgage interest
- −$1,961
- − Property taxes
- −$640
- − Insurance
- −$175
- − Repairs & maintenance
- −$833
- − Management
- −$833
- − Depreciation
- −$1,018
- Taxable income
- $4,953
- Est. tax owed @ 24.0%
- −$1,189
- After-tax cash flow
- $4,020/yr
For passive investors: Depreciation is non-cash, so a rental often shows a tax loss while cash-flowing — sheltering income. Rental losses are passive: they offset passive income freely, and up to $25,000/yr can offset ordinary (W-2) income if you actively participate and your MAGI is under $100k (phasing out to $0 by $150k); unused losses carry forward. On sale, claimed depreciation is recaptured at up to 25%, and gains may owe capital-gains tax (a 1031 exchange can defer both). Figures are a year-1 estimate at your 24.0% rate — not tax advice; consult a CPA.
Schools (NCES district)
- District
- Albert Gallatin Area SD
- NCES district ID
- 4202100
- Math proficiency
- 26% ▼ -15.00%
- Reading proficiency
- 46% ▼ -7.00%
- Median HH income
- $36,456
- Composite
- 29.8/100
- National rank
- #6422
- State rank
- #419 of 539 in PA
Livability — Nemacolin
- Score
- 56/100
- State rank
- #1646
- US rank
- #22792
Category grades
Schools grade is shown separately in the Schools card above.
Census & demographics
- City population
- 1,107
- Population (ZIP)
- 992
Population outlook (Fayette County) Hauer SSP2
- Today (2025)
- 127,561 people
- By 2030
- 123,206 · -3.4%
- By 2040
- 113,232 · -11.2%
- By 2050
- 103,468 · -18.9%
- By 2075
- 83,185 · -34.8%
- By 2100
- 62,384 · -51.1%
Race, ethnicity, and origin ACS 2023
- Neighborhood character
- Predominantly White (100%)
- Race & ethnicity
- White 100%
- Common ancestry
- Romanian 21% Lithuanian 6% Slovene 1%
Political lean MEDSL · Fayette
- 2024 margin
- Solid R (+37.9) · D 30.8% · R 68.7%
- 2008→2024 swing
- -37.5pp toward R · 2008: -0.4pp · 2024: -37.9pp
- All cycles
- 2024: R+37.9 2020: R+33.5 2016: R+31.0 2012: R+8.3 2008: R+0.4
Not yet ingested
- Civics
- —
Market trends
- HPI YoY
- ▲ 3.42%
- Current HPI
- 134.9824
- Rent YoY
- —
- Metro
- —
- State GDP YoY
- ▲ 1.68%
- F500 in state
- 34
Industry mix (Fortune 500 HQ in PA)
| Industry | F500 HQs | Revenue |
|---|---|---|
| Healthcare | 2 | $309B |
|
||
| Insurance | 2 | $27B |
|
||
| Telecommunications / Media | 1 | $124B |
|
||
| Industrial Distribution | 1 | $22B |
|
||
| Financial Services | 1 | $20B |
|
||
| Chemicals / Materials | 1 | $18B |
|
||
Price history
+483.3% since first listed5 events — show timeline
- 2026-06-17 Pending — West Penn MLS
- 2026-06-03 Price Changed $35,000 West Penn MLS
- 2026-05-13 Price Changed $40,000 West Penn MLS
- 2026-04-22 Listed $55,000 West Penn MLS
- 2001-07-05 Sold (Public Records) $6,000 Public Records
Property tax history
+2.9%/yrLatest (2026): $640 · +0.0% YoY. Source: county tax records.
Cash-flow waterfall
monthlySold comps — $/sqft
last 12 mo · ≤1 miLoading sold comps…