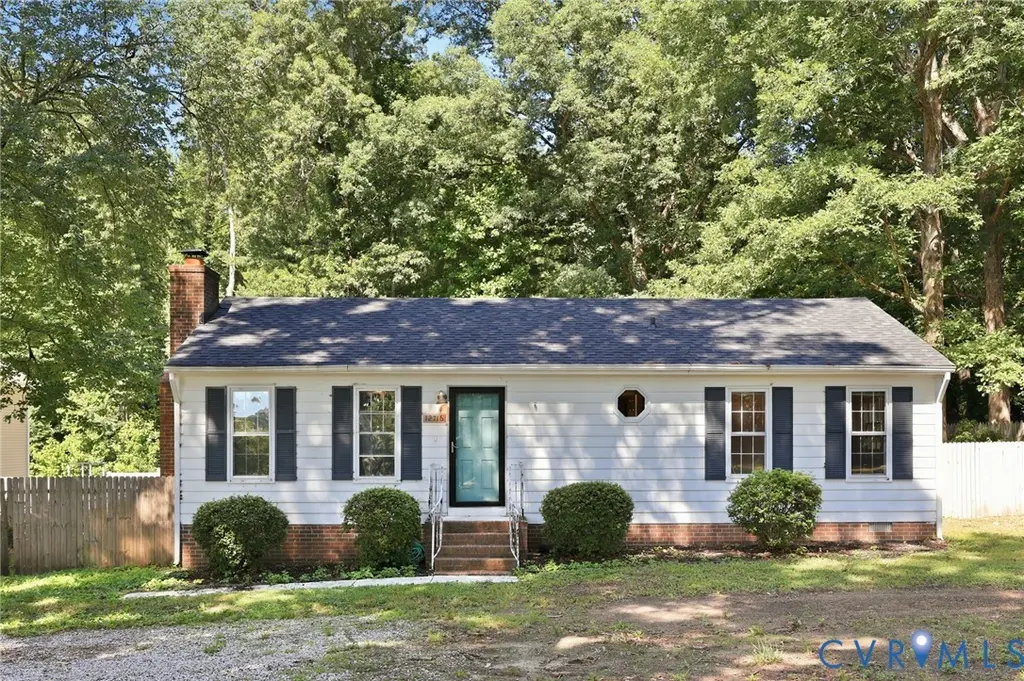
12716 S Chester Rd · Chester, VA
Flood risk 1/10 · Minimal
- FEMA flood zone
- X (unshaded)
- Chance of flooding over 30 yrs
- 0.0%
- Est. flood insurance / yr
- $507 – $1,088
Fire risk 3/10 · Minor
- Est. fire insurance / yr
- $666 – $1,236
Heat risk 7/10 · Major
- Hot days now (above 107°F)
- 7 days/yr
- Hot days in 30 yrs
- 16 days/yr
Wind risk 6/10 · Moderate
- Chance of severe wind over 30 yrs
- 27.0%
Air-quality risk 2/10 · Minimal
- Unhealthy air days now
- 0 days/yr
- Unhealthy air days in 30 yrs
- 1 days/yr
Risk factors via First Street. Map © Google.
Why this score? — see what drove the C- grade
The composite is a weighted blend of 9 inputs, each scored 0–100. Each bar is that input's sub-score; the figure is the points it added to the 100-point composite (weight × sub-score).
- Cash flow +17.7/30.0
- ARV discount +10.6/15.0
- DSCR +5.6/10.0
- Schools +5.2/10.0
- 1% rule +4.1/10.0
- Livability +3.7/5.0
- Rent growth +3.0/5.0
- Condition / age +2.5/5.0
- Appreciation +0.0/10.0
$225,000
🖨 Deal sheet 📄 Offer letter ✓ Due diligence
Listing remarks MLS
Come see this tastefully updated home in Chester! Situated on almost half an acre, this three bedroom turnkey home has so much to offer and is a must-see! Featuring a spacious Family/Living Room that is very welcoming with a brick Fireplace, an abundance of natural light, ceiling fan and new flooring. Enter the stunning Kitchen with so many updates! All new appliances, flooring, gorgeous back splash and custom decorative touches. Other interior features are neutral interior paint, stylish fixtures & hardware and updated bath! The exterior has been repainted!! Enjoy the expansive back deck which is perfect for entertaining or relaxing after a long day. This lovely HUGE back yard borders a nature barrier and is fenced, which gives the new buyer more privacy! Come see this one today!!
Key facts
- Renovated bathroom
- Spacious backyard
- Park-like lot
Tags
Property features AI
Exterior
- Parking: Driveway parking; No garage; Unpaved drive
- Utilities: Public water; Septic tank sewer
- Home design: Single-story home; Resale property
- Construction: Frame construction with drywall and hardboard; Composition roof; Crawl space foundation; Built (actual year recorded)
- Exterior features: Deck; Stoop; Outdoor lighting; Storage shed; Shed(s); Unpaved driveway; Fenced yard (mixed, privacy)
Interior
- Kitchen: Dishwasher; Stove/Range; Range hood
- Bedrooms: Two main-level bedrooms; Additional main-level bedroom
- Flooring: Laminate; Partially carpeted
- Bathrooms: One full bathroom with tub and shower
- Heating & cooling: Electric baseboard heating; Central air conditioning
- Interior features: Ceiling fan(s); Eat-in kitchen; Main level primary; Masonry wood-burning fireplace (1)
- Laundry & utility: Washer hookup; Dryer hookup; Electric water heater
Neighborhood map
What this means for you Summary
Snapshot
- This is a 3-bed/1.0-bath single-family listed at $225k.
Deal economics
- At list price, monthly cash flow is $183 ($2k/yr) — positive.
- The deal already cash-flows at list — no discount required.
- To meet the 1% rule (rent ≥ 1% of price), the offer needs to be $206k (8.5% below list).
- Recommended offer: $206k (8.5% below list) — sets the bar for 1% rule.
- Cap rate 7.3% vs local median 3.6% in Chester — top-decile yield for the area; either an underpriced asset or a hidden risk that comps aren't pricing in. Stress-test before assuming the spread holds.
Location & tenants
- Location reads 73/100 on livability (#170 in VA) — a middle-class / working-renter tenant base. Strengths: housing A+, health & safety A+, schools A-; Watch: amenities F, commute F.
- Chesterfield County Public School District (suburban): math 52% / reading 64% proficiency, ranked #57 of 131 in VA (top 44%) — acceptable for families but not a draw, mixed tenant base, ~2y average lease.
- Market conditions: Rents rising (+2.0%/yr); 215 active listings in the ZIP; 2 comparable units currently listed for rent nearby; solid renter incomes; 2,307 units permitted in Chesterfield County in 2024 (462 in 5+ unit buildings).
Forward outlook
- Local home prices are declining (-3.0%/yr); year-one equity from $2k of loan paydown is wiped out by about $7k of value loss. Plan a longer hold.
- Chesterfield County population projected at +20% by 2050 — long-run rental-demand tailwind backs the buy-and-hold thesis.
Negotiation context
- Only 5 days on market — expect competitive offers; lowballing is unlikely to land.
- 7 sale attempts since 24y ago with the ask held roughly flat each time — persistent listings suggest the price (not the market) is what's stuck; bring a comps-based counter.
- Current owner paid $196k; 15% above their basis — modest negotiation headroom, anchor on the comps not their cost.
Risks & watch-outs
- Climate carrying-cost: major wind risk, 27% chance of damaging wind over 30y; extreme-heat days projected 7→16/yr by 2055 (HVAC capex compounding) — expect insurance premiums to compound above CPI over the hold.
Questions for the listing agent
- Is there a deadline driving the sale (1031 exchange, divorce, estate, relocation)? That informs how much negotiation room exists.
- Schools are A-rated — typically a magnet for longer-tenancy family renters. What's the average tenant stay here, and is there a school-zone premium baked into asking?
- What's the average days-on-market for RENTAL listings here right now (not sales)? A rising rental-DOM trend means longer vacancies and softer asking-rent achievability than the comps imply.
- What's the recent tenant-quality profile in this submarket — average credit score on applications, eviction rate, late-payment / NSF rate, and stable-employment percentage? A property-management company in the area should have these aggregated.
- How much new for-sale + rental construction is in the pipeline within 1–3 miles? Heavy new supply typically softens prices + rents 12–24 months out; constrained supply supports both.
Investment metrics
- 1% rule
- 0.91% ✗
- Cap rate
- 7.27%
- Cash-on-cash
- 3.49%
- DSCR
- 1.16
- GRM
- 9.1
CMA / ARV
- ARV (on-the-fly)
- $241,488
- Comps found
- 3
Show comp detail 3 sales within ~0.75 mi
| Address | Dist | Beds/Ba | Sqft | Sold | Price | $/sf | Match |
|---|---|---|---|---|---|---|---|
| 12220 Harrowgate Rd | 0.61mi | 3/1.0 | 1,131 (+10%) | 7mo | $265,000 | $234 | 50 |
| 4342 Lafon St | 0.62mi | 2/1.0 (-1) | 1,134 (+10%) | 17mo | $250,000 | $220 | 36 |
| 12733 Richmond St | 0.65mi | 3/1.5 | 1,128 (+9%) | 22mo | $275,000 | $244 | 34 |
Match score weights: distance 35% · size 25% · config 20% · recency 20%. Top-matched comps best support the ARV.
Projected returns pro-forma
-3.0% appreciation · 2.05% rent growth · sell at horizon
- IRR
- -11.8%
- Equity multiple
- 0.57×
- Total profit
- $-26,779
- Equity at exit
- $33,548
- IRR
- -4.1%
- Equity multiple
- 0.74×
- Total profit
- $-16,294
- Equity at exit
- $19,454
Cash invested: $63,000 (down + closing). Projections, not guarantees.
Landlord ↔ Tenant lean methodology
- Overall (STATE)
- 55 Moderately Landlord-Leaning
- State Virginia
- 55 Moderately Landlord-Leaning · D+2
- County
- — inherits STATE
- City
- — inherits STATE
ZIP-level market 23831
- Rents YoY
- 2.0%
- Active inventory
- 215
- Price-to-rent
- 9.1×
Monthly cashflow live
- Estimated rent
- $2,058 medium interval (Pro) →
- Mortgage (P&I)
- −$1,180
- Tax from tax record
- −$169 /mo · $2,027/yr
- Insurance
- −$94
- HOA
- −$0
- Vacancy / Maint / Mgmt
- −$432
- Net cashflow
- $183
Break-even live
UW: 25.0% down · 7.5% · 30yr · 1.5% tax · 5.0% vac · 8.0% maint · 8.0% mgmt
Financing live
Cash to close
- Down payment
- $56,250
- Closing costs
- $6,750
- Reserves months
- —
- Total cash needed
- —
Loan-product check · same deal, 3 products live
Conventional
25% down · 7.5% · 30yr
- Down + closing
- —
- Monthly P&I
- —
- Monthly cashflow
- —
- DSCR
- —
- Eligible?
- —
Personal DTI + credit; lowest rate.
DSCR
20% down · 8.5% · 30yr
- Down + closing
- —
- Monthly P&I
- —
- Monthly cashflow
- —
- DSCR
- —
- Eligible?
- —
No personal income docs; deal must DSCR.
Hard money
10% down · 12.0% · 12mo
- Down + closing
- —
- Monthly P&I
- —
- Monthly cashflow
- —
- DSCR
- —
- Eligible?
- —
Short-term bridge; refi at stabilization.
Rent comps 2 comps
| Address | Beds | Baths | Sqft | Rent | $/sqft | DOM | Units | Dist |
|---|---|---|---|---|---|---|---|---|
| 11701 Chester Village Dr Chester, VA | 2.0 | 1.0 | 958 | $1,758 | $1.83 | 1d | 5 | 1.05mi |
| 11625 Chester Station Dr Chester, VA | 3.0 | 2.0 | 1440 | $2,100 | $1.46 | 23d | 1 | 1.28mi |
Listing history 6 events
-
2026-06-18days on market $225,000 Active 5 DOM
-
2026-06-17days on market $225,000 Active 4 DOM
-
2026-06-16days on market $225,000 Active 3 DOM
-
2026-06-15days on market $225,000 Active 2 DOM
-
2026-06-13remarks 687-char remark
-
2026-06-13$225,000 Active 1 DOM
ⓘ Source: listings_history table (triggers on properties + properties_extension) + one-shot
backfill from property_details.listing_events for pre-trigger history.
Tax reassessment forecast VA · Resets to sale price
- Current annual tax
- $2,027 · $169/mo
- Projected year-2 tax
- $2,027 · $169/mo
- Expected delta
- $0/yr ($0/mo · 0.0%)
ⓘ Screening estimate from a state-policy table — verify with the county assessor before closing.
Climate risk First Street
- Flood 1/10 Low FEMA zone X (unshaded) · 0% chance over 30 yrs
- Wildfire 3/10 Moderate
- Heat 7/10 Severe 7 d/yr ≥107°F today · 16 d/yr by 30 yrs out
- Wind 6/10 Major 27% chance of damaging wind over 30 yrs
- Air quality 2/10 Low 0 unhealthy d/yr today · 1 by 30 yrs out
Nearby sold comps map
Loading sold comps map…
Walkable amenities ~0.75 mi
Loading nearby amenities…
Taxation est. · year 1
- Rental income
- $24,695
- − Mortgage interest
- −$12,603
- − Property taxes
- −$2,027
- − Insurance
- −$1,125
- − Repairs & maintenance
- −$1,976
- − Management
- −$1,976
- − Depreciation
- −$6,545
- Taxable loss
- −$1,557
- Est. tax savings @ 24.0%
- +$374
- After-tax cash flow
- $2,572/yr
For passive investors: Depreciation is non-cash, so a rental often shows a tax loss while cash-flowing — sheltering income. Rental losses are passive: they offset passive income freely, and up to $25,000/yr can offset ordinary (W-2) income if you actively participate and your MAGI is under $100k (phasing out to $0 by $150k); unused losses carry forward. On sale, claimed depreciation is recaptured at up to 25%, and gains may owe capital-gains tax (a 1031 exchange can defer both). Figures are a year-1 estimate at your 24.0% rate — not tax advice; consult a CPA.
Schools (NCES district)
- District
- Chesterfield County Public School District
- NCES district ID
- 5100840
- Math proficiency
- 52% ▼ -30.00%
- Reading proficiency
- 64% ▼ -15.00%
- Median HH income
- $72,821
- Composite
- 51.56/100
- National rank
- #1712
- State rank
- #57 of 131 in VA
Livability — Chester
- Score
- 73/100
- State rank
- #170
- US rank
- #5369
Category grades
Schools grade is shown separately in the Schools card above.
Census & demographics
- Census place
- Chester, VA
- County
- Chesterfield County · 406,988 people
- City population
- 54,827
- Metro
- Richmond, VA
- Population (ZIP)
- 39,529
- Household income
- $95,750
- Rent vs Own
- Severe rent burden
- 952.0
Population outlook (Chesterfield County) Hauer SSP2
- Today (2025)
- 377,190 people
- By 2030
- 395,710 · +4.9%
- By 2040
- 427,694 · +13.4%
- By 2050
- 452,706 · +20.0%
- By 2075
- 505,533 · +34.0%
- By 2100
- 521,282 · +38.2%
Race, ethnicity, and origin ACS 2023
- Neighborhood character
- Diverse neighborhood (Simpson 0.62)
- Race & ethnicity
- White 53% Black 30% Hispanic / Latino 10% Two or more races 7% Asian 3%
- Hispanic origin (detail)
- Mexican 1% Puerto Rican 3%
- Common ancestry
- Italian 1% Slovak 1% Romanian 1%
- Foreign-born
- 7% · Canada, China, South Korea
- Languages at home
- 90% English-only · Spanish 6% German/W. Germanic 1% Other Indo-European 1%
Political lean MEDSL · Chesterfield
- 2024 margin
- Lean D (+9.0) · D 53.8% · R 44.8% · Other 1.4%
- 2008→2024 swing
- +16.4pp toward D · 2008: -7.5pp · 2024: 9.0pp
- All cycles
- 2024: D+9.0 2020: D+6.7 2016: R+2.2 2012: R+7.1 2008: R+7.5
Not yet ingested
- Civics
- —
Market trends
- HPI YoY
- ▼ -212.93%
- Current HPI
- 252.2448
- Rent YoY
- ▲ 2.05%
- Metro
- Richmond, VA
- State GDP YoY
- ▲ 2.40%
- F500 in state
- 50
Industry mix (Fortune 500 HQ in VA)
| Industry | F500 HQs | Revenue |
|---|---|---|
| Aerospace / Defense | 4 | $236B |
|
||
| Technology / Defense | 3 | $32B |
|
||
| Financial Services | 2 | $176B |
|
||
| Utilities | 2 | $27B |
|
||
| Insurance | 2 | $25B |
|
||
| Technology | 2 | $15B |
|
||
Price history
+257.1% since first listed21 events — show timeline
- 2026-06-13 Listed $225,000 CVRMLS
- 2020-05-06 Sold (Public Records) $195,500 Public Records
- 2020-05-05 Sold (MLS) $195,500 CVRMLS
- 2020-04-06 Pending — CVRMLS
- 2020-04-04 Listed $189,999 CVRMLS
- 2012-08-16 Sold (Public Records) $124,000 Public Records
- 2012-08-15 Sold (MLS) $124,000 CVRMLS
- 2012-07-12 Listing Removed — CVRMLS
- 2012-06-05 Listed $125,000 CVRMLS
- 2005-09-22 Sold (Public Records) $129,950 Public Records
- 2003-10-14 Sold (Public Records) $105,000 Public Records
- 2003-10-10 Sold (MLS) $105,000 CVRMLS
- 2003-10-10 Sold (MLS) $105,000 CVRMLS
- 2003-08-27 Listed $105,000 CVRMLS
- 2003-08-27 Listed $105,000 CVRMLS
- 2002-10-29 Sold (Public Records) $94,950 Public Records
- 2002-10-28 Sold (MLS) $94,950 CVRMLS
- 2002-10-02 Listed $94,950 CVRMLS
- 2002-10-02 Listed $94,950 CVRMLS
- 1992-02-18 Sold (Public Records) $68,500 Public Records
- 1989-09-26 Sold (Public Records) $63,000 Public Records
Property tax history
+4.5%/yrLatest (2025): $2,027 · +3.4% YoY. Source: county tax records.
Cash-flow waterfall
monthlySold comps — $/sqft
last 12 mo · ≤1 miLoading sold comps…