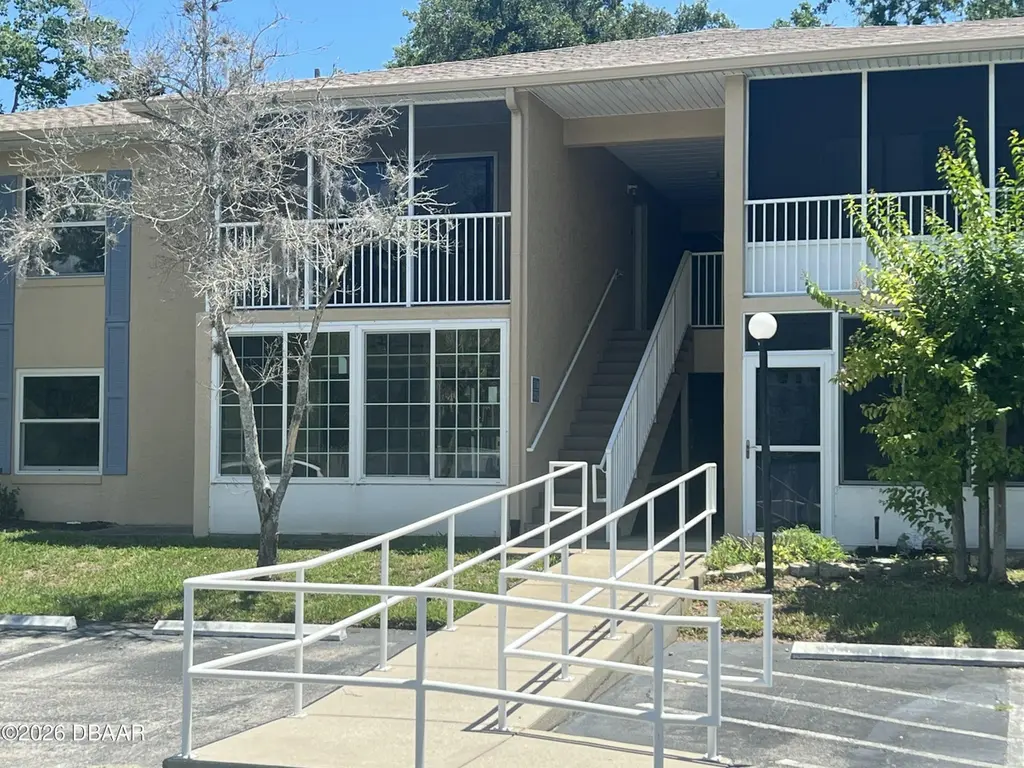
678 Wellington Station Blvd #58 · Ormond Beach, FL
Flood risk 1/10 · Minimal
- FEMA flood zone
- X (unshaded)
- Chance of flooding over 30 yrs
- 0.0%
- Est. flood insurance / yr
- $507 – $1,088
Fire risk 3/10 · Minor
- Est. fire insurance / yr
- $947 – $1,759
Heat risk 9/10 · Severe
- Hot days now (above 105°F)
- 7 days/yr
- Hot days in 30 yrs
- 20 days/yr
Wind risk 10/10 · Severe
- Chance of severe wind over 30 yrs
- 99.0%
Air-quality risk 3/10 · Minor
- Unhealthy air days now
- 3 days/yr
- Unhealthy air days in 30 yrs
- 3 days/yr
Risk factors via First Street. Map © Google.
Why this score? — see what drove the D- grade
The composite is a weighted blend of 9 inputs, each scored 0–100. Each bar is that input's sub-score; the figure is the points it added to the 100-point composite (weight × sub-score).
- Cash flow +8.9/30.0
- 1% rule +7.5/10.0
- ARV discount +7.5/15.0
- Livability +4.2/5.0
- Schools +3.9/10.0
- Rent growth +2.9/5.0
- DSCR +2.5/10.0
- Condition / age +2.5/5.0
- Appreciation +0.0/10.0
$140,000
🖨 Deal sheet 📄 Offer letter ✓ Due diligence
Listing remarks
Looking for a condo in Ormond Beach with great amenities and an unbeatable location? This 2 bedroom, 2 bath second-floor unit in Wellington Station offers a spacious, open layout with vaulted ceilings, abundant natural light that adds warmth and character to the living space. The kitchen features a convenient eat-in area, while the screened porch provides the perfect spot to enjoy your morning coffee or evening breeze. Wellington Station is one of Ormond Beach's most unique communities, featuring a swimming pool, tennis/pickleball courts, clubhouse, and its signature historic railcars that give the neighborhood distinctive charm. Ideally located just minutes from the beach, shopping, dining
Key facts
- Swimming pool
- Screened porch
- Cozy fireplace
Tags
Property features AI
Finance
- Other: Publicly maintained asphalt city street access; Subdivision: Wellington Station Condo Residences
- HOA & community: Has homeowners association; Monthly association fee; Community clubhouse; Community pool; Tennis courts; Maintenance of grounds and structures included; Pest control included; Trash service included; Cable and internet included; Association fee amount disclosed
Exterior
- Parking: Additional parking; Assigned parking
- Utilities: Public water; Public sewer; Electricity connected; Sewer connected; Water connected
- Home design: Residential condominium; One level with entry on level 2; Faces southwest
- Construction: Block, concrete and stucco construction; Slab foundation
- Exterior features: Tennis court(s); Has view
Interior
- Kitchen: Refrigerator; Microwave; Electric range; Dishwasher
- Bedrooms: 5 total rooms (includes bedrooms and living areas)
- Flooring: Carpet; Vinyl
- Bathrooms: 2 full bathrooms
- Heating & cooling: Electric heating; Electric cooling
- Interior features: Furnished negotiable; Balcony; Screened porch
- Laundry & utility: In-unit laundry
Neighborhood map
What this means for you Summary
Snapshot
- This is a 2-bed/2.0-bath condo listed at $140k.
Deal economics
- At list price, monthly cash flow is $-113 ($-1k/yr) — negative.
- To cash-flow at today's rent, offer at most $120k (14.3% below list).
- Meets the 1% rule at list price ($2k rent vs $140k).
- Recommended offer: $120k (14.3% below list) — sets the bar for cash-flow.
- Cap rate 5.3% vs local median 3.9% in Ormond Beach — top-decile yield for the area; either an underpriced asset or a hidden risk that comps aren't pricing in. Stress-test before assuming the spread holds.
Location & tenants
- Location reads 83/100 on livability (#55 in FL, #965 nationally) — a professional / high-income tenant draw. Strengths: amenities A+, housing A+, health & safety A+; Watch: commute F.
- Volusia (suburban): math 44% / reading 49% proficiency, ranked #47 of 73 in FL (top 64%) — families likely to look elsewhere, expect single-tenant / working-renter base with shorter leases.
- Zoned schools: Tomoka Elementary School (math 62% / reading 61%, grade B, #634 of 2,144 statewide, top 30%, 709 students, 50% FRL); David C. Hinson Sr. Middle School (math 52% / reading 49%, grade C, #246 of 571 statewide, top 44%, 950 students, 52% FRL); Mainland High School (math 30% / reading 37%, grade F, #400 of 667 statewide, top 61%, 1,855 students, 64% FRL) — zoned schools at 56% FRL track the district average.
- Market conditions: Rents rising (+1.6%/yr); 985 active listings in the ZIP; 5 comparable units currently listed for rent nearby; rentals at typical pace (median 14d on market — plan ~3-4 weeks tenant-placement turnaround); 3,402 units permitted in Volusia County in 2024 (681 in 5+ unit buildings).
Forward outlook
- Local home prices are declining (-3.0%/yr); year-one equity from $968 of loan paydown is wiped out by about $4k of value loss. Plan a longer hold.
- Volusia County population projected at +19% by 2050 — long-run rental-demand tailwind backs the buy-and-hold thesis.
Negotiation context
- It's been on market 28 days — a 2% lower offer ($138k) is reasonable based on typical stale-listing flexibility.
- 5 sale attempts since 3y ago with the ask held roughly flat each time — persistent listings suggest the price (not the market) is what's stuck; bring a comps-based counter.
- Current owner paid $61k; list at $140k implies a 130% gain — meaningful room to come down on a strong offer.
Risks & watch-outs
- Watch-outs: HOA is 30% of rent.
- Climate carrying-cost: severe wind risk, 99% chance of damaging wind over 30y; extreme-heat days projected 7→20/yr by 2055 (HVAC capex compounding) — expect insurance premiums to compound above CPI over the hold.
Questions for the listing agent
- What do current leases actually rent for vs. the listed asking? Can we see a recent rent roll and the last 12 months of T-12 income?
- What does the HOA fee cover, when was the last increase, and are there any pending special assessments or reserve-fund shortfalls?
- Any open or pending special assessments — roof, HVAC, plumbing, elevator, façade? What's the per-unit balance and payoff schedule, and is the seller paying it off at close or rolling it to the buyer?
- Is there a deadline driving the sale (1031 exchange, divorce, estate, relocation)? That informs how much negotiation room exists.
- Schools are B-rated — typically a magnet for longer-tenancy family renters. What's the average tenant stay here, and is there a school-zone premium baked into asking?
- The area grade is low — what's the realistic commute time and amenity access for the typical tenant pool here? Any planned neighborhood developments (good or bad) we should know about?
- What's the average days-on-market for RENTAL listings here right now (not sales)? A rising rental-DOM trend means longer vacancies and softer asking-rent achievability than the comps imply.
- What's the recent tenant-quality profile in this submarket — average credit score on applications, eviction rate, late-payment / NSF rate, and stable-employment percentage? A property-management company in the area should have these aggregated.
- How much new apartment / multifamily construction is in the pipeline within 1–3 miles? Heavy new supply (>2% of stock underway) typically softens rents 12–24 months out; light construction supports rent growth.
Investment metrics
- 1% rule
- 1.25% ✓
- Cap rate
- 5.32%
- Cash-on-cash
- -3.46%
- DSCR
- 0.85
- GRM
- 6.6
CMA / ARV
No comps found within radius.
Projected returns pro-forma
-3.0% appreciation · 1.64% rent growth · sell at horizon
- IRR
- -24.2%
- Equity multiple
- 0.19×
- Total profit
- $-31,908
- Equity at exit
- $20,874
- IRR
- -26.1%
- Equity multiple
- -0.15×
- Total profit
- $-45,088
- Equity at exit
- $12,105
Cash invested: $39,200 (down + closing). Projections, not guarantees.
Landlord ↔ Tenant lean methodology
- Overall (STATE)
- 87 Strongly Landlord-Friendly
- State Florida
- 87 Strongly Landlord-Friendly · R+3
- County
- — inherits STATE
- City
- — inherits STATE
ZIP-level market 32174
- Rents YoY
- 1.6%
- Active inventory
- 985
- Price-to-rent
- 6.6×
Monthly cashflow live
- Estimated rent
- $1,755 high interval (Pro) →
- Mortgage (P&I)
- −$734
- Tax from tax record
- −$181 /mo · $2,175/yr
- Insurance
- −$58
- HOA
- −$526
- Vacancy / Maint / Mgmt
- −$369
- Net cashflow
- $-113
Break-even live
UW: 25.0% down · 7.5% · 30yr · 1.5% tax · 5.0% vac · 8.0% maint · 8.0% mgmt
Financing live
Cash to close
- Down payment
- $35,000
- Closing costs
- $4,200
- Reserves months
- —
- Total cash needed
- —
Loan-product check · same deal, 3 products live
Conventional
25% down · 7.5% · 30yr
- Down + closing
- —
- Monthly P&I
- —
- Monthly cashflow
- —
- DSCR
- —
- Eligible?
- —
Personal DTI + credit; lowest rate.
DSCR
20% down · 8.5% · 30yr
- Down + closing
- —
- Monthly P&I
- —
- Monthly cashflow
- —
- DSCR
- —
- Eligible?
- —
No personal income docs; deal must DSCR.
Hard money
10% down · 12.0% · 12mo
- Down + closing
- —
- Monthly P&I
- —
- Monthly cashflow
- —
- DSCR
- —
- Eligible?
- —
Short-term bridge; refi at stabilization.
Rent comps 5 comps
| Address | Beds | Baths | Sqft | Rent | $/sqft | DOM | Units | Dist |
|---|---|---|---|---|---|---|---|---|
| 1707 Evergreen St Ormond Beach, FL | 2.0 | 1.0 | 868 | $1,750 | $2.02 | 23d | 1 | 1.03mi |
| 410 Sauls St Ormond Beach, FL | 3.0 | 1.0 | 990 | $1,500 | $1.52 | 23d | 1 | 1.11mi |
| 1088 W Granada Blvd Ormond Beach, FL | 1.0–2.0 | 1.0–2.0 | 950 | $1,570 | $1.65 | 11d | 8 | 1.14mi |
| 1615 Derbyshire Rd Daytona Beach, FL | 3.0 | 1.5 | 1000 | $1,950 | $1.95 | 14d | 1 | 1.24mi |
| 500 Shadow Lakes Blvd Ormond Beach, FL | 1.0–2.0 | 1.0–2.0 | 856 | $1,645 | $1.92 | 11d | 15 | 1.46mi |
HOA detail condo
- Monthly dues
- $526 · $6,312/yr
- Likely covers
- pool
- Assessments
- None detected in remarks — confirm with the listing agent.
Listing history 28 events
-
2026-06-18days on market $140,000 Active 28 DOM
-
2026-06-17days on market $140,000 Active 27 DOM
-
2026-06-16days on market $140,000 Active 26 DOM
-
2026-06-15days on market $140,000 Active 25 DOM
-
2026-06-14days on market $140,000 Active 23 DOM
-
2026-06-10days on market $140,000 Active 20 DOM
-
2026-06-09days on market $140,000 Active 19 DOM
-
2026-06-08days on market $140,000 Active 18 DOM
-
2026-06-07days on market $140,000 Active 17 DOM
-
2026-06-05days on market $140,000 Active 14 DOM
-
2026-06-03days on market $140,000 Active 13 DOM
-
2026-06-03days on market $140,000 Active 12 DOM
-
2026-06-01days on market $140,000 Active 11 DOM
-
2026-05-31days on market $140,000 Active 10 DOM
-
2026-05-31days on market $140,000 Active 9 DOM
-
2026-05-21$140,000 Active
-
2026-04-10historical
-
2026-03-10price $140,000
-
2025-08-26$160,000 Active
-
2025-06-30historical
-
2025-02-22price $179,000
-
2024-07-03$189,000 Active
-
2024-06-01historical
-
2023-11-03$190,000 Active
-
2023-11-01historical
-
2023-05-12price $200,000
-
2023-03-13$210,000 Active
-
1997-10-13soldstatus $60,900
ⓘ Source: listings_history table (triggers on properties + properties_extension) + one-shot
backfill from property_details.listing_events for pre-trigger history.
Tax reassessment forecast FL · Resets to sale price
- Current annual tax
- $2,175 · $181/mo
- Projected year-2 tax
- $2,175 · $181/mo
- Expected delta
- $0/yr ($0/mo · 0.0%)
ⓘ Screening estimate from a state-policy table — verify with the county assessor before closing.
Climate risk First Street
- Flood 1/10 Low FEMA zone X (unshaded) · 0% chance over 30 yrs
- Wildfire 3/10 Moderate
- Heat 9/10 Extreme 7 d/yr ≥105°F today · 20 d/yr by 30 yrs out
- Wind 10/10 Extreme 99% chance of damaging wind over 30 yrs
- Air quality 3/10 Moderate 3 unhealthy d/yr today · 3 by 30 yrs out
Nearby sold comps map
Loading sold comps map…
Walkable amenities ~0.75 mi
Loading nearby amenities…
Taxation est. · year 1
- Rental income
- $21,063
- − Mortgage interest
- −$7,842
- − Property taxes
- −$2,175
- − Insurance
- −$700
- − Repairs & maintenance
- −$1,685
- − Management
- −$1,685
- − HOA
- −$6,312
- − Depreciation
- −$4,073
- Taxable loss
- −$3,409
- Est. tax savings @ 24.0%
- +$818
- After-tax cash flow
- $-539/yr
For passive investors: Depreciation is non-cash, so a rental often shows a tax loss while cash-flowing — sheltering income. Rental losses are passive: they offset passive income freely, and up to $25,000/yr can offset ordinary (W-2) income if you actively participate and your MAGI is under $100k (phasing out to $0 by $150k); unused losses carry forward. On sale, claimed depreciation is recaptured at up to 25%, and gains may owe capital-gains tax (a 1031 exchange can defer both). Figures are a year-1 estimate at your 24.0% rate — not tax advice; consult a CPA.
Schools (NCES district)
- District
- Volusia
- NCES district ID
- 1201920
- Math proficiency
- 44% ▼ -9.00%
- Reading proficiency
- 49% ▼ -3.00%
- Median HH income
- $42,946
- Composite
- 39.2/100
- National rank
- #4019
- State rank
- #47 of 73 in FL
Livability — Ormond Beach
- Score
- 83/100
- State rank
- #55
- US rank
- #965
Category grades
Schools grade is shown separately in the Schools card above.
Census & demographics
- Census place
- Ormond Beach, FL
- County
- Volusia County · 556,871 people
- City population
- 69,624
- Metro
- Deltona-Daytona Beach-Ormond Beach, FL
- Population (ZIP)
- 54,783
- Household income
- $71,011
- Rent vs Own
- Severe rent burden
- 1158.0
Population outlook (Volusia County) Hauer SSP2
- Today (2025)
- 572,749 people
- By 2030
- 598,695 · +4.5%
- By 2040
- 644,880 · +12.6%
- By 2050
- 681,451 · +19.0%
- By 2075
- 759,957 · +32.7%
- By 2100
- 778,902 · +36.0%
Race, ethnicity, and origin ACS 2023
- Neighborhood character
- Predominantly White (82%)
- Race & ethnicity
- White 82% Black 6% Hispanic / Latino 5% Two or more races 5% Asian 3%
- Hispanic origin (detail)
- Puerto Rican 2%
- Common ancestry
- Romanian 4% Lithuanian 3% Slovak 3%
- Foreign-born
- 7% · Canada, China
- Languages at home
- 91% English-only · Spanish 3% Other Indo-European 1% German/W. Germanic 1%
Political lean MEDSL · Volusia
- 2024 margin
- Strong R (+21.8) · D 38.7% · R 60.5%
- 2008→2024 swing
- -27.4pp toward R · 2008: 5.7pp · 2024: -21.8pp
- All cycles
- 2024: R+21.8 2020: R+14.1 2016: R+13.1 2012: R+1.2 2008: D+5.7
Not yet ingested
- Civics
- —
Market trends
- HPI YoY
- ▼ -327.97%
- Current HPI
- 271.92
- Rent YoY
- ▲ 1.64%
- Metro
- Deltona-Daytona Beach-Ormond Beach, FL
- State GDP YoY
- ▲ 3.28%
- F500 in state
- 36
Industry mix (Fortune 500 HQ in FL)
| Industry | F500 HQs | Revenue |
|---|---|---|
| Industrial Technology | 2 | $29B |
|
||
| Insurance | 2 | $17B |
|
||
| Retail | 1 | $60B |
|
||
| Technology Distribution | 1 | $58B |
|
||
| Homebuilding | 1 | $35B |
|
||
| Technology Manufacturing | 1 | $35B |
|
||
Price history
+129.9% since first listed13 events — show timeline
- 2026-05-21 Listed $140,000 Daytona MLS
- 2026-04-10 Listing Removed — Daytona MLS
- 2026-03-10 Price Changed $140,000 Daytona MLS
- 2025-08-26 Listed $160,000 Daytona MLS
- 2025-06-30 Listing Removed — Daytona MLS
- 2025-02-22 Price Changed $179,000 Daytona MLS
- 2024-07-03 Listed $189,000 Daytona MLS
- 2024-06-01 Listing Removed — Daytona MLS
- 2023-11-03 Listed $190,000 Daytona MLS
- 2023-11-01 Listing Removed — Daytona MLS
- 2023-05-12 Price Changed $200,000 Daytona MLS
- 2023-03-13 Listed $210,000 Daytona MLS
- 1997-10-13 Sold (Public Records) $60,900 Public Records
Property tax history
+6.0%/yrLatest (2025): $2,175 · -5.1% YoY. Source: county tax records.
Cash-flow waterfall
monthlySold comps — $/sqft
last 12 mo · ≤1 miLoading sold comps…