117 Aztec Way · West Tawakoni, TX
Flood risk 1/10 · Minimal
- FEMA flood zone
- X (unshaded)
- Chance of flooding over 30 yrs
- 0.0%
- Est. flood insurance / yr
- $507 – $1,088
Fire risk 3/10 · Minor
- Est. fire insurance / yr
- $1,222 – $2,270
Heat risk 7/10 · Major
- Hot days now (above 110°F)
- 7 days/yr
- Hot days in 30 yrs
- 24 days/yr
Wind risk 6/10 · Moderate
- Chance of severe wind over 30 yrs
- 27.0%
Air-quality risk 2/10 · Minimal
- Unhealthy air days now
- 0 days/yr
- Unhealthy air days in 30 yrs
- 1 days/yr
Risk factors via First Street. Map © Google.
Why this score? — see what drove the B grade
The composite is a weighted blend of 9 inputs, each scored 0–100. Each bar is that input's sub-score; the figure is the points it added to the 100-point composite (weight × sub-score).
- Cash flow +27.2/30.0
- Appreciation +10.0/10.0
- DSCR +9.5/10.0
- ARV discount +7.5/15.0
- 1% rule +6.5/10.0
- Livability +2.8/5.0
- Schools +2.6/10.0
- Rent growth +2.5/5.0
- Condition / age +2.5/5.0
$110,000
🖨 Deal sheet (PDF) 📄 Offer letter ✓ Due diligence
Listing remarks
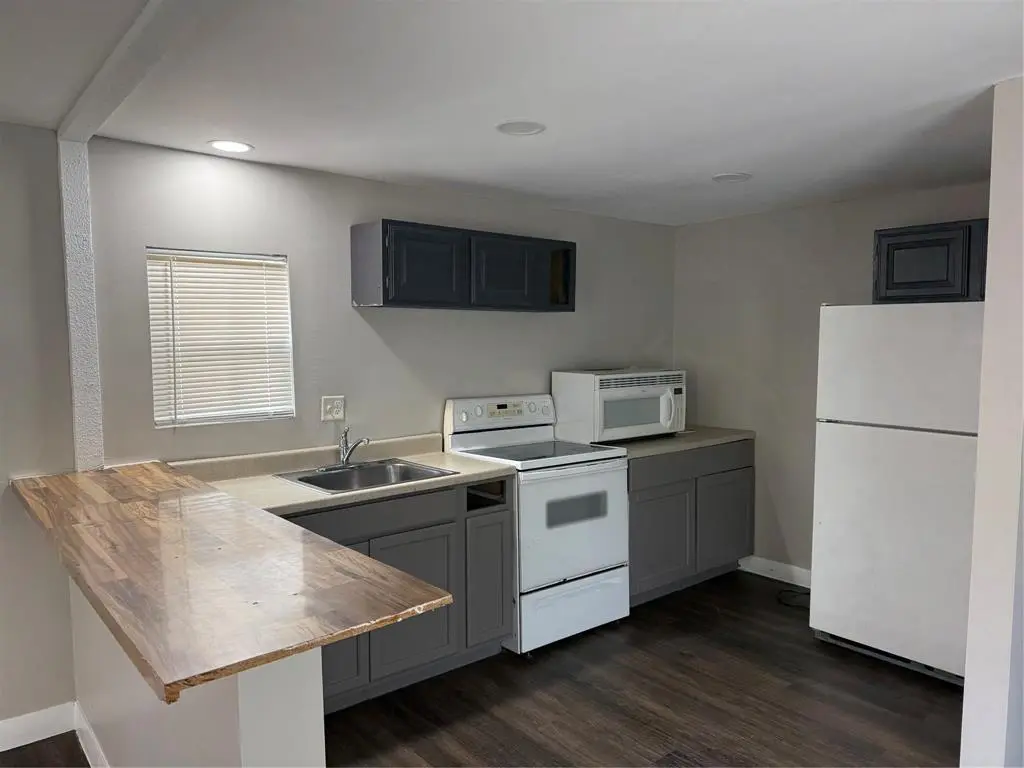
Step into this peaceful and inviting home nestled on a manageable lot in West Tawakoni, just minutes from Lake Tawakoni and local recreation. Whether you are looking for a weekend retreat, an investment opportunity, or an affordable place to call home, this property offers the perfect blend of comfort and convenience. Recently remodeled, this 2-bedroom, 2-bath manufactured home features 924 square feet of living space with a functional layout and plenty of room for everyday living. Enjoy the outdoor space with a . 145 acre lot and gravel parking for easy access. Located near boating, fishing, and outdoor activities, you will always have something to enjoy nearby. This property is ideal for
Key facts
- Recently remodeled
- Outdoor space
- 6,316 sq ft lot
Tags
Property features AI
Finance
- Financial info: Listing offers cash or conventional financing
- HOA & community: No association
Exterior
- Parking: 2-space carport; No garage
- Utilities: City sewer; No municipal utility district
- Home design: Mobile home; One story
- Construction: Metal roof; Pillar/post/pier foundation; Built in 2000
- Exterior features: Gravel parking area; Lot under 0.5 acre
Interior
- Kitchen: Electric range; Refrigerator
- Bedrooms: 2 bedrooms (both on main level)
- Bathrooms: 1 full bathroom
- Interior features: Eat-in kitchen; One living area; One dining area; 2 total rooms
Neighborhood map
What this means for you Summary
Snapshot
- This is a 2-bed/2.0-bath manufactured listed at $110k.
Deal economics
- At list price, monthly cash flow is $316 ($4k/yr) — positive.
- The deal already cash-flows at list — no discount required.
- Meets the 1% rule at list price ($1k rent vs $110k).
- Recommended offer: $108k (1.5% below list) — sets the bar for market timing.
- Cap rate 9.7% vs local median 4.6% in West Tawakoni — top-decile yield for the area; either an underpriced asset or a hidden risk that comps aren't pricing in. Stress-test before assuming the spread holds.
Location & tenants
- Location reads 56/100 on livability (#1,337 in TX) — a working-class tenant base; expect higher turnover. Strengths: cost of living A+, housing A+, crime A-; Watch: amenities F, commute F, employment F.
- Quinlan ISD (rural): math 27% / reading 34% proficiency, ranked #610 of 826 in TX (top 74%) — families likely to look elsewhere, expect single-tenant / working-renter base with shorter leases.
- Zoned schools: D C Cannon El (765 students, 81% FRL) — zoned schools average 81% FRL vs 60% district-wide (22 pts higher); higher-poverty schools than district average — tighter screening recommended.
- Market conditions: 336 active listings in the ZIP; 2 comparable units currently listed for rent nearby; 1,289 units permitted in Hunt County in 2024 (527 in 5+ unit buildings).
Forward outlook
- In year one you build about $12k of equity ($761 loan paydown + $11k appreciation (10.0% local appreciation)).
- Hunt County population projected at +15% by 2050 — modest demand growth; plan on rents tracking national, not racing it.
- At projected returns (10.0% appreciation + 3.0% rent growth), your $31k cash investment doubles in ~2 years — after that, you're playing with house money.
- By year 4, paydown + projected appreciation supports a ~$42k cash-out refi (75% LTV) — recoverable capital for the next deal without selling this one.
Negotiation context
- It's been on market 30 days — a 2% lower offer ($108k) is reasonable based on typical stale-listing flexibility.
Risks & watch-outs
- Climate carrying-cost: major wind risk, 27% chance of damaging wind over 30y; extreme-heat days projected 7→24/yr by 2055 (HVAC capex compounding) — expect insurance premiums to compound above CPI over the hold.
Questions for the listing agent
- Is there a deadline driving the sale (1031 exchange, divorce, estate, relocation)? That informs how much negotiation room exists.
- Schools are F-rated, which usually means shorter tenancies and higher turnover. Who's the typical renter profile here, and what's been the actual vacancy rate?
- What's the average days-on-market for RENTAL listings here right now (not sales)? A rising rental-DOM trend means longer vacancies and softer asking-rent achievability than the comps imply.
- What's the recent tenant-quality profile in this submarket — average credit score on applications, eviction rate, late-payment / NSF rate, and stable-employment percentage? A property-management company in the area should have these aggregated.
- How much new for-sale + rental construction is in the pipeline within 1–3 miles? Heavy new supply typically softens prices + rents 12–24 months out; constrained supply supports both.
Investment metrics
- 1% rule
- 1.15% ✓
- Cap rate
- 9.74%
- Cash-on-cash
- 12.30%
- DSCR
- 1.55
- GRM
- 7.3
CMA / ARV
No comps found within radius.
Projected returns pro-forma
10.0% appreciation · 3.0% rent growth · sell at horizon
- IRR
- 33.3%
- Equity multiple
- 3.60×
- Total profit
- $79,991
- Equity at exit
- $99,097
- IRR
- 28.7%
- Equity multiple
- 8.13×
- Total profit
- $219,688
- Equity at exit
- $213,706
Cash invested: $30,800 (down + closing). Projections, not guarantees.
Landlord ↔ Tenant lean methodology
- Overall (STATE)
- 87 Strongly Landlord-Friendly
- State Texas
- 87 Strongly Landlord-Friendly · R+5
- County
- — inherits STATE
- City
- — inherits STATE
ZIP-level market 75474
- Home prices YoY
- 7.5%
- Active inventory
- 336
- Price-to-rent
- 7.3×
Monthly cashflow live
- Estimated rent
- $1,264 medium interval (Pro) →
- Mortgage (P&I)
- −$577
- Tax from tax record
- −$60 /mo · $717/yr
- Insurance
- −$46
- HOA
- −$0
- Vacancy / Maint / Mgmt
- −$265
- Net cashflow
- $316
Break-even live
Sensitivity live
| Price | -10% $378 | -5% $347 | +0% $316 | +5% $285 | +10% $253 |
|---|---|---|---|---|---|
| Rent | -10% $216 | -5% $266 | +0% $316 | +5% $366 | +10% $416 |
| Rate | -1.0pp $371 | -0.5pp $344 | base $316 | +0.5pp $287 | +1.0pp $258 |
UW: 25.0% down · 7.5% · 30yr · 1.5% tax · 5.0% vac · 8.0% maint · 8.0% mgmt
Financing live
Cash to close
- Down payment
- $27,500
- Closing costs
- $3,300
- Reserves months
- —
- Total cash needed
- —
Loan-product check · same deal, 3 products live
Conventional
25% down · 7.5% · 30yr
- Down + closing
- —
- Monthly P&I
- —
- Monthly cashflow
- —
- DSCR
- —
- Eligible?
- —
Personal DTI + credit; lowest rate.
DSCR
20% down · 8.5% · 30yr
- Down + closing
- —
- Monthly P&I
- —
- Monthly cashflow
- —
- DSCR
- —
- Eligible?
- —
No personal income docs; deal must DSCR.
Hard money
10% down · 12.0% · 12mo
- Down + closing
- —
- Monthly P&I
- —
- Monthly cashflow
- —
- DSCR
- —
- Eligible?
- —
Short-term bridge; refi at stabilization.
Rent comps 2 comps
| Address | Beds | Baths | Sqft | Rent | $/sqft | DOM | Units | Dist |
|---|---|---|---|---|---|---|---|---|
| 1901 TX-276 West Tawakoni, TX | 1.0 | 1.0 | 643 | $995 | $1.55 | 11d | 1 | 0.22mi |
| 1901 Texas 276 Unit 10 West Tawakoni, TX | 1.0 | 1.0 | 643 | $999 | $1.55 | 2d | 1 | 0.22mi |
Listing history 17 events
-
2026-06-21days on market $110,000 Active 30 DOM
-
2026-06-18days on market $110,000 Active 27 DOM
-
2026-06-17days on market $110,000 Active 26 DOM
-
2026-06-16days on market $110,000 Active 25 DOM
-
2026-06-15days on market $110,000 Active 24 DOM
-
2026-06-13days on market $110,000 Active 22 DOM
-
2026-06-09days on market $110,000 Active 18 DOM
-
2026-06-08days on market $110,000 Active 17 DOM
-
2026-06-07days on market $110,000 Active 16 DOM
-
2026-06-04days on market $110,000 Active 13 DOM
-
2026-06-03days on market $110,000 Active 12 DOM
-
2026-06-02days on market $110,000 Active 11 DOM
-
2026-06-01days on market $110,000 Active 10 DOM
-
2026-05-31days on market $110,000 Active 9 DOM
-
2026-05-19$110,000 Active
-
2023-04-14soldstatus
-
1994-07-18soldstatus
ⓘ Source: listings_history table (triggers on properties + properties_extension) + one-shot
backfill from property_details.listing_events for pre-trigger history.
Tax reassessment forecast TX · Resets to sale price
- Current annual tax
- $717 · $60/mo
- Projected year-2 tax
- $2,013 · $168/mo
- Expected delta
- +$1,296/yr (+$108/mo · 180.9%)
ⓘ Screening estimate from a state-policy table — verify with the county assessor before closing.
Climate risk First Street
- Flood 1/10 Low FEMA zone X (unshaded) · 0% chance over 30 yrs
- Wildfire 3/10 Moderate
- Heat 7/10 Severe 7 d/yr ≥110°F today · 24 d/yr by 30 yrs out
- Wind 6/10 Major 27% chance of damaging wind over 30 yrs
- Air quality 2/10 Low 0 unhealthy d/yr today · 1 by 30 yrs out
Nearby sold comps map
Loading sold comps map…
Walkable amenities ~0.75 mi
Loading nearby amenities…
Taxation est. · year 1
- Rental income
- $15,162
- − Mortgage interest
- −$6,162
- − Property taxes
- −$717
- − Insurance
- −$550
- − Repairs & maintenance
- −$1,213
- − Management
- −$1,213
- − Depreciation
- −$3,200
- Taxable income
- $2,108
- Est. tax owed @ 24.0%
- −$506
- After-tax cash flow
- $3,283/yr
For passive investors: Depreciation is non-cash, so a rental often shows a tax loss while cash-flowing — sheltering income. Rental losses are passive: they offset passive income freely, and up to $25,000/yr can offset ordinary (W-2) income if you actively participate and your MAGI is under $100k (phasing out to $0 by $150k); unused losses carry forward. On sale, claimed depreciation is recaptured at up to 25%, and gains may owe capital-gains tax (a 1031 exchange can defer both). Figures are a year-1 estimate at your 24.0% rate — not tax advice; consult a CPA.
Schools (NCES district)
- District
- Quinlan ISD
- NCES district ID
- 4836240
- Math proficiency
- 27% ▼ -10.00%
- Reading proficiency
- 34% ▼ -2.00%
- Median HH income
- $45,461
- Composite
- 26.16/100
- National rank
- #7271
- State rank
- #610 of 826 in TX
Livability — West Tawakoni
- Score
- 56/100
- State rank
- #1337
- US rank
- #23022
Category grades
Schools grade is shown separately in the Schools card above.
Census & demographics
- Census place
- West Tawakoni, TX
- County
- Hunt County · 71,969 people
- Metro
- Dallas-Fort Worth-Arlington, TX
- Population (ZIP)
- 17,671
- Household income
- $64,103
- Rent vs Own
- Severe rent burden
- 181.0
Population outlook (Hunt County) Hauer SSP2
- Today (2025)
- 97,090 people
- By 2030
- 100,452 · +3.5%
- By 2040
- 106,544 · +9.7%
- By 2050
- 111,218 · +14.6%
- By 2075
- 121,695 · +25.3%
- By 2100
- 123,683 · +27.4%
Race, ethnicity, and origin ACS 2023
- Neighborhood character
- Predominantly White (74%)
- Race & ethnicity
- White 74% Hispanic / Latino 19% Two or more races 8% Asian 1% Black 1%
- Hispanic origin (detail)
- Mexican 17%
- Common ancestry
- Lithuanian 2% Romanian 2% Iranian 1%
- Foreign-born
- 8% · Canada
- Languages at home
- 88% English-only · Spanish 10% Other Asian/Pacific 1%
Political lean MEDSL · Hunt
- 2024 margin
- Solid R (+55.5) · D 21.9% · R 77.4%
- 2008→2024 swing
- -14.9pp toward R · 2008: -40.6pp · 2024: -55.5pp
- All cycles
- 2024: R+55.5 2020: R+52.5 2016: R+56.3 2012: R+51.2 2008: R+40.6
Not yet ingested
- Civics
- —
Market trends
- HPI YoY
- ▲ 33.95%
- Current HPI
- 484.21
- Rent YoY
- —
- Metro
- Dallas-Fort Worth-Arlington, TX
- State GDP YoY
- ▲ 3.95%
- F500 in state
- 110
Industry mix (Fortune 500 HQ in TX)
| Industry | F500 HQs | Revenue |
|---|---|---|
| Energy | 16 | $1,198B |
|
||
| Technology | 5 | $198B |
|
||
| Engineering / Construction | 4 | $72B |
|
||
| Energy Services | 3 | $60B |
|
||
| Utilities | 3 | $41B |
|
||
| Healthcare | 2 | $330B |
|
||
Price history
3 events — show timeline
- 2026-05-19 Listed $110,000 NTREIS
- 2023-04-14 Sold (Public Records) — Public Records
- 1994-07-18 Sold (Public Records) — Public Records
Property tax history
+7.1%/yrLatest (2025): $717 · +2.1% YoY. Source: county tax records.
Cash-flow waterfall
monthlySold comps — $/sqft
last 12 mo · ≤1 miLoading sold comps…