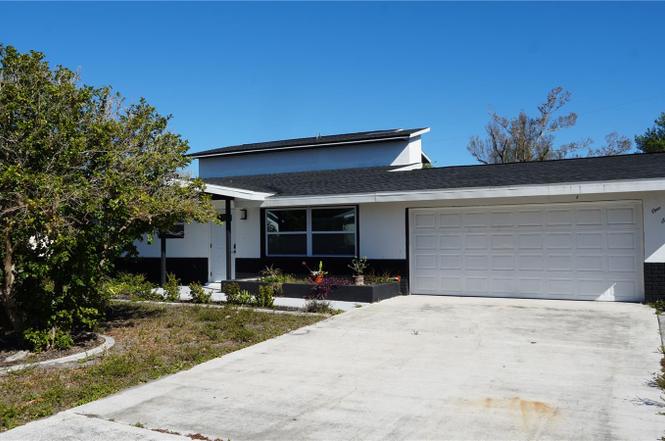
177 Dowling Ave NE · Port Charlotte, FL
Flood risk 9/10 · Severe
- FEMA flood zone
- AE
- Chance of flooding over 30 yrs
- 0.99%
- Est. flood insurance / yr
- $1,737 – $8,500
Fire risk 1/10 · Minimal
- Est. fire insurance / yr
- $947 – $1,759
Heat risk 10/10 · Severe
- Hot days now (above 107°F)
- 7 days/yr
- Hot days in 30 yrs
- 28 days/yr
Wind risk 10/10 · Severe
- Chance of severe wind over 30 yrs
- 99.0%
Air-quality risk 3/10 · Minor
- Unhealthy air days now
- 2 days/yr
- Unhealthy air days in 30 yrs
- 2 days/yr
Risk factors via First Street. Map © Google.
Why this score? — see what drove the C grade
The composite is a weighted blend of 9 inputs, each scored 0–100. Each bar is that input's sub-score; the figure is the points it added to the 100-point composite (weight × sub-score).
- Cash flow +23.2/30.0
- DSCR +7.5/10.0
- ARV discount +7.5/15.0
- 1% rule +6.1/10.0
- Schools +4.6/10.0
- Livability +3.2/5.0
- Condition / age +2.5/5.0
- Rent growth +2.2/5.0
- Appreciation +0.0/10.0
$250,000
🖨 Deal sheet (PDF) 📄 Offer letter ✓ Due diligence
Listing remarks
Under contract-accepting backup offers. Short Sale. This 4-bedroom, 3-bath home offers approximately 2,300 square feet of living space with a two-car garage and an interior renovation that appears largely complete. Tile flooring runs throughout the home, and the layout includes additional bonus space upstairs providing flexibility for a variety of uses. The property will require installation of appliances and repairs to the pool area. The condition of mechanical systems should be verified by buyers during inspection. Located in Flood Zone AE and within convenient reach of Port Charlotte amenities, this home presents an opportunity to complete finishing touches on a partially completed renov
Key facts
- 0.23 acre lot
- 2 garage spots
- Pool
Property features AI
Finance
- Other: Lot approximately 0.23 acres; Zoning: RSF3.5; Living area about 2,300 sq ft; building area about 3,052 sq ft; Unfurnished; No CDD; not homesteaded
Exterior
- Parking: Attached 2-car garage
- Utilities: Public water; Public sewer; Electricity connected; Cable available; High-speed internet / broadband available; Sewer connected; Water connected
- Home design: Single-family residence; Two stories; Faces west
- Construction: Block, stucco and frame construction; Shingle roof; Built on slab foundation; Property type: Residential — Single Family Residence
- Exterior features: Lighting; Sliding doors; Storage; Wood fencing; In-ground private pool with screen enclosure; Paved road access
Interior
- Kitchen: Cooktop; Dishwasher; Disposal; Microwave; Range; Tankless water heater
- Bedrooms: 4 bedrooms
- Flooring: Tile; Slab foundation
- Bathrooms: 3 full bathrooms
- Heating & cooling: Central heating; Central air
- Interior features: Ceiling fans; Crown molding; Eat-in kitchen; Open floorplan; Thermostat; Storm windows
- Laundry & utility: Inside laundry room
Neighborhood map
What this means for you Summary
Snapshot
- This is a 5-bed/3.0-bath single-family listed at $250k.
Deal economics
- At list price, monthly cash flow is $26 ($317/yr) — positive.
- The deal already cash-flows at list — no discount required.
- Meets the 1% rule at list price ($3k rent vs $250k).
- Recommended offer: $242k (3.0% below list) — sets the bar for market timing.
- Cap rate 8.5% vs local median 4.4% in Port Charlotte — top-decile yield for the area; either an underpriced asset or a hidden risk that comps aren't pricing in. Stress-test before assuming the spread holds.
Location & tenants
- Location reads 65/100 on livability (#655 in FL) — a middle-class / working-renter tenant base. Strengths: cost of living A+, housing A+; Watch: employment D, amenities F, commute F.
- Charlotte (suburban): math 54% / reading 54% proficiency, ranked #22 of 73 in FL (top 30%) — acceptable for families but not a draw, mixed tenant base, ~2y average lease.
- Zoned schools: Peace River Elementary School (math 56% / reading 54%, grade C, #872 of 2,144 statewide, top 42%, 581 students, 64% FRL); Charlotte High School (math 44% / reading 46%, grade D-, #228 of 667 statewide, top 35%, 1,994 students, 41% FRL) — zoned schools at 53% FRL track the district average.
- Market conditions: Rents soft (-1.4%/yr); 707 active listings in the ZIP; 1 comparable units currently listed for rent nearby; 4,585 units permitted in Charlotte County in 2024 (703 in 5+ unit buildings).
- At $2,783/mo this rent would consume 54% of the median local household income ($61k/yr) (locally 733% of renters already pay >50% of income on rent) — very limited rent-growth headroom before tenants either downsize or default.
Forward outlook
- Local home prices are declining (-3.0%/yr); year-one equity from $2k of loan paydown is wiped out by about $8k of value loss. Plan a longer hold.
- Charlotte County population projected at +24% by 2050 — long-run rental-demand tailwind backs the buy-and-hold thesis.
Negotiation context
- It's been on market 58 days — a 3% lower offer ($242k) is reasonable based on typical stale-listing flexibility.
- 6 sale attempts since 16y ago; this cycle's ask has dropped $49k (16%) from the opening price — seller is motivated, your offer sets the floor, not the list.
- Current owner paid $66k; list at $250k implies a 276% gain — meaningful room to come down on a strong offer.
Risks & watch-outs
- Watch-outs: flood insurance adds $427/mo.
- Climate carrying-cost: in FEMA flood zone AE (mandatory federal flood insurance); severe wind risk, 99% chance of damaging wind over 30y; extreme-heat days projected 7→28/yr by 2055 (HVAC capex compounding) — expect insurance premiums to compound above CPI over the hold.
Questions for the listing agent
- It's been on market 58 days. Have you received any prior offers? Is the seller open to a 3% concession, seller financing, or rate buy-down credit?
- Built in 1970 — when were the roof, HVAC, electrical panel, plumbing, and water heater last replaced?
- What's the actual annual flood-insurance premium (NFIP or private), and is the property in a SFHA with mandatory coverage?
- Is there a deadline driving the sale (1031 exchange, divorce, estate, relocation)? That informs how much negotiation room exists.
- Schools are D-rated, which usually means shorter tenancies and higher turnover. Who's the typical renter profile here, and what's been the actual vacancy rate?
- What's the average days-on-market for RENTAL listings here right now (not sales)? A rising rental-DOM trend means longer vacancies and softer asking-rent achievability than the comps imply.
- What's the recent tenant-quality profile in this submarket — average credit score on applications, eviction rate, late-payment / NSF rate, and stable-employment percentage? A property-management company in the area should have these aggregated.
- How much new for-sale + rental construction is in the pipeline within 1–3 miles? Heavy new supply typically softens prices + rents 12–24 months out; constrained supply supports both.
Investment metrics
- 1% rule
- 1.11% ✓
- Cap rate
- 8.47%
- Cash-on-cash
- 7.77%
- DSCR
- 1.35
- GRM
- 7.5
CMA / ARV
No comps found within radius.
Projected returns pro-forma
-3.0% appreciation · 0.0% rent growth · sell at horizon
- IRR
- -19.8%
- Equity multiple
- 0.33×
- Total profit
- $-46,666
- Equity at exit
- $37,276
- IRR
- -23.8%
- Equity multiple
- 0.02×
- Total profit
- $-68,705
- Equity at exit
- $21,615
Cash invested: $70,000 (down + closing). Projections, not guarantees.
Landlord ↔ Tenant lean methodology
- Overall (STATE)
- 87 Strongly Landlord-Friendly
- State Florida
- 87 Strongly Landlord-Friendly · R+3
- County
- — inherits STATE
- City
- — inherits STATE
ZIP-level market 33952
- Home prices YoY
- -4.8%
- Rents YoY
- -1.4%
- Active inventory
- 707
- Price-to-rent
- 7.5×
Monthly cashflow live
- Estimated rent
- $2,783 medium interval (Pro) →
- Mortgage (P&I)
- −$1,311
- Tax from tax record
- −$330 /mo · $3,963/yr
- Insurance
- −$104
- Flood insurance flood zone
- −$427 /mo · $5,118/yr
- HOA
- −$0
- Vacancy / Maint / Mgmt
- −$584
- Net cashflow
- $26
Break-even live
Sensitivity live
| Price | -10% $168 | -5% $97 | +0% $26 | +5% $-44 | +10% $-115 |
|---|---|---|---|---|---|
| Rent | -10% $-193 | -5% $-83 | +0% $26 | +5% $136 | +10% $246 |
| Rate | -1.0pp $152 | -0.5pp $90 | base $26 | +0.5pp $-38 | +1.0pp $-104 |
UW: 25.0% down · 7.5% · 30yr · 1.5% tax · 5.0% vac · 8.0% maint · 8.0% mgmt
Financing live
Cash to close
- Down payment
- $62,500
- Closing costs
- $7,500
- Reserves months
- —
- Total cash needed
- —
Loan-product check · same deal, 3 products live
Conventional
25% down · 7.5% · 30yr
- Down + closing
- —
- Monthly P&I
- —
- Monthly cashflow
- —
- DSCR
- —
- Eligible?
- —
Personal DTI + credit; lowest rate.
DSCR
20% down · 8.5% · 30yr
- Down + closing
- —
- Monthly P&I
- —
- Monthly cashflow
- —
- DSCR
- —
- Eligible?
- —
No personal income docs; deal must DSCR.
Hard money
10% down · 12.0% · 12mo
- Down + closing
- —
- Monthly P&I
- —
- Monthly cashflow
- —
- DSCR
- —
- Eligible?
- —
Short-term bridge; refi at stabilization.
Rent comps 1 comps
| Address | Beds | Baths | Sqft | Rent | $/sqft | DOM | Units | Dist |
|---|---|---|---|---|---|---|---|---|
| 181 Beeney Rd SE Port Charlotte, FL | 4.0 | 2.5 | 1846 | $4,900 | $2.65 | 22d | 1 | 0.71mi |
Listing history 21 events
-
2026-05-01status Pending
-
2026-04-28price $250,000
-
2026-04-14price $269,000
-
2026-03-31price $285,000
-
2026-03-04$299,000 Active
-
2025-08-20historical
-
2025-07-15$369,000 Active
-
2025-06-04historical
-
2025-04-25price $379,900
-
2025-02-10price $389,900
-
2025-01-08$399,900 Active
-
2024-06-10historical
-
2024-05-25price $249,900
-
2024-05-15$265,000 Active
-
2011-09-16soldstatus $66,500
-
2011-06-20historical
-
2011-06-17$74,900
-
2010-01-05$116,910
-
2002-06-18soldstatus $148,000
-
2000-02-09soldstatus $145,000
-
1986-10-01soldstatus $75,000
ⓘ Source: listings_history table (triggers on properties + properties_extension) + one-shot
backfill from property_details.listing_events for pre-trigger history.
Tax reassessment forecast FL · Resets to sale price
- Current annual tax
- $3,963 · $330/mo
- Projected year-2 tax
- $3,963 · $330/mo
- Expected delta
- $0/yr ($0/mo · 0.0%)
ⓘ Screening estimate from a state-policy table — verify with the county assessor before closing.
Climate risk First Street
- Flood 9/10 Extreme FEMA zone AE · 99% chance over 30 yrs
- Wildfire 1/10 Low
- Heat 10/10 Extreme 7 d/yr ≥107°F today · 28 d/yr by 30 yrs out
- Wind 10/10 Extreme 99% chance of damaging wind over 30 yrs
- Air quality 3/10 Moderate 2 unhealthy d/yr today · 2 by 30 yrs out
Nearby sold comps map
Loading sold comps map…
Walkable amenities ~0.75 mi
Loading nearby amenities…
Taxation est. · year 1
- Rental income
- $33,394
- − Mortgage interest
- −$14,004
- − Property taxes
- −$3,963
- − Insurance
- −$6,368
- − Repairs & maintenance
- −$2,672
- − Management
- −$2,672
- − Depreciation
- −$7,273
- Taxable loss
- −$3,557
- Est. tax savings @ 24.0%
- +$854
- After-tax cash flow
- $1,171/yr
For passive investors: Depreciation is non-cash, so a rental often shows a tax loss while cash-flowing — sheltering income. Rental losses are passive: they offset passive income freely, and up to $25,000/yr can offset ordinary (W-2) income if you actively participate and your MAGI is under $100k (phasing out to $0 by $150k); unused losses carry forward. On sale, claimed depreciation is recaptured at up to 25%, and gains may owe capital-gains tax (a 1031 exchange can defer both). Figures are a year-1 estimate at your 24.0% rate — not tax advice; consult a CPA.
Schools (NCES district)
- District
- Charlotte
- NCES district ID
- 1200240
- Math proficiency
- 54% ▼ -6.00%
- Reading proficiency
- 54% ▼ -1.00%
- Median HH income
- $44,864
- Composite
- 45.62/100
- National rank
- #2586
- State rank
- #22 of 73 in FL
Livability — Port Charlotte
- Score
- 65/100
- State rank
- #655
- US rank
- #13081
Category grades
Schools grade is shown separately in the Schools card above.
Census & demographics
- Census place
- Port Charlotte, FL
- County
- Charlotte County · 196,994 people
- City population
- 102,180
- Metro
- Punta Gorda, FL
- Population (ZIP)
- 35,231
- Household income
- $61,382
- Rent vs Own
- Severe rent burden
- 733.0
Population outlook (Charlotte County) Hauer SSP2
- Today (2025)
- 198,646 people
- By 2030
- 210,507 · +6.0%
- By 2040
- 230,857 · +16.2%
- By 2050
- 247,148 · +24.4%
- By 2075
- 281,777 · +41.8%
- By 2100
- 293,609 · +47.8%
Race, ethnicity, and origin ACS 2023
- Neighborhood character
- Predominantly White (76%)
- Race & ethnicity
- White 76% Hispanic / Latino 14% Two or more races 8% Black 6% Asian 2%
- Hispanic origin (detail)
- Mexican 2% Puerto Rican 3% Cuban 2%
- Common ancestry
- Lithuanian 2% Romanian 2% Italian 2%
- Foreign-born
- 12% · Canada, Vietnam
- Languages at home
- 85% English-only · Spanish 10% French/Haitian/Cajun 1% Russian/Polish/Slavic 1%
Political lean MEDSL · Charlotte
- 2024 margin
- Solid R (+34.0) · D 32.7% · R 66.7%
- 2008→2024 swing
- -26.7pp toward R · 2008: -7.2pp · 2024: -34.0pp
- All cycles
- 2024: R+34.0 2020: R+26.6 2016: R+27.8 2012: R+14.3 2008: R+7.2
Not yet ingested
- Civics
- —
Market trends
- HPI YoY
- ▼ -17.18%
- Current HPI
- 339.0932
- Rent YoY
- ▼ -1.35%
- Metro
- Punta Gorda, FL
- State GDP YoY
- ▲ 3.28%
- F500 in state
- 36
Industry mix (Fortune 500 HQ in FL)
| Industry | F500 HQs | Revenue |
|---|---|---|
| Industrial Technology | 2 | $29B |
|
||
| Insurance | 2 | $17B |
|
||
| Retail | 1 | $60B |
|
||
| Technology Distribution | 1 | $58B |
|
||
| Homebuilding | 1 | $35B |
|
||
| Technology Manufacturing | 1 | $35B |
|
||
Price history
+233.3% since first listed21 events — show timeline
- 2026-05-01 Pending — Stellar MLS as Distributed by MLS Grid
- 2026-04-28 Price Changed $250,000 Stellar MLS as Distributed by MLS Grid
- 2026-04-14 Price Changed $269,000 Stellar MLS as Distributed by MLS Grid
- 2026-03-31 Price Changed $285,000 Stellar MLS as Distributed by MLS Grid
- 2026-03-04 Listed $299,000 Stellar MLS as Distributed by MLS Grid
- 2025-08-20 Listing Removed — Stellar MLS as Distributed by MLS Grid
- 2025-07-15 Listed $369,000 Stellar MLS as Distributed by MLS Grid
- 2025-06-04 Listing Removed — Stellar MLS as Distributed by MLS Grid
- 2025-04-25 Price Changed $379,900 Stellar MLS as Distributed by MLS Grid
- 2025-02-10 Price Changed $389,900 Stellar MLS as Distributed by MLS Grid
- 2025-01-08 Listed $399,900 Stellar MLS as Distributed by MLS Grid
- 2024-06-10 Listing Removed — Stellar MLS as Distributed by MLS Grid
- 2024-05-25 Price Changed $249,900 Stellar MLS as Distributed by MLS Grid
- 2024-05-15 Listed $265,000 Stellar MLS as Distributed by MLS Grid
- 2011-09-16 Sold (MLS) $66,500 Stellar MLS as Distributed by MLS Grid
- 2011-06-20 Listing Removed — Stellar MLS as Distributed by MLS Grid
- 2011-06-17 Listed $74,900 Stellar MLS as Distributed by MLS Grid
- 2010-01-05 Listed $116,910 Stellar MLS as Distributed by MLS Grid
- 2002-06-18 Sold (Public Records) $148,000 Public Records
- 2000-02-09 Sold (Public Records) $145,000 Public Records
- 1986-10-01 Sold (Public Records) $75,000 Public Records
Property tax history
+7.4%/yrLatest (2025): $3,963 · -6.3% YoY. Source: county tax records.
Cash-flow waterfall
monthlySold comps — $/sqft
last 12 mo · ≤1 miLoading sold comps…