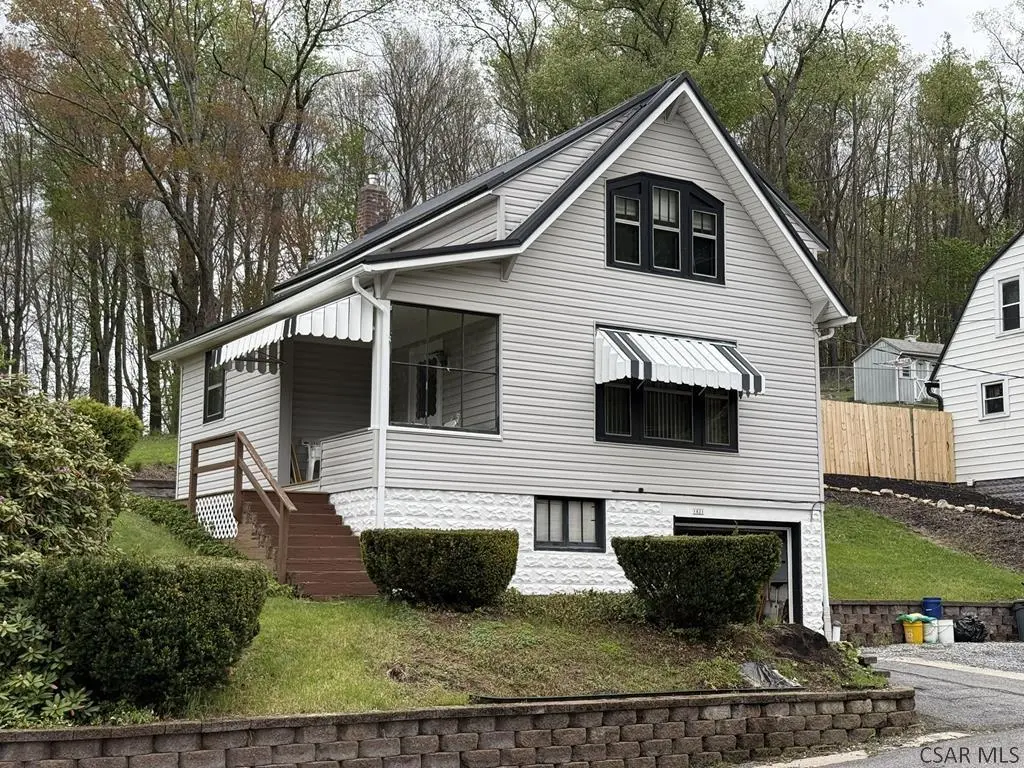
1821 Ruby St · Oakland, PA
Flood risk 1/10 · Minimal
- FEMA flood zone
- X (unshaded)
- Chance of flooding over 30 yrs
- 0.0%
- Est. flood insurance / yr
- $473 – $860
Fire risk 1/10 · Minimal
- Est. fire insurance / yr
- $511 – $949
Heat risk 3/10 · Minor
- Hot days now (above 91°F)
- 7 days/yr
- Hot days in 30 yrs
- 17 days/yr
Wind risk 2/10 · Minimal
- Chance of severe wind over 30 yrs
- —
Air-quality risk 2/10 · Minimal
- Unhealthy air days now
- 1 days/yr
- Unhealthy air days in 30 yrs
- 2 days/yr
Risk factors via First Street. Map © Google.
Why this score? — see what drove the B grade
The composite is a weighted blend of 9 inputs, each scored 0–100. Each bar is that input's sub-score; the figure is the points it added to the 100-point composite (weight × sub-score).
- Cash flow +28.7/30.0
- ARV discount +15.0/15.0
- DSCR +10.0/10.0
- 1% rule +7.7/10.0
- Rent growth +2.5/5.0
- Livability +2.5/5.0
- Condition / age +2.5/5.0
- Schools +1.3/10.0
- Appreciation +0.0/10.0
$68,000
🖨 Deal sheet 📄 Offer letter ✓ Due diligence
Listing remarks
LET'S GET MOVING TO STONYCREEK TOWNSHIP/CAMBRIA COUNTY. .. this 2 bedroom home provides many features that you want in your next home. The main floor includes spacious living room with open staircase; dining room with plenty of space for special occasion gatherings or casual get togethers; and eat-in kitchen with solid wood cabinets and appliances. Upstairs is full bath and 2 bedrooms. Gas hot water heat to keep you warm on cold days. Vinyl siding, metal roof, covered porch, one-car integral garage with newer door, newer hot water tank, and newer furnace. Don't miss the opportunity to make this home yours. Call today for more details, to receive your tour packet, and to schedule a personal
Key facts
- 0.27 acre lot
- Garage
- Built 1950
Property features AI
Finance
- Other: Property listed as residential single family (SFR)
Exterior
- Parking: Garage (1 space)
- Utilities: Public water; Public sewer (sewer available)
- Home design: Single family residence; One and one half levels; Residential zoning
- Construction: Vinyl siding; Metal roof
- Exterior features: Covered porch; Rectangular lot; City street frontage; Publicly maintained road
Interior
- Kitchen: Range; Oven; Refrigerator; Eat-in kitchen
- Flooring: Carpet
- Bathrooms: 1 full bathroom
- Heating & cooling: Hot water heating; Space heater; Natural gas heating; Ceiling fan(s)
- Interior features: Eat-in kitchen; Full unfinished basement
- Laundry & utility: Washer and dryer; Laundry located in basement
Neighborhood map
What this means for you Summary
Snapshot
- This is a 2-bed/1.0-bath single-family listed at $68k.
Deal economics
- At list price, monthly cash flow is $227 ($3k/yr) — positive.
- The deal already cash-flows at list — no discount required.
- Meets the 1% rule at list price ($865 rent vs $68k).
- Recommended offer: $66k (3.0% below list) — sets the bar for market timing.
- Cap rate 10.3% vs local median 5.4% in Oakland — top-decile yield for the area; either an underpriced asset or a hidden risk that comps aren't pricing in. Stress-test before assuming the spread holds.
Location & tenants
- Location reads: area grade B — affects rentability + tenant quality, not the cash-flow math above.
- Greater Johnstown SD (urban): math 9% / reading 25% proficiency, ranked #509 of 539 in PA (top 94%) — low school quality limits family demand, transient renter base, plan for 1-2y turnover; 80% free/reduced lunch — lower-income household profile, screen leases tightly.
- Market conditions: 64 active listings in the ZIP; 4 comparable units currently listed for rent nearby; rentals lingering (median 44d on market — plan ~5-8 weeks vacancy on turnover, expect pricing pressure); 75% of comp listings sitting > 30 days — soft ceiling on asking rent; lower-income renter base — watch delinquency; 64 units permitted in Cambria County in 2024 (0 in 5+ unit buildings).
Forward outlook
- Local home prices are declining (-3.0%/yr); year-one equity from $470 of loan paydown is wiped out by about $2k of value loss. Plan a longer hold.
- Cambria County population projected at -28% by 2050 — secular population decline; favor cash flow + early exit over multi-decade hold.
- At projected returns (-3.0% appreciation + 3.0% rent growth), your $19k cash investment doubles in ~9 years — after that, you're playing with house money.
Negotiation context
- It's been on market 45 days — a 3% lower offer ($66k) is reasonable based on typical stale-listing flexibility.
- Current owner paid $29k; list at $68k implies a 134% gain — meaningful room to come down on a strong offer.
Risks & watch-outs
- Watch-outs: built in 1950 — expect roof / HVAC / electrical / plumbing capex.
Questions for the listing agent
- It's been on market 45 days. Have you received any prior offers? Is the seller open to a 3% concession, seller financing, or rate buy-down credit?
- Built in 1950 — when were the roof, HVAC, electrical panel, plumbing, and water heater last replaced?
- Is there a deadline driving the sale (1031 exchange, divorce, estate, relocation)? That informs how much negotiation room exists.
- What's the average days-on-market for RENTAL listings here right now (not sales)? A rising rental-DOM trend means longer vacancies and softer asking-rent achievability than the comps imply.
- What's the recent tenant-quality profile in this submarket — average credit score on applications, eviction rate, late-payment / NSF rate, and stable-employment percentage? A property-management company in the area should have these aggregated.
- How much new for-sale + rental construction is in the pipeline within 1–3 miles? Heavy new supply typically softens prices + rents 12–24 months out; constrained supply supports both.
Investment metrics
- 1% rule
- 1.27% ✓
- Cap rate
- 10.30%
- Cash-on-cash
- 14.32%
- DSCR
- 1.64
- GRM
- 6.6
CMA / ARV
- ARV (median comp)
- $91,877
- List price
- $68,000
- Delta
- -25.99%
- Verdict
- UNDERPRICED
- Comps
- 20 within 1.0 mi
Show comp detail 8 sales within ~0.75 mi
| Address | Dist | Beds/Ba | Sqft | Sold | Price | $/sf | Match |
|---|---|---|---|---|---|---|---|
| 444 Green Valley St | 0.58mi | 2/1.0 | 912 (-8%) | 3mo | $38,500 | $42 | 56 |
| 805 Bay St | 0.52mi | 2/1.0 | 864 (-13%) | 8mo | $23,500 | $27 | 48 |
| 1191 Florida Ave | 0.66mi | 2/1.5 | 1,024 (+3%) | 17mo | $79,000 | $77 | 48 |
| 1196 Linwood Ave | 0.68mi | 2/1.0 | 1,088 (+10%) | 6mo | $49,500 | $45 | 47 |
| 298 Lunen St | 0.72mi | 2/1.0 | 872 (-12%) | 5mo | $25,000 | $29 | 42 |
| 113 Clair Ave | 0.50mi | 3/1.0 (+1) | 885 (-11%) | 23mo | $43,000 | $49 | 34 |
| 328 Ohio St | 0.71mi | 3/1.0 (+1) | 1,130 (+14%) | 14mo | $47,000 | $42 | 27 |
| 1197 Rebecca Dr | 0.55mi | 3/1.0 (+1) | 1,132 (+14%) | 23mo | $73,800 | $65 | 27 |
Match score weights: distance 35% · size 25% · config 20% · recency 20%. Top-matched comps best support the ARV.
Projected returns pro-forma
-3.0% appreciation · 3.0% rent growth · sell at horizon
- IRR
- 4.7%
- Equity multiple
- 1.18×
- Total profit
- $3,460
- Equity at exit
- $10,139
- IRR
- 14.2%
- Equity multiple
- 2.14×
- Total profit
- $21,669
- Equity at exit
- $5,879
Cash invested: $19,040 (down + closing). Projections, not guarantees.
Landlord ↔ Tenant lean methodology
- Overall (STATE)
- 62 Landlord-Friendly
- State Pennsylvania
- 62 Landlord-Friendly · EVEN
- County
- — inherits STATE
- City
- — inherits STATE
ZIP-level market 15902
- Home prices YoY
- -28.8%
- Active inventory
- 64
- Price-to-rent
- 6.6×
Monthly cashflow live
- Estimated rent
- $865 medium interval (Pro) →
- Mortgage (P&I)
- −$357
- Tax from tax record
- −$71 /mo · $849/yr
- Insurance
- −$28
- HOA
- −$0
- Vacancy / Maint / Mgmt
- −$182
- Net cashflow
- $227
Break-even live
UW: 25.0% down · 7.5% · 30yr · 1.5% tax · 5.0% vac · 8.0% maint · 8.0% mgmt
Financing live
Cash to close
- Down payment
- $17,000
- Closing costs
- $2,040
- Reserves months
- —
- Total cash needed
- —
Loan-product check · same deal, 3 products live
Conventional
25% down · 7.5% · 30yr
- Down + closing
- —
- Monthly P&I
- —
- Monthly cashflow
- —
- DSCR
- —
- Eligible?
- —
Personal DTI + credit; lowest rate.
DSCR
20% down · 8.5% · 30yr
- Down + closing
- —
- Monthly P&I
- —
- Monthly cashflow
- —
- DSCR
- —
- Eligible?
- —
No personal income docs; deal must DSCR.
Hard money
10% down · 12.0% · 12mo
- Down + closing
- —
- Monthly P&I
- —
- Monthly cashflow
- —
- DSCR
- —
- Eligible?
- —
Short-term bridge; refi at stabilization.
Rent comps 4 comps
| Address | Beds | Baths | Sqft | Rent | $/sqft | DOM | Units | Dist |
|---|---|---|---|---|---|---|---|---|
| 343 Linden Ave Unit 2 Johnstown, PA | 1.0 | 1.0 | 850 | $675 | $0.79 | 43d | 1 | 0.85mi |
| 1201 Heeney Ave Johnstown, PA | 1.0–3.0 | 1.0 | 750 | $950 | $1.27 | 4d | 1 | 0.90mi |
| 619 Grove Ave Johnstown, PA | 2.0 | 2.0 | 1100 | $1,050 | $0.95 | 43d | 1 | 1.16mi |
| 412 Oak St Unit 1 Johnstown, PA | 2.0 | 1.0 | 1100 | $900 | $0.82 | 43d | 1 | 1.48mi |
Listing history 17 events
-
2026-06-19days on market $68,000 Active 45 DOM
-
2026-06-18days on market $68,000 Active 44 DOM
-
2026-06-17days on market $68,000 Active 43 DOM
-
2026-06-16days on market $68,000 Active 42 DOM
-
2026-06-15days on market $68,000 Active 41 DOM
-
2026-06-14days on market $68,000 Active 39 DOM
-
2026-06-12days on market $68,000 Active 38 DOM
-
2026-06-09pricedays on market $68,000 Active 35 DOM
-
2026-06-08days on market $72,500 Active 34 DOM
-
2026-06-07days on market $72,500 Active 33 DOM
-
2026-06-05days on market $72,500 Active 30 DOM
-
2026-06-02days on market $72,500 Active 28 DOM
-
2026-06-01days on market $72,500 Active 27 DOM
-
2026-05-31days on market $72,500 Active 26 DOM
-
2026-05-30days on market $72,500 Active 25 DOM
-
2026-05-05$72,500 Active 704-char remark
-
1980-06-01soldstatus $29,000
ⓘ Source: listings_history table (triggers on properties + properties_extension) + one-shot
backfill from property_details.listing_events for pre-trigger history.
Tax reassessment forecast PA · Partial reset (capped growth)
- Current annual tax
- $849 · $71/mo
- Projected year-2 tax
- $962 · $80/mo
- Expected delta
- +$112/yr (+$9/mo · 13.2%)
ⓘ Screening estimate from a state-policy table — verify with the county assessor before closing.
Climate risk First Street
- Flood 1/10 Low FEMA zone X (unshaded) · 0% chance over 30 yrs
- Wildfire 1/10 Low
- Heat 3/10 Moderate 7 d/yr ≥91°F today · 17 d/yr by 30 yrs out
- Wind 2/10 Low
- Air quality 2/10 Low 1 unhealthy d/yr today · 2 by 30 yrs out
Nearby sold comps map
Loading sold comps map…
Walkable amenities ~0.75 mi
Loading nearby amenities…
Taxation est. · year 1
- Rental income
- $10,374
- − Mortgage interest
- −$3,809
- − Property taxes
- −$849
- − Insurance
- −$340
- − Repairs & maintenance
- −$830
- − Management
- −$830
- − Depreciation
- −$1,978
- Taxable income
- $1,738
- Est. tax owed @ 24.0%
- −$417
- After-tax cash flow
- $2,310/yr
For passive investors: Depreciation is non-cash, so a rental often shows a tax loss while cash-flowing — sheltering income. Rental losses are passive: they offset passive income freely, and up to $25,000/yr can offset ordinary (W-2) income if you actively participate and your MAGI is under $100k (phasing out to $0 by $150k); unused losses carry forward. On sale, claimed depreciation is recaptured at up to 25%, and gains may owe capital-gains tax (a 1031 exchange can defer both). Figures are a year-1 estimate at your 24.0% rate — not tax advice; consult a CPA.
Schools (NCES district)
- District
- Greater Johnstown SD
- NCES district ID
- 4210950
- Math proficiency
- 9% ▼ -6.00%
- Reading proficiency
- 25% ▼ -6.00%
- Median HH income
- $27,890
- Composite
- 13.25/100
- National rank
- #9550
- State rank
- #509 of 539 in PA
Livability — Oakland
No livability data for this city. (Only ~50 U.S. cities are tracked.)
Census & demographics
- Census place
- Oakland, PA
- County
- Cambria County · 30,791 people
- Metro
- Johnstown, PA
- Population (ZIP)
- 11,462
- Household income
- $44,215
- Rent vs Own
- Severe rent burden
- 266.0
Population outlook (Cambria County) Hauer SSP2
- Today (2025)
- 122,754 people
- By 2030
- 115,827 · -5.6%
- By 2040
- 101,309 · -17.5%
- By 2050
- 88,379 · -28.0%
- By 2075
- 65,237 · -46.9%
- By 2100
- 46,909 · -61.8%
Race, ethnicity, and origin ACS 2023
- Neighborhood character
- Predominantly White (75%)
- Race & ethnicity
- White 75% Two or more races 14% Black 8% Hispanic / Latino 3%
- Common ancestry
- Romanian 7% Slovak 2% Hungarian 2%
- Foreign-born
- 2% · Canada
- Languages at home
- 97% English-only · Spanish 2%
Political lean MEDSL · Cambria
- 2024 margin
- Solid R (+39.7) · D 29.8% · R 69.5%
- 2008→2024 swing
- -40.4pp toward R · 2008: 0.7pp · 2024: -39.7pp
- All cycles
- 2024: R+39.7 2020: R+37.3 2016: R+37.8 2012: R+17.8 2008: D+0.7
Not yet ingested
- Civics
- —
Market trends
- HPI YoY
- ▼ -43.86%
- Current HPI
- 108.2198
- Rent YoY
- —
- Metro
- Johnstown, PA
- State GDP YoY
- ▲ 1.68%
- F500 in state
- 34
Industry mix (Fortune 500 HQ in PA)
| Industry | F500 HQs | Revenue |
|---|---|---|
| Healthcare | 2 | $309B |
|
||
| Insurance | 2 | $27B |
|
||
| Telecommunications / Media | 1 | $124B |
|
||
| Industrial Distribution | 1 | $22B |
|
||
| Financial Services | 1 | $20B |
|
||
| Chemicals / Materials | 1 | $18B |
|
||
Price history
+134.5% since first listed3 events — show timeline
- 2026-06-09 Price Changed $68,000 CSMLS
- 2026-05-05 Listed $72,500 CSMLS
- 1980-06-01 Sold (Public Records) $29,000 Public Records
Property tax history
+0.9%/yrLatest (2026): $849 · +0.0% YoY. Source: county tax records.
Cash-flow waterfall
monthlySold comps — $/sqft
last 12 mo · ≤1 miLoading sold comps…