 Triplex
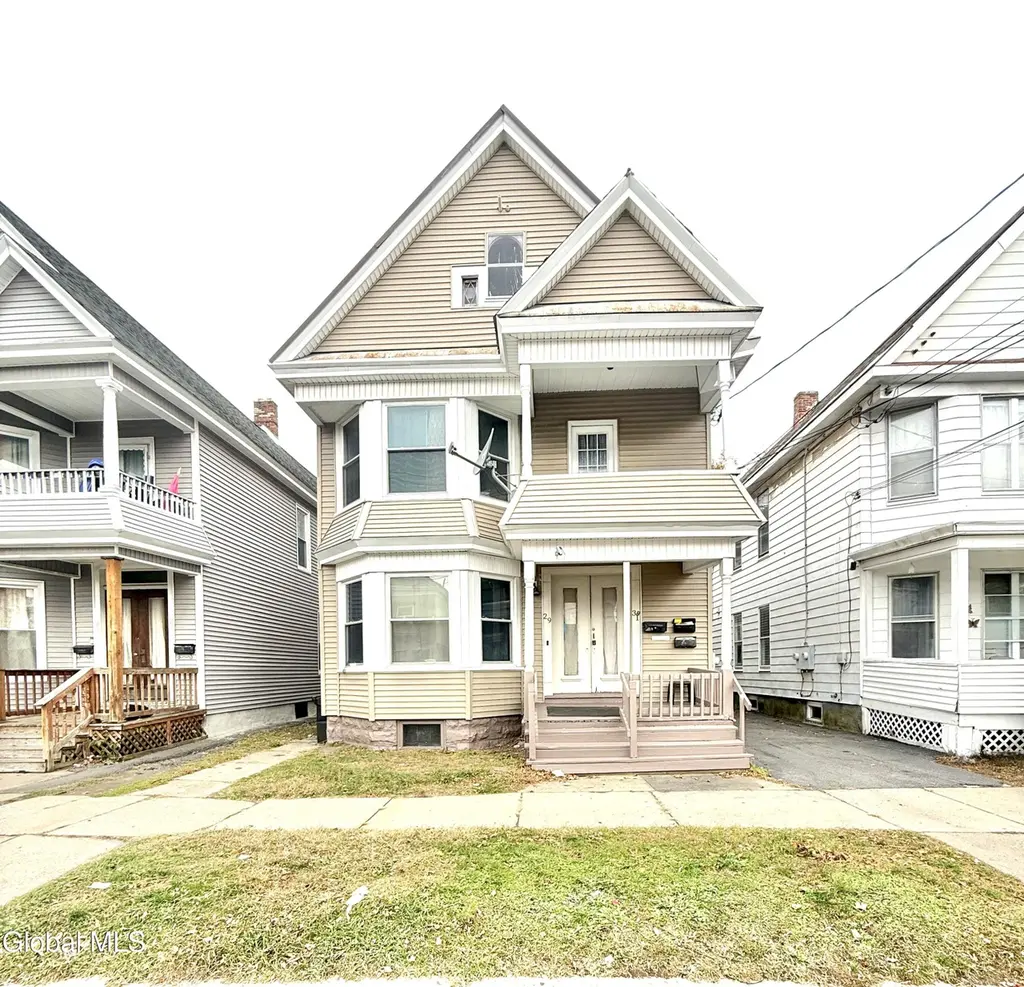
29 Mcclellan St · Schenectady, NY
Flood risk 1/10 · Minimal
- FEMA flood zone
- X (unshaded)
- Chance of flooding over 30 yrs
- 0.0%
- Est. flood insurance / yr
- $473 – $860
Fire risk 1/10 · Minimal
- Est. fire insurance / yr
- $691 – $1,283
Heat risk 4/10 · Minor
- Hot days now (above 95°F)
- 7 days/yr
- Hot days in 30 yrs
- 17 days/yr
Wind risk 2/10 · Minimal
- Chance of severe wind over 30 yrs
- 4.0%
Air-quality risk 1/10 · Minimal
- Unhealthy air days now
- 0 days/yr
- Unhealthy air days in 30 yrs
- 0 days/yr
Risk factors via First Street. Map © Google.
Why this score? — see what drove the B- grade
The composite is a weighted blend of 9 inputs, each scored 0–100. Each bar is that input's sub-score; the figure is the points it added to the 100-point composite (weight × sub-score).
- Cash flow +26.4/30.0
- ARV discount +15.0/15.0
- DSCR +9.0/10.0
- 1% rule +7.7/10.0
- Livability +3.9/5.0
- Schools +3.0/10.0
- Rent growth +2.5/5.0
- Condition / age +2.5/5.0
- Appreciation +0.0/10.0
$340,000
🖨 Deal sheet 📄 Offer letter ✓ Due diligence
Multi-family units
County records classify this as Multi-Family (2-4 Unit). Listing-text estimate: 3 units. confirmed
Listing remarks MLS
CALL ALL INVESTORS! This well-kept three family property located in highly a sought-after neighborhood in Schenectady offers strong income potential. The first floor features a large 4-bedroom, 1 bath unit, while the second-floor hosts two separates 1-bedroom, 1-bath units, perfect for steady rental returns. This property is conveniently located near bus lines, schools and shopping.
Key facts
- 6,534 sq ft lot
- Parking
- Built 1910
Tags
Neighborhood map
What this means for you Summary
Snapshot
- This is a 3 × 2-bed/1.0-bath units multifamily listed at $340k.
Deal economics
- At list price, monthly cash flow is $885 ($11k/yr) — positive. Per door: $295/mo.
- The deal already cash-flows at list — no discount required.
- Meets the 1% rule at list price ($4k rent vs $340k).
- Recommended offer: $299k (12.0% below list) — sets the bar for market timing.
- Cap rate 9.4% vs local median 6.3% in Schenectady — top-decile yield for the area; either an underpriced asset or a hidden risk that comps aren't pricing in. Stress-test before assuming the spread holds.
Location & tenants
- Location reads 78/100 on livability (#167 in NY, #2,597 nationally) — a middle-class / working-renter tenant base. Strengths: commute A+, health & safety A+, cost of living A; Watch: schools C-, employment D+, crime F.
- Schenectady City School District (urban): math 38% / reading 34% proficiency, ranked #556 of 590 in NY (top 94%) — families likely to look elsewhere, expect single-tenant / working-renter base with shorter leases; 65% free/reduced lunch — lower-income household profile, screen leases tightly.
- Market conditions: 106 active listings in the ZIP; 2 comparable units currently listed for rent nearby; 154 units permitted in Schenectady County in 2024 (54 in 5+ unit buildings).
Forward outlook
- Local home prices are declining (-3.0%/yr); year-one equity from $2k of loan paydown is wiped out by about $10k of value loss. Plan a longer hold.
- Schenectady County population projected to shrink 4% by 2050 — rents likely to lag national; underwrite the cash flow, not the appreciation.
- At projected returns (-3.0% appreciation + 3.0% rent growth), your $95k cash investment doubles in ~10 years — after that, you're playing with house money.
Negotiation context
- It's been on market 192 days — a 12% lower offer ($299k) is reasonable based on typical stale-listing flexibility.
- 4 sale attempts since 3y ago with the ask held roughly flat each time — persistent listings suggest the price (not the market) is what's stuck; bring a comps-based counter.
- Current owner paid $295k; 15% above their basis — modest negotiation headroom, anchor on the comps not their cost.
Risks & watch-outs
- Watch-outs: built in 1910 — expect roof / HVAC / electrical / plumbing capex.
Questions for the listing agent
- It's been on market 192 days. Have you received any prior offers? Is the seller open to a 12% concession, seller financing, or rate buy-down credit?
- Can we see the unit-by-unit rent roll, current vacancy, and any below-market leases? What's the average tenancy length?
- What capital expenditures (roof, boiler, parking lot, exteriors) have been made in the last 5 years, and what's planned in the next 2?
- Built in 1910 — when were the roof, HVAC, electrical panel, plumbing, and water heater last replaced?
- Why hasn't it sold? Are there any deal-killer items the seller is aware of (foundation, flood, title, zoning, code violations)?
- Is there a deadline driving the sale (1031 exchange, divorce, estate, relocation)? That informs how much negotiation room exists.
- Crime grade is F in this area — have there been break-ins, vandalism, or insurance claims at this property in the last 3 years? What carrier currently insures it and at what premium?
- What's the average days-on-market for RENTAL listings here right now (not sales)? A rising rental-DOM trend means longer vacancies and softer asking-rent achievability than the comps imply.
- What's the recent tenant-quality profile in this submarket — average credit score on applications, eviction rate, late-payment / NSF rate, and stable-employment percentage? A property-management company in the area should have these aggregated.
- How much new apartment / multifamily construction is in the pipeline within 1–3 miles? Heavy new supply (>2% of stock underway) typically softens rents 12–24 months out; light construction supports rent growth.
Investment metrics
- 1% rule
- 1.27% ✓
- Cap rate
- 9.42%
- Cash-on-cash
- 11.16%
- DSCR
- 1.50
- GRM
- 6.6
CMA / ARV
- ARV (median comp)
- $411,067
- List price
- $340,000
- Delta
- -17.29%
- Verdict
- UNDERPRICED
- Comps
- 20 within 1.0 mi
Show comp detail 12 sales within ~0.75 mi
| Address | Dist | Beds/Ba | Sqft | Sold | Price | $/sf | Match |
|---|---|---|---|---|---|---|---|
| 16 Hawk St | 0.35mi | 6/2.0 (+1) | 2,584 (-8%) | 0mo | $370,000 | $143 | 62 |
| 25 Steuben St | 0.49mi | 6/3.0 (+1) | 2,640 (-6%) | 1mo | $265,000 | $100 | 61 |
| 309 Mcclellan St | 0.29mi | 6/2.0 (+1) | 2,572 (-8%) | 6mo | $312,000 | $121 | 59 |
| 223-25 Furman St | 0.24mi | 5/4.0 | 2,500 (-11%) | 10mo | $335,000 | $134 | 58 |
| 152 Elmer Ave | 0.47mi | 5/2.0 | 2,568 (-8%) | 5mo | $290,000 | $113 | 56 |
| 222 Duane Ave | 0.61mi | 6/2.0 (+1) | 2,700 (-4%) | 1mo | $329,900 | $122 | 56 |
| 450 N Brandywine Ave | 0.42mi | 6/2.0 (+1) | 2,706 (-4%) | 12mo | $285,000 | $105 | 56 |
| 154 Elmer Ave | 0.46mi | 4/2.0 (-1) | 2,568 (-8%) | 5mo | $276,000 | $107 | 52 |
| 1013 Delamont Ave | 0.60mi | 6/2.0 (+1) | 2,576 (-8%) | 1mo | $111,500 | $43 | 48 |
| 434 Division St | 0.44mi | 5/2.0 | 2,400 (-14%) | 7mo | $170,000 | $71 | 46 |
| 1 Chestnut St | 0.62mi | 6/3.0 (+1) | 2,406 (-14%) | 2mo | $290,000 | $121 | 41 |
| 1318 Poplar St | 0.42mi | 6/2.0 (+1) | 2,408 (-14%) | 10mo | $310,000 | $129 | 40 |
Match score weights: distance 35% · size 25% · config 20% · recency 20%. Top-matched comps best support the ARV.
Projected returns pro-forma
-3.0% appreciation · 3.0% rent growth · sell at horizon
- IRR
- 0.4%
- Equity multiple
- 1.02×
- Total profit
- $1,453
- Equity at exit
- $50,695
- IRR
- 10.1%
- Equity multiple
- 1.78×
- Total profit
- $74,550
- Equity at exit
- $29,397
Cash invested: $95,200 (down + closing). Projections, not guarantees.
Landlord ↔ Tenant lean methodology
- Overall (STATE)
- 15 Strongly Tenant-Friendly
- State New York
- 15 Strongly Tenant-Friendly · D+10
- County
- — inherits STATE
- City
- — inherits STATE
ZIP-level market 12304
- Home prices YoY
- -25.5%
- Active inventory
- 106
- Price-to-rent
- 19.7×
Monthly cashflow live
- Estimated rent
- $4,310 high interval (Pro) →
- Mortgage (P&I)
- −$1,783
- Tax from tax record
- −$595 /mo · $7,141/yr
- Insurance
- −$142
- HOA
- −$0
- Vacancy / Maint / Mgmt
- −$905
- Net cashflow
- $885
Break-even live
3-unit breakdown (identical units grouped — click to expand)
| Units | Beds | Baths | Est. rent |
|---|---|---|---|
| 3× units | 2 | 1 | $4,311 |
| #1 | 2 | 1 | $1,437 |
| #2 | 2 | 1 | $1,437 |
| #3 | 2 | 1 | $1,437 |
| Total (3 units) | $4,310 | ||
UW: 25.0% down · 7.5% · 30yr · 1.5% tax · 5.0% vac · 8.0% maint · 8.0% mgmt
Financing live
Cash to close
- Down payment
- $85,000
- Closing costs
- $10,200
- Reserves months
- —
- Total cash needed
- —
Loan-product check · same deal, 3 products live
Conventional
25% down · 7.5% · 30yr
- Down + closing
- —
- Monthly P&I
- —
- Monthly cashflow
- —
- DSCR
- —
- Eligible?
- —
Personal DTI + credit; lowest rate.
DSCR
20% down · 8.5% · 30yr
- Down + closing
- —
- Monthly P&I
- —
- Monthly cashflow
- —
- DSCR
- —
- Eligible?
- —
No personal income docs; deal must DSCR.
Hard money
10% down · 12.0% · 12mo
- Down + closing
- —
- Monthly P&I
- —
- Monthly cashflow
- —
- DSCR
- —
- Eligible?
- —
Short-term bridge; refi at stabilization.
Rent comps 2 comps
| Address | Beds | Baths | Sqft | Rent | $/sqft | DOM | Units | Dist |
|---|---|---|---|---|---|---|---|---|
| 1347 Union St Schenectady, NY | 4.0 | 1.5 | 2188 | $3,750 | $1.71 | 44d | 1 | 0.73mi |
| 1346 10th Ave Schenectady, NY | 4.0 | 2.0 | 2350 | $2,499 | $1.06 | 14d | 1 | 1.36mi |
Listing history 12 events
-
2026-03-31price $340,000 395-char remark
Show marketing remark (395 chars)
CALL ALL INVESTORS! This well-kept three family property located in highly a sought-after neighborhood in Schenectady offers strong income potential. The first floor features a large 4-bedroom, 1 bath unit, while the second-floor hosts two separates 1-bedroom, 1-bath units, perfect for steady rental returns. This property is conveniently located near bus lines, schools and shopping.
-
2026-01-06price $349,500 395-char remark
Show marketing remark (395 chars)
CALL ALL INVESTORS! This well-kept three family property located in highly a sought-after neighborhood in Schenectady offers strong income potential. The first floor features a large 4-bedroom, 1 bath unit, while the second-floor hosts two separates 1-bedroom, 1-bath units, perfect for steady rental returns. This property is conveniently located near bus lines, schools and shopping.
-
2025-11-16$355,000 Active 395-char remark
Show marketing remark (395 chars)
CALL ALL INVESTORS! This well-kept three family property located in highly a sought-after neighborhood in Schenectady offers strong income potential. The first floor features a large 4-bedroom, 1 bath unit, while the second-floor hosts two separates 1-bedroom, 1-bath units, perfect for steady rental returns. This property is conveniently located near bus lines, schools and shopping.
-
2025-04-11soldstatus $295,000
-
2025-01-14historical $1,500
-
2025-01-10$1,500
-
2024-12-20soldstatus $295,000 Closed 606-char remark
Show marketing remark (606 chars)
This 3-unit property boasts great rental income potential and has been well-maintained with recent upgrades including 3 new hot air furnaces, new water heaters, and 3 new electrical panels. But that's not all—this property is part of a larger portfolio of five buildings, presenting an incredible investment opportunity. The portfolio includes a mix of residential and commercial properties, all situated in highly desirable locations. Whether you're looking to expand your real estate holdings or seeking a solid investment with excellent growth potential, this portfolio offers diversity and value.
-
2024-09-17status Pending 606-char remark
Show marketing remark (606 chars)
This 3-unit property boasts great rental income potential and has been well-maintained with recent upgrades including 3 new hot air furnaces, new water heaters, and 3 new electrical panels. But that's not all—this property is part of a larger portfolio of five buildings, presenting an incredible investment opportunity. The portfolio includes a mix of residential and commercial properties, all situated in highly desirable locations. Whether you're looking to expand your real estate holdings or seeking a solid investment with excellent growth potential, this portfolio offers diversity and value.
-
2024-08-09$319,900 Active 606-char remark
Show marketing remark (606 chars)
This 3-unit property boasts great rental income potential and has been well-maintained with recent upgrades including 3 new hot air furnaces, new water heaters, and 3 new electrical panels. But that's not all—this property is part of a larger portfolio of five buildings, presenting an incredible investment opportunity. The portfolio includes a mix of residential and commercial properties, all situated in highly desirable locations. Whether you're looking to expand your real estate holdings or seeking a solid investment with excellent growth potential, this portfolio offers diversity and value.
-
2023-11-23historical
-
2023-05-22$329,900 Active
-
2002-06-28soldstatus $35,000
ⓘ Source: listings_history table (triggers on properties + properties_extension) + one-shot
backfill from property_details.listing_events for pre-trigger history.
Tax reassessment forecast NY · Partial reset (capped growth)
- Current annual tax
- $7,141 · $595/mo
- Projected year-2 tax
- $7,141 · $595/mo
- Expected delta
- $0/yr ($0/mo · 0.0%)
ⓘ Screening estimate from a state-policy table — verify with the county assessor before closing.
Climate risk First Street
- Flood 1/10 Low FEMA zone X (unshaded) · 0% chance over 30 yrs
- Wildfire 1/10 Low
- Heat 4/10 Moderate 7 d/yr ≥95°F today · 17 d/yr by 30 yrs out
- Wind 2/10 Low 4% chance of damaging wind over 30 yrs
- Air quality 1/10 Low 0 unhealthy d/yr today · 0 by 30 yrs out
Nearby sold comps map
Loading sold comps map…
Walkable amenities ~0.75 mi
Loading nearby amenities…
Taxation est. · year 1
- Rental income
- $51,720
- − Mortgage interest
- −$19,045
- − Property taxes
- −$7,141
- − Insurance
- −$1,700
- − Repairs & maintenance
- −$4,138
- − Management
- −$4,138
- − Depreciation
- −$9,891
- Taxable income
- $5,668
- Est. tax owed @ 24.0%
- −$1,360
- After-tax cash flow
- $9,262/yr
For passive investors: Depreciation is non-cash, so a rental often shows a tax loss while cash-flowing — sheltering income. Rental losses are passive: they offset passive income freely, and up to $25,000/yr can offset ordinary (W-2) income if you actively participate and your MAGI is under $100k (phasing out to $0 by $150k); unused losses carry forward. On sale, claimed depreciation is recaptured at up to 25%, and gains may owe capital-gains tax (a 1031 exchange can defer both). Figures are a year-1 estimate at your 24.0% rate — not tax advice; consult a CPA.
Schools (NCES district)
- District
- Schenectady City School District
- NCES district ID
- 3626010
- Math proficiency
- 38% ▲ 12.00%
- Reading proficiency
- 34% ▲ 2.00%
- Median HH income
- $39,453
- Composite
- 30.2/100
- National rank
- #6309
- State rank
- #556 of 590 in NY
Livability — Schenectady
- Score
- 78/100
- State rank
- #167
- US rank
- #2597
Category grades
Schools grade is shown separately in the Schools card above.
Census & demographics
- Census place
- Schenectady, NY
- City population
- 141,369
- Population (ZIP)
- 22,027
Population outlook (Schenectady County) Hauer SSP2
- Today (2025)
- 155,046 people
- By 2030
- 154,322 · -0.5%
- By 2040
- 151,796 · -2.1%
- By 2050
- 148,621 · -4.1%
- By 2075
- 141,229 · -8.9%
- By 2100
- 126,014 · -18.7%
Race, ethnicity, and origin ACS 2023
- Neighborhood character
- Diverse neighborhood (Simpson 0.68)
- Race & ethnicity
- White 52% Black 17% Two or more races 13% Asian 10% Hispanic / Latino 9%
- Hispanic origin (detail)
- Mexican 2% Puerto Rican 3% Dominican 2%
- Common ancestry
- Lithuanian 6% Romanian 4% Iranian 1%
- Foreign-born
- 16% · Canada, China, South Korea
- Languages at home
- 89% English-only · Other Indo-European 5% Spanish 4% Other Asian/Pacific 1%
Political lean MEDSL · Schenectady
- 2024 margin
- D (+10.8) · D 55.4% · R 44.6%
- 2008→2024 swing
- -1.8pp toward R · 2008: 12.7pp · 2024: 10.8pp
- All cycles
- 2024: D+10.8 2020: D+15.7 2016: D+5.8 2012: D+15.4 2008: D+12.7
Not yet ingested
- Civics
- —
Market trends
- HPI YoY
- ▼ -113.18%
- Current HPI
- 331.0288
- Rent YoY
- —
- Metro
- —
- State GDP YoY
- ▲ 2.60%
- F500 in state
- 92
Industry mix (Fortune 500 HQ in NY)
| Industry | F500 HQs | Revenue |
|---|---|---|
| Financial Services | 10 | $950B |
|
||
| Consumer Goods | 9 | $162B |
|
||
| Insurance | 4 | $225B |
|
||
| Telecommunications | 2 | $144B |
|
||
| Pharmaceuticals | 2 | $112B |
|
||
| Media / Entertainment | 2 | $69B |
|
||
Price history
+871.4% since first listed12 events — show timeline
- 2026-03-31 Price Changed $340,000 Global MLS
- 2026-01-06 Price Changed $349,500 Global MLS
- 2025-11-16 Listed $355,000 Global MLS
- 2025-04-11 Sold (Public Records) $295,000 Public Records
- 2025-01-14 Rental Removed $1,500 GLOBALMLS
- 2025-01-10 Listed for Rent $1,500 GLOBALMLS
- 2024-12-20 Sold (MLS) $295,000 Global MLS
- 2024-09-17 Pending — Global MLS
- 2024-08-09 Listed $319,900 Global MLS
- 2023-11-23 Listing Removed — Global MLS
- 2023-05-22 Listed $329,900 Global MLS
- 2002-06-28 Sold (Public Records) $35,000 Public Records
Property tax history
+0.9%/yrLatest (2025): $7,141 · +4.1% YoY. Source: county tax records.
Cash-flow waterfall
monthlySold comps — $/sqft
last 12 mo · ≤1 miLoading sold comps…