 Triplex
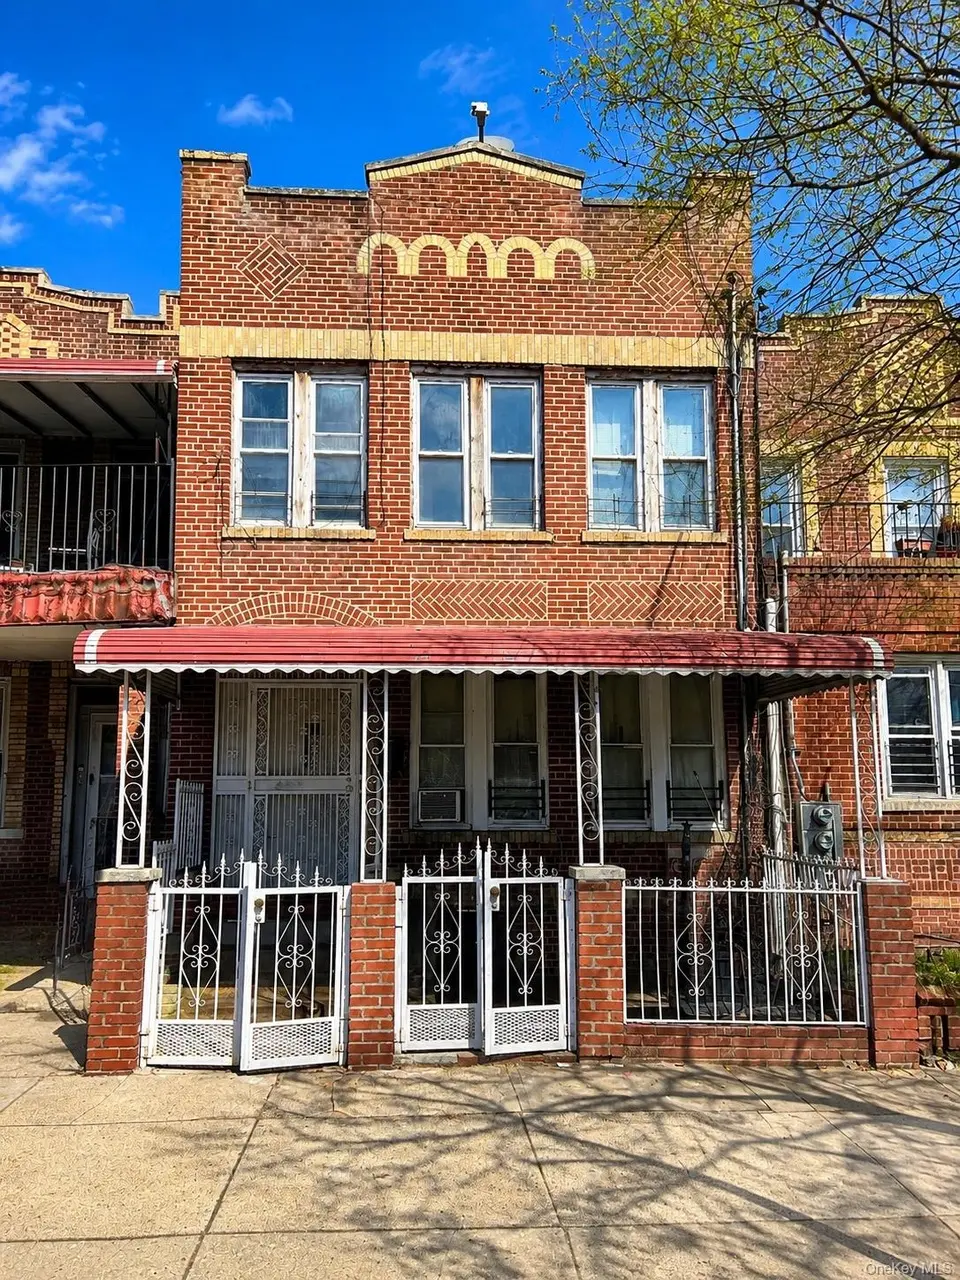
1253 Blake Ave · New York, NY
Flood risk 6/10 · Moderate
- FEMA flood zone
- X (unshaded)
- Chance of flooding over 30 yrs
- 0.73%
- Est. flood insurance / yr
- $507 – $1,088
Fire risk 1/10 · Minimal
- Est. fire insurance / yr
- $691 – $1,283
Heat risk 7/10 · Major
- Hot days now (above 99°F)
- 7 days/yr
- Hot days in 30 yrs
- 15 days/yr
Wind risk 6/10 · Moderate
- Chance of severe wind over 30 yrs
- 65.0%
Air-quality risk 5/10 · Moderate
- Unhealthy air days now
- 6 days/yr
- Unhealthy air days in 30 yrs
- 8 days/yr
Risk factors via First Street. Map © Google.
Why this score? — see what drove the F grade
The composite is a weighted blend of 9 inputs, each scored 0–100. Each bar is that input's sub-score; the figure is the points it added to the 100-point composite (weight × sub-score).
- Cash flow +12.9/30.0
- Schools +5.0/10.0
- Rent growth +4.0/5.0
- DSCR +3.9/10.0
- Livability +3.8/5.0
- Condition / age +2.5/5.0
- 1% rule +2.4/10.0
- ARV discount +0.0/15.0
- Appreciation +0.0/10.0
$1,199,000
🖨 Deal sheet (PDF) 📄 Offer letter ✓ Due diligence
Multi-family units
County records classify this as Multi-Family (2-4 Unit). Listing-text estimate: 3 units. confirmed
Listing remarks
Legal Three-Family Income Property in Cypress Hills, Brooklyn Opportunity awaits at this legal three-family brick property in the Cypress Hills section of Brooklyn. Featuring approximately 2,450 square feet of living space, this income-producing building includes a spacious three-bedroom unit with an office on the first floor, plus two additional apartments on the second level. The property also features a full finished basement with access to the rear yard, providing additional usable space and flexibility. With two vacant units, this property offers an excellent opportunity for investors or owner-occupants seeking rental income. Conveniently located near transportation, shopping, and eve
Key facts
- Rear yard access
- Multi unit property
- 2,240 sq ft lot
Tags
Property features AI
Exterior
- Parking: On-street parking
- Utilities: Con-Edison electric; Public sewer; Cable available; Electricity connected; Natural gas connected; Phone available; Sewer connected; Public trash collection; Water connected
- Home design: Duplex; Described as fixer condition
- Construction: Brick exterior; Brick/mortar foundation
- Exterior features: Brick construction; No waterfront
Interior
- Bedrooms: One 1-bedroom unit; One 2-bedroom unit; One 3-bedroom unit
- Flooring: Combination flooring; Hardwood; Laminate
- Bathrooms: Three full bathrooms
- Heating & cooling: Natural gas heating; Wall/window air conditioning units
- Interior features: First-floor bedroom; First-floor full bathroom; Finished full basement with walk-out access
Neighborhood map
What this means for you Summary
Snapshot
- This is a 3 × 2-bed/1.0-bath units multifamily listed at $1.20M.
Deal economics
- At list price, monthly cash flow is $-83 ($-990/yr) — negative. Per door: $-28/mo.
- To cash-flow at today's rent, offer at most $1.18M (1.2% below list).
- To meet the 1% rule (rent ≥ 1% of price), the offer needs to be $889k (25.8% below list).
- Recommended offer: $889k (25.8% below list) — sets the bar for 1% rule.
- Cap rate 6.2% vs local median 2.6% in New York — top-decile yield for the area; either an underpriced asset or a hidden risk that comps aren't pricing in. Stress-test before assuming the spread holds.
Location & tenants
- Location reads 75/100 on livability (#268 in NY, #4,188 nationally) — a middle-class / working-renter tenant base. Strengths: amenities A+, commute A+, health & safety A; Watch: crime F, cost of living F.
- Market conditions: Rents rising fast (+6.1%/yr); 193 active listings in the ZIP; 10,063 units permitted in Kings County in 2024 (9,789 in 5+ unit buildings).
- At $8,892/mo this rent would consume 172% of the median local household income ($62k/yr) (locally 7574% of renters already pay >50% of income on rent) — very limited rent-growth headroom before tenants either downsize or default.
Forward outlook
- Local home prices are declining (-3.0%/yr); year-one equity from $8k of loan paydown is wiped out by about $36k of value loss. Plan a longer hold.
- Kings County population projected at +13% by 2050 — modest demand growth; plan on rents tracking national, not racing it.
Negotiation context
- Only 13 days on market — expect competitive offers; lowballing is unlikely to land.
- 4 sale attempts since 3y ago with the ask held roughly flat each time — persistent listings suggest the price (not the market) is what's stuck; bring a comps-based counter.
- Current owner paid $410k; list at $1.20M implies a 192% gain — meaningful room to come down on a strong offer.
Risks & watch-outs
- Watch-outs: built in 1920 — expect roof / HVAC / electrical / plumbing capex.
- Climate carrying-cost: major flood risk; major wind risk, 65% chance of damaging wind over 30y; extreme-heat days projected 7→15/yr by 2055 (HVAC capex compounding) — expect insurance premiums to compound above CPI over the hold.
Questions for the listing agent
- What do current leases actually rent for vs. the listed asking? Can we see a recent rent roll and the last 12 months of T-12 income?
- Can we see the unit-by-unit rent roll, current vacancy, and any below-market leases? What's the average tenancy length?
- What capital expenditures (roof, boiler, parking lot, exteriors) have been made in the last 5 years, and what's planned in the next 2?
- Built in 1920 — when were the roof, HVAC, electrical panel, plumbing, and water heater last replaced?
- Is there a deadline driving the sale (1031 exchange, divorce, estate, relocation)? That informs how much negotiation room exists.
- Schools are B-rated — typically a magnet for longer-tenancy family renters. What's the average tenant stay here, and is there a school-zone premium baked into asking?
- Crime grade is F in this area — have there been break-ins, vandalism, or insurance claims at this property in the last 3 years? What carrier currently insures it and at what premium?
- The area grade is low — what's the realistic commute time and amenity access for the typical tenant pool here? Any planned neighborhood developments (good or bad) we should know about?
- What's the average days-on-market for RENTAL listings here right now (not sales)? A rising rental-DOM trend means longer vacancies and softer asking-rent achievability than the comps imply.
- What's the recent tenant-quality profile in this submarket — average credit score on applications, eviction rate, late-payment / NSF rate, and stable-employment percentage? A property-management company in the area should have these aggregated.
- How much new apartment / multifamily construction is in the pipeline within 1–3 miles? Heavy new supply (>2% of stock underway) typically softens rents 12–24 months out; light construction supports rent growth.
Investment metrics
- 1% rule
- 0.74% ✗
- Cap rate
- 6.21%
- Cash-on-cash
- -0.29%
- DSCR
- 0.99
- GRM
- 11.2
CMA / ARV
- ARV (on-the-fly)
- $999,600
- Comps found
- 11
Show comp detail 11 sales within ~0.75 mi
| Address | Dist | Beds/Ba | Sqft | Sold | Price | $/sf | Match |
|---|---|---|---|---|---|---|---|
| 661 Euclid Ave | 0.05mi | 6/2.0 | 2,180 (-11%) | 2mo | $890,000 | $408 | 74 |
| 852 Glenmore Ave | 0.51mi | 6/3.0 | 2,484 (+1%) | 1mo | $995,000 | $401 | 73 |
| 654 Autumn Ave | 0.17mi | 5/4.0 (-1) | 2,340 (-4%) | 10mo | $900,000 | $385 | 67 |
| 400 Crescent St | 0.51mi | 6/3.0 | 2,346 (-4%) | 6mo | $1,175,000 | $501 | 64 |
| 982 Dumont Ave | 0.66mi | 6/3.0 | 2,452 (+0%) | 9mo | $847,390 | $346 | 62 |
| 962 Hemlock St | 0.50mi | 6/3.0 | 2,537 (+4%) | 11mo | $900,500 | $355 | 61 |
| 762 Belmont Ave | 0.58mi | 7/3.0 (+1) | 2,520 (+3%) | 7mo | $1,140,000 | $452 | 57 |
| 307 Berriman St | 0.43mi | 6/4.0 | 2,112 (-14%) | 1mo | $880,000 | $417 | 52 |
| 759 Drew St | 0.50mi | 6/4.0 | 2,132 (-13%) | 2mo | $940,000 | $441 | 50 |
| 304 Sheridan Ave | 0.31mi | 7/5.0 (+1) | 2,340 (-4%) | 19mo | $1,100,000 | $470 | 49 |
| 471 Shepherd Ave | 0.52mi | 5/3.5 (-1) | 2,800 (+14%) | 20mo | $989,000 | $353 | 28 |
Match score weights: distance 35% · size 25% · config 20% · recency 20%. Top-matched comps best support the ARV.
Projected returns pro-forma
-3.0% appreciation · 6.14% rent growth · sell at horizon
- IRR
- -13.9%
- Equity multiple
- 0.49×
- Total profit
- $-171,160
- Equity at exit
- $178,775
- IRR
- -1.2%
- Equity multiple
- 0.91×
- Total profit
- $-31,377
- Equity at exit
- $103,668
Cash invested: $335,720 (down + closing). Projections, not guarantees.
Landlord ↔ Tenant lean methodology
- Overall (CITY)
- 0 Strongly Tenant-Friendly
- State New York
- 15 Strongly Tenant-Friendly · D+10
- County
- — inherits STATE
- City New York
- 0 Strongly Tenant-Friendly · D+34
ZIP-level market 11208
- Rents YoY
- 6.1%
- Active inventory
- 193
- Price-to-rent
- 33.7×
Monthly cashflow live
- Estimated rent
- $8,892 high interval (Pro) →
- Mortgage (P&I)
- −$6,288
- Tax from tax record
- −$320 /mo · $3,839/yr
- Insurance
- −$500
- HOA
- −$0
- Vacancy / Maint / Mgmt
- −$1,867
- Net cashflow
- $-83
Break-even live
Sensitivity live
| Price | -10% $596 | -5% $257 | +0% $-83 | +5% $-422 | +10% $-761 |
|---|---|---|---|---|---|
| Rent | -10% $-785 | -5% $-434 | +0% $-83 | +5% $269 | +10% $620 |
| Rate | -1.0pp $521 | -0.5pp $222 | base $-83 | +0.5pp $-393 | +1.0pp $-709 |
3-unit breakdown (identical units grouped — click to expand)
| Units | Beds | Baths | Est. rent |
|---|---|---|---|
| 3× units | 2 | 1 | $8,892 |
| #1 | 2 | 1 | $2,964 |
| #2 | 2 | 1 | $2,964 |
| #3 | 2 | 1 | $2,964 |
| Total (3 units) | $8,892 | ||
UW: 25.0% down · 7.5% · 30yr · 1.5% tax · 5.0% vac · 8.0% maint · 8.0% mgmt
Financing live
Cash to close
- Down payment
- $299,750
- Closing costs
- $35,970
- Reserves months
- —
- Total cash needed
- —
Loan-product check · same deal, 3 products live
Conventional
25% down · 7.5% · 30yr
- Down + closing
- —
- Monthly P&I
- —
- Monthly cashflow
- —
- DSCR
- —
- Eligible?
- —
Personal DTI + credit; lowest rate.
DSCR
20% down · 8.5% · 30yr
- Down + closing
- —
- Monthly P&I
- —
- Monthly cashflow
- —
- DSCR
- —
- Eligible?
- —
No personal income docs; deal must DSCR.
Hard money
10% down · 12.0% · 12mo
- Down + closing
- —
- Monthly P&I
- —
- Monthly cashflow
- —
- DSCR
- —
- Eligible?
- —
Short-term bridge; refi at stabilization.
Listing history 8 events
-
2026-06-21days on market $1,199,000 Active 13 DOM
-
2026-06-18days on market $1,199,000 Active 10 DOM
-
2026-06-17days on market $1,199,000 Active 9 DOM
-
2026-06-16days on market $1,199,000 Active 8 DOM
-
2026-06-15days on market $1,199,000 Active 7 DOM
-
2026-06-13days on market $1,199,000 Active 5 DOM
-
2026-06-08remarks 699-char remark
-
2026-06-08$1,199,000 Active 1 DOM
ⓘ Source: listings_history table (triggers on properties + properties_extension) + one-shot
backfill from property_details.listing_events for pre-trigger history.
Tax reassessment forecast NY · Partial reset (capped growth)
- Current annual tax
- $3,839 · $320/mo
- Projected year-2 tax
- $12,051 · $1,004/mo
- Expected delta
- +$8,212/yr (+$684/mo · 213.9%)
ⓘ Screening estimate from a state-policy table — verify with the county assessor before closing.
Climate risk First Street
- Flood 6/10 Major FEMA zone X (unshaded) · 73% chance over 30 yrs
- Wildfire 1/10 Low
- Heat 7/10 Severe 7 d/yr ≥99°F today · 15 d/yr by 30 yrs out
- Wind 6/10 Major 65% chance of damaging wind over 30 yrs
- Air quality 5/10 Major 6 unhealthy d/yr today · 8 by 30 yrs out
Nearby sold comps map
Loading sold comps map…
Walkable amenities ~0.75 mi
Loading nearby amenities…
Taxation est. · year 1
- Rental income
- $106,704
- − Mortgage interest
- −$67,163
- − Property taxes
- −$3,839
- − Insurance
- −$5,995
- − Repairs & maintenance
- −$8,536
- − Management
- −$8,536
- − Depreciation
- −$34,880
- Taxable loss
- −$22,245
- Est. tax savings @ 24.0%
- +$5,339
- After-tax cash flow
- $4,349/yr
For passive investors: Depreciation is non-cash, so a rental often shows a tax loss while cash-flowing — sheltering income. Rental losses are passive: they offset passive income freely, and up to $25,000/yr can offset ordinary (W-2) income if you actively participate and your MAGI is under $100k (phasing out to $0 by $150k); unused losses carry forward. On sale, claimed depreciation is recaptured at up to 25%, and gains may owe capital-gains tax (a 1031 exchange can defer both). Figures are a year-1 estimate at your 24.0% rate — not tax advice; consult a CPA.
Schools (NCES district)
No district data.
Livability — New York
- Score
- 75/100
- State rank
- #268
- US rank
- #4188
Category grades
Schools grade is shown separately in the Schools card above.
Census & demographics
- Census place
- New York, NY
- County
- Kings County · 2,614,986 people
- City population
- 7,731,280
- Metro
- New York-Newark-Jersey City, NY-NJ-PA
- Population (ZIP)
- 105,428
- Household income
- $62,077
- Rent vs Own
- Severe rent burden
- 7574.0
Population outlook (Kings County) Hauer SSP2
- Today (2025)
- 2,847,441 people
- By 2030
- 2,937,006 · +3.1%
- By 2040
- 3,095,491 · +8.7%
- By 2050
- 3,228,968 · +13.4%
- By 2075
- 3,321,723 · +16.7%
- By 2100
- 3,111,387 · +9.3%
Race, ethnicity, and origin ACS 2023
- Neighborhood character
- Diverse neighborhood (Simpson 0.66)
- Race & ethnicity
- Black 42% Hispanic / Latino 39% Asian 10% Two or more races 8% White 3%
- Hispanic origin (detail)
- Mexican 2% Puerto Rican 9% Dominican 16%
- Common ancestry
- Hispanic 1%
- Foreign-born
- 40% · Canada, China, Mexico
- Languages at home
- 48% English-only · Spanish 36% Other Indo-European 11% French/Haitian/Cajun 1%
Political lean MEDSL · Kings
- 2024 margin
- Solid D (+44.0) · D 72.0% · R 28.0%
- 2008→2024 swing
- -15.5pp toward R · 2008: 59.4pp · 2024: 44.0pp
- All cycles
- 2024: D+44.0 2020: D+54.8 2016: D+61.8 2012: D+63.9 2008: D+59.4
Not yet ingested
- Civics
- —
Market trends
- HPI YoY
- ▼ -546.38%
- Current HPI
- 376.1489
- Rent YoY
- ▲ 6.14%
- Metro
- New York-Newark-Jersey City, NY-NJ-PA
- State GDP YoY
- ▲ 2.60%
- F500 in state
- 92
Industry mix (Fortune 500 HQ in NY)
| Industry | F500 HQs | Revenue |
|---|---|---|
| Financial Services | 10 | $950B |
|
||
| Consumer Goods | 9 | $162B |
|
||
| Insurance | 4 | $225B |
|
||
| Telecommunications | 2 | $144B |
|
||
| Pharmaceuticals | 2 | $112B |
|
||
| Media / Entertainment | 2 | $69B |
|
||
Price history
+699.3% since first listed17 events — show timeline
- 2026-06-08 Listed $1,199,000 OneKey® MLS as Distributed by MLS Grid
- 2025-06-18 Listing Removed — OneKey® MLS as Distributed by MLS Grid
- 2025-04-20 Price Changed $1,099,000 BNYMLS
- 2025-04-19 Price Changed $1,099,000 OneKey® MLS as Distributed by MLS Grid
- 2025-03-17 Listed $1,149,000 OneKey® MLS as Distributed by MLS Grid
- 2025-03-01 Listing Removed — OneKey® MLS as Distributed by MLS Grid
- 2025-01-31 Price Changed $1,149,000 BNYMLS
- 2025-01-31 Price Changed $1,149,000 OneKey® MLS as Distributed by MLS Grid
- 2024-10-29 Listed $1,199,000 OneKey® MLS as Distributed by MLS Grid
- 2023-10-30 Listing Removed — OneKey® MLS as Distributed by MLS Grid
- 2023-10-24 Price Changed $1,000,075 OneKey® MLS as Distributed by MLS Grid
- 2023-08-07 Price Changed $1,000,050 OneKey® MLS as Distributed by MLS Grid
- 2023-06-29 Price Changed $999,999 OneKey® MLS as Distributed by MLS Grid
- 2023-06-15 Price Changed $1,099,000 OneKey® MLS as Distributed by MLS Grid
- 2023-04-13 Listed $1,200,000 OneKey® MLS as Distributed by MLS Grid
- 2004-10-18 Sold (Public Records) $410,000 Public Records
- 1995-10-30 Sold (Public Records) $150,000 Public Records
Property tax history
+4.7%/yrLatest (2025): $3,839 · -1.6% YoY. Source: county tax records.
Cash-flow waterfall
monthlySold comps — $/sqft
last 12 mo · ≤1 miLoading sold comps…