 🏷️ Likely Rental
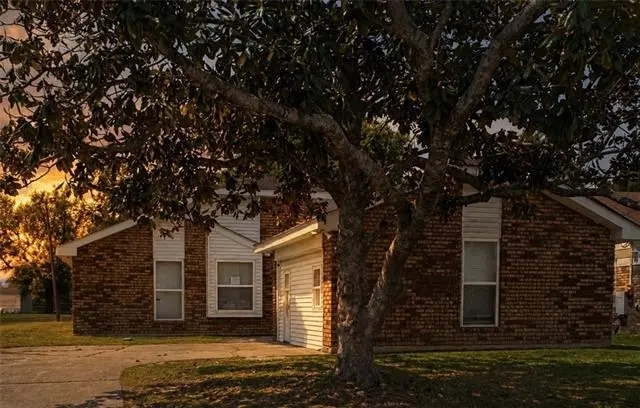
113 Historic West St · Garyville, LA
Flood risk 1/10 · Minimal
- FEMA flood zone
- X (shaded)
- Chance of flooding over 30 yrs
- 0.0%
- Est. flood insurance / yr
- $507 – $1,088
Fire risk 1/10 · Minimal
- Est. fire insurance / yr
- $1,269 – $2,357
Heat risk 9/10 · Severe
- Hot days now (above 108°F)
- 7 days/yr
- Hot days in 30 yrs
- 21 days/yr
Wind risk 9/10 · Severe
- Chance of severe wind over 30 yrs
- 99.0%
Air-quality risk 2/10 · Minimal
- Unhealthy air days now
- 0 days/yr
- Unhealthy air days in 30 yrs
- 1 days/yr
Risk factors via First Street. Map © Google.
Why this score? — see what drove the B- grade
The composite is a weighted blend of 9 inputs, each scored 0–100. Each bar is that input's sub-score; the figure is the points it added to the 100-point composite (weight × sub-score).
- Cash flow +20.0/30.0
- ARV discount +15.0/15.0
- Appreciation +10.0/10.0
- DSCR +6.3/10.0
- 1% rule +4.6/10.0
- Livability +3.2/5.0
- Rent growth +2.5/5.0
- Condition / age +2.5/5.0
- Schools +1.7/10.0
$142,500
🖨 Deal sheet 📄 Offer letter ✓ Due diligence
Listing remarks MLS
Welcome to Garyville! This 3-bedroom, 2-bath home offers an open floor plan with a warm and inviting fireplace, all nestled in an established neighborhood. Currently tenant occupied on a month-to-month lease, this property presents excellent flexibility for buyers--move in and make it your own, or continue with the long-term tenant for immediate income potential. Spacious layout, comfortable living areas, and endless possibilities make this a great opportunity for homeowners and investors alike. Conveniently located with easy access to local amenities and major routes. Don't miss your chance to own a property with options and value!
Key facts
- 7,601 sq ft lot
- 2 parking spots
- Built 1984
Property features AI
Exterior
- Parking: Driveway with two parking spaces
- Utilities: Public sewer; Water not available
- Home design: Single-story; Very good condition; Slab foundation
- Construction: Brick and frame construction; Shingle roof; Built on slab foundation
- Exterior features: Fence; Concrete patio/porch; City lot; Rectangular lot; Lot dimensions 60 x 126
Interior
- Kitchen: Oven; Range; ENERGY STAR qualified appliances
- Bedrooms: Total rooms: 6
- Bathrooms: 2 full bathrooms
- Heating & cooling: Has heating; Has cooling
- Interior features: Pantry; Vaulted ceilings; Gas fireplace
Neighborhood map
What this means for you Summary
Snapshot
- This is a 3-bed/2.0-bath single-family listed at $142k.
Deal economics
- At list price, monthly cash flow is $176 ($2k/yr) — positive.
- The deal already cash-flows at list — no discount required.
- To meet the 1% rule (rent ≥ 1% of price), the offer needs to be $136k (4.2% below list).
- Recommended offer: $136k (4.2% below list) — sets the bar for 1% rule.
Location & tenants
- Location reads 65/100 on livability (#154 in LA) — a middle-class / working-renter tenant base. Strengths: crime A+, cost of living A+, housing A+; Watch: health & safety C-, schools D, amenities F.
- St. John The Baptist Parish (suburban): math 13% / reading 25% proficiency, ranked #68 of 98 in LA (top 69%) — low school quality limits family demand, transient renter base, plan for 1-2y turnover; 82% free/reduced lunch — lower-income household profile, screen leases tightly.
- Market conditions: 12 active listings in the ZIP; 61 units permitted in St. John the Baptist Parish in 2024 (0 in 5+ unit buildings).
Forward outlook
- In year one you build about $15k of equity ($985 loan paydown + $14k appreciation (10.0% local appreciation)).
- St. John the Baptist County population projected at -20% by 2050 — secular population decline; favor cash flow + early exit over multi-decade hold.
- At projected returns (10.0% appreciation + 3.0% rent growth), your $40k cash investment doubles in ~3 years — after that, you're playing with house money.
- By year 3, paydown + projected appreciation supports a ~$39k cash-out refi (75% LTV) — recoverable capital for the next deal without selling this one.
Negotiation context
- It's been on market 53 days — a 3% lower offer ($138k) is reasonable based on typical stale-listing flexibility.
- 12 sale attempts since 12y ago with the ask held roughly flat each time — persistent listings suggest the price (not the market) is what's stuck; bring a comps-based counter.
- Current owner paid $89k; list at $142k implies a 60% gain — meaningful room to come down on a strong offer.
Risks & watch-outs
- Climate carrying-cost: severe wind risk, 99% chance of damaging wind over 30y; extreme-heat days projected 7→21/yr by 2055 (HVAC capex compounding) — expect insurance premiums to compound above CPI over the hold.
Questions for the listing agent
- It's been on market 53 days. Have you received any prior offers? Is the seller open to a 4% concession, seller financing, or rate buy-down credit?
- Is there a deadline driving the sale (1031 exchange, divorce, estate, relocation)? That informs how much negotiation room exists.
- Schools are D-rated, which usually means shorter tenancies and higher turnover. Who's the typical renter profile here, and what's been the actual vacancy rate?
- What's the average days-on-market for RENTAL listings here right now (not sales)? A rising rental-DOM trend means longer vacancies and softer asking-rent achievability than the comps imply.
- What's the recent tenant-quality profile in this submarket — average credit score on applications, eviction rate, late-payment / NSF rate, and stable-employment percentage? A property-management company in the area should have these aggregated.
- How much new for-sale + rental construction is in the pipeline within 1–3 miles? Heavy new supply typically softens prices + rents 12–24 months out; constrained supply supports both.
Investment metrics
- 1% rule
- 0.96% ✗
- Cap rate
- 7.77%
- Cash-on-cash
- 5.28%
- DSCR
- 1.23
- GRM
- 8.7
CMA / ARV
- ARV (median comp)
- $183,451
- List price
- $142,500
- Delta
- -22.32%
- Verdict
- UNDERPRICED
- Comps
- 17 within 1.0 mi
Show comp detail 3 sales within ~0.75 mi
| Address | Dist | Beds/Ba | Sqft | Sold | Price | $/sf | Match |
|---|---|---|---|---|---|---|---|
| 231 Historic Main St | 0.22mi | 3/2.0 | 2,000 (+14%) | 4mo | $98,000 | $49 | 63 |
| 477 S Church St | 0.62mi | 3/2.0 | 1,823 (+4%) | 10mo | $172,000 | $94 | 56 |
| 500 S Church St | 0.67mi | 4/2.0 (+1) | 1,858 (+6%) | 9mo | $225,000 | $121 | 46 |
Match score weights: distance 35% · size 25% · config 20% · recency 20%. Top-matched comps best support the ARV.
Projected returns pro-forma
10.0% appreciation · 3.0% rent growth · sell at horizon
- IRR
- 28.1%
- Equity multiple
- 3.22×
- Total profit
- $88,759
- Equity at exit
- $128,375
- IRR
- 24.5%
- Equity multiple
- 7.33×
- Total profit
- $252,530
- Equity at exit
- $276,846
Cash invested: $39,900 (down + closing). Projections, not guarantees.
Landlord ↔ Tenant lean methodology
- Overall (STATE)
- 90 Strongly Landlord-Friendly
- State Louisiana
- 90 Strongly Landlord-Friendly · R+12
- County
- — inherits STATE
- City
- — inherits STATE
ZIP-level market 70051
- Home prices YoY
- 21.1%
- Active inventory
- 12
- Price-to-rent
- 8.7×
Monthly cashflow live
- Estimated rent
- $1,365 medium interval (Pro) →
- Mortgage (P&I)
- −$747
- Tax from tax record
- −$96 /mo · $1,153/yr
- Insurance
- −$59
- HOA
- −$0
- Vacancy / Maint / Mgmt
- −$287
- Net cashflow
- $176
Break-even live
UW: 25.0% down · 7.5% · 30yr · 1.5% tax · 5.0% vac · 8.0% maint · 8.0% mgmt
Financing live
Cash to close
- Down payment
- $35,625
- Closing costs
- $4,275
- Reserves months
- —
- Total cash needed
- —
Loan-product check · same deal, 3 products live
Conventional
25% down · 7.5% · 30yr
- Down + closing
- —
- Monthly P&I
- —
- Monthly cashflow
- —
- DSCR
- —
- Eligible?
- —
Personal DTI + credit; lowest rate.
DSCR
20% down · 8.5% · 30yr
- Down + closing
- —
- Monthly P&I
- —
- Monthly cashflow
- —
- DSCR
- —
- Eligible?
- —
No personal income docs; deal must DSCR.
Hard money
10% down · 12.0% · 12mo
- Down + closing
- —
- Monthly P&I
- —
- Monthly cashflow
- —
- DSCR
- —
- Eligible?
- —
Short-term bridge; refi at stabilization.
Listing history 34 events
-
2026-06-19days on market $142,500 Active 53 DOM
-
2026-06-18days on market $142,500 Active 52 DOM
-
2026-06-17days on market $142,500 Active 51 DOM
-
2026-06-16days on market $142,500 Active 50 DOM
-
2026-06-15days on market $142,500 Active 49 DOM
-
2026-06-14days on market $142,500 Active 47 DOM
-
2026-06-13days on market $142,500 Active 46 DOM
-
2026-06-10days on market $142,500 Active 44 DOM
-
2026-06-09days on market $142,500 Active 43 DOM
-
2026-06-08days on market $142,500 Active 42 DOM
-
2026-06-07days on market $142,500 Active 41 DOM
-
2026-06-02days on market $142,500 Active 36 DOM
-
2026-06-01days on market $142,500 Active 35 DOM
-
2026-05-31days on market $142,500 Active 34 DOM
-
2026-05-30days on market $142,500 Active 33 DOM
-
2026-04-27$142,500 Active 651-char remark
Show marketing remark (640 chars)
Welcome to Garyville! This 3-bedroom, 2-bath home offers an open floor plan with a warm and inviting fireplace, all nestled in an established neighborhood. Currently tenant occupied on a month-to-month lease, this property presents excellent flexibility for buyers--move in and make it your own, or continue with the long-term tenant for immediate income potential. Spacious layout, comfortable living areas, and endless possibilities make this a great opportunity for homeowners and investors alike. Conveniently located with easy access to local amenities and major routes. Don't miss your chance to own a property with options and value!
-
2026-04-27$142,500 Active 640-char remark
Show marketing remark (640 chars)
Welcome to Garyville! This 3-bedroom, 2-bath home offers an open floor plan with a warm and inviting fireplace, all nestled in an established neighborhood. Currently tenant occupied on a month-to-month lease, this property presents excellent flexibility for buyers--move in and make it your own, or continue with the long-term tenant for immediate income potential. Spacious layout, comfortable living areas, and endless possibilities make this a great opportunity for homeowners and investors alike. Conveniently located with easy access to local amenities and major routes. Don't miss your chance to own a property with options and value!
-
2025-08-01soldstatus $89,000 Closed
-
2025-05-09status Pending
-
2025-04-04price $99,900
-
2025-04-03price $99,900
-
2025-03-10price $119,900
-
2025-03-06price $119,900
-
2025-02-14status Active
-
2025-02-14status Pending
-
2025-02-07$129,900 Active
-
2025-02-07$129,900 Active
-
2015-01-22$71,900
-
2014-11-19$69,900
-
2014-11-19$69,900
-
2014-11-04$68,000
-
2014-11-04$68,000
-
2014-08-12$92,800
-
2014-08-12$92,800
ⓘ Source: listings_history table (triggers on properties + properties_extension) + one-shot
backfill from property_details.listing_events for pre-trigger history.
Tax reassessment forecast LA · Resets to sale price
- Current annual tax
- $1,153 · $96/mo
- Projected year-2 tax
- $1,153 · $96/mo
- Expected delta
- $0/yr ($0/mo · 0.0%)
ⓘ Screening estimate from a state-policy table — verify with the county assessor before closing.
Climate risk First Street
- Flood 1/10 Low FEMA zone X (shaded) · 0% chance over 30 yrs
- Wildfire 1/10 Low
- Heat 9/10 Extreme 7 d/yr ≥108°F today · 21 d/yr by 30 yrs out
- Wind 9/10 Extreme 99% chance of damaging wind over 30 yrs
- Air quality 2/10 Low 0 unhealthy d/yr today · 1 by 30 yrs out
Nearby sold comps map
Loading sold comps map…
Walkable amenities ~0.75 mi
Loading nearby amenities…
Taxation est. · year 1
- Rental income
- $16,378
- − Mortgage interest
- −$7,982
- − Property taxes
- −$1,153
- − Insurance
- −$712
- − Repairs & maintenance
- −$1,310
- − Management
- −$1,310
- − Depreciation
- −$4,145
- Taxable loss
- −$235
- Est. tax savings @ 24.0%
- +$56
- After-tax cash flow
- $2,163/yr
For passive investors: Depreciation is non-cash, so a rental often shows a tax loss while cash-flowing — sheltering income. Rental losses are passive: they offset passive income freely, and up to $25,000/yr can offset ordinary (W-2) income if you actively participate and your MAGI is under $100k (phasing out to $0 by $150k); unused losses carry forward. On sale, claimed depreciation is recaptured at up to 25%, and gains may owe capital-gains tax (a 1031 exchange can defer both). Figures are a year-1 estimate at your 24.0% rate — not tax advice; consult a CPA.
Schools (NCES district)
- District
- St. John The Baptist Parish
- NCES district ID
- 2201530
- Math proficiency
- 13% ▼ -42.00%
- Reading proficiency
- 25% ▼ -39.00%
- Median HH income
- $50,280
- Composite
- 17.07/100
- National rank
- #9120
- State rank
- #68 of 98 in LA
Livability — Garyville
- Score
- 65/100
- State rank
- #154
- US rank
- #13042
Category grades
Schools grade is shown separately in the Schools card above.
Census & demographics
- Census place
- Garyville, LA
- City population
- 2,045
- Population (ZIP)
- 1,913
Population outlook (St. John the Baptist County) Hauer SSP2
- Today (2025)
- 40,972 people
- By 2030
- 39,295 · -4.1%
- By 2040
- 35,902 · -12.4%
- By 2050
- 32,988 · -19.5%
- By 2075
- 28,661 · -30.0%
- By 2100
- 26,456 · -35.4%
Race, ethnicity, and origin ACS 2023
- Neighborhood character
- Majority Black (55%)
- Race & ethnicity
- Black 55% White 41% Two or more races 4%
- Common ancestry
- Lithuanian 6% Slovak 1%
- Languages at home
- 99% English-only · French/Haitian/Cajun 1%
Political lean MEDSL · St. John the Baptist
- 2024 margin
- Strong D (+29.1) · D 64.0% · R 34.8% · Other 1.2%
- 2008→2024 swing
- +12.9pp toward D · 2008: 16.2pp · 2024: 29.1pp
- All cycles
- 2024: D+29.1 2020: D+28.2 2016: D+24.5 2012: D+26.3 2008: D+16.2
Not yet ingested
- Civics
- —
Market trends
- HPI YoY
- ▲ 33.23%
- Current HPI
- 190.43
- Rent YoY
- —
- Metro
- —
- State GDP YoY
- ▲ 3.29%
- F500 in state
- 10
Industry mix (Fortune 500 HQ in LA)
| Industry | F500 HQs | Revenue |
|---|---|---|
| Telecommunications | 2 | $23B |
|
||
| Utilities | 1 | $12B |
|
||
| Wholesale / Distribution | 1 | $5B |
|
||
| Advertising | 1 | $2B |
|
||
Price history
+53.6% since first listed19 events — show timeline
- 2026-04-27 Listed $142,500 AcadianaMLS
- 2026-04-27 Listed $142,500 GSREIN
- 2025-08-01 Sold (MLS) $89,000 GSREIN
- 2025-05-09 Pending — GSREIN
- 2025-04-04 Price Changed $99,900 AcadianaMLS
- 2025-04-03 Price Changed $99,900 GSREIN
- 2025-03-10 Price Changed $119,900 AcadianaMLS
- 2025-03-06 Price Changed $119,900 GSREIN
- 2025-02-14 Relisted — GSREIN
- 2025-02-14 Pending — GSREIN
- 2025-02-07 Listed $129,900 GSREIN
- 2025-02-07 Listed $129,900 AcadianaMLS
- 2015-01-22 Listed $71,900 GSREIN
- 2014-11-19 Listed $69,900 AcadianaMLS
- 2014-11-19 Listed $69,900 GBRMLS
- 2014-11-04 Listed $68,000 GSREIN
- 2014-11-04 Listed $68,000 AcadianaMLS
- 2014-08-12 Listed $92,800 GSREIN
- 2014-08-12 Listed $92,800 AcadianaMLS
Property tax history
+0.4%/yrLatest (2025): $1,153 · +0.1% YoY. Source: county tax records.
Cash-flow waterfall
monthlySold comps — $/sqft
last 12 mo · ≤1 miLoading sold comps…