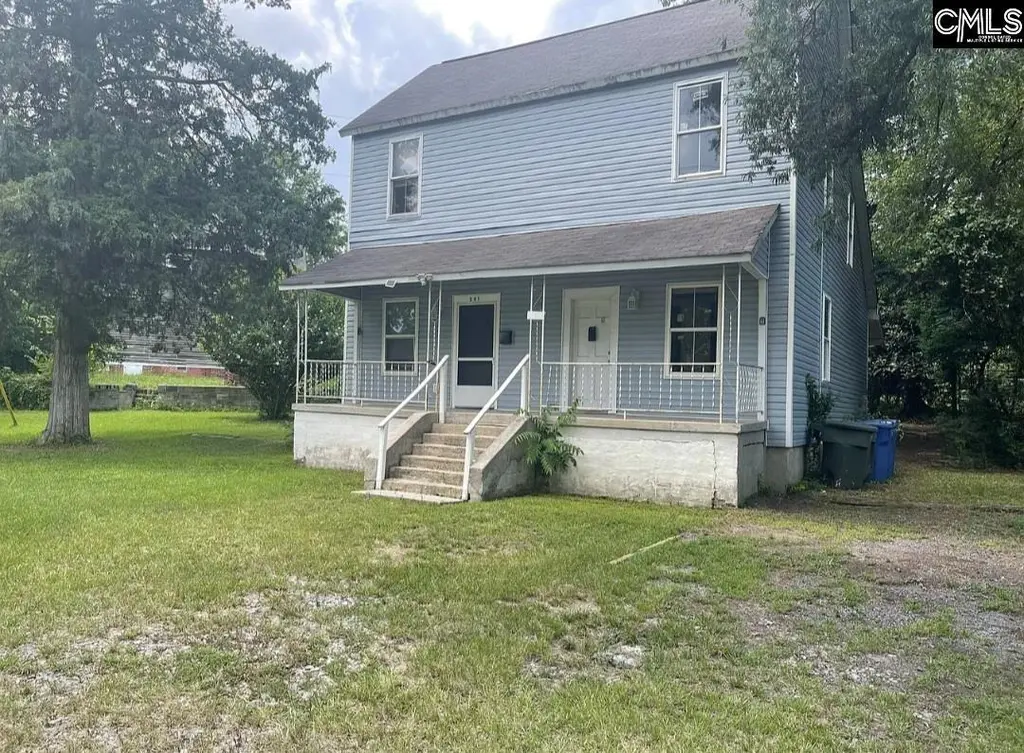
 Duplex
201-203 Tryon St · Columbia, SC
Flood risk 1/10 · Minimal
- FEMA flood zone
- X
- Chance of flooding over 30 yrs
- 0.0%
- Est. flood insurance / yr
- $435 – $905
Fire risk 2/10 · Minimal
- Est. fire insurance / yr
- $783 – $1,453
Heat risk 7/10 · Major
- Hot days now (above threshold)
- 7 days/yr
- Hot days in 30 yrs
- 16 days/yr
Wind risk No data
- Chance of severe wind over 30 yrs
- —
Air-quality risk No data
- Unhealthy air days now
- —
- Unhealthy air days in 30 yrs
- —
Risk factors via First Street. Map © Google.
Why this score? — see what drove the B- grade
The composite is a weighted blend of 9 inputs, each scored 0–100. Each bar is that input's sub-score; the figure is the points it added to the 100-point composite (weight × sub-score).
- Cash flow +30.0/30.0
- 1% rule +10.0/10.0
- DSCR +10.0/10.0
- ARV discount +7.5/15.0
- Livability +3.9/5.0
- Rent growth +3.3/5.0
- Schools +2.6/10.0
- Condition / age +2.5/5.0
- Appreciation +0.0/10.0
$199,000
🖨 Deal sheet 📄 Offer letter ✓ Due diligence
Multi-family units
County records classify this as Multi-Family (2-4 Unit). Listing-text estimate: 2 units. confirmed
Listing remarks
Excellent Investment Opportunity in Granby Hill – Prime USC Rental Market! Rare opportunity to own a duplex in the heart of one of Columbia’s most desirable neighborhoods for USC student housing. Located in the historic Granby Hill area (Olympia neighborhood), this property is just a short walk to Founders Park (Gamecocks Baseball Stadium), the Mills Village Riverlink, and the Three Rivers Greenway. It’s also less than a mile to Williams-Brice Stadium – ideal for attracting student renters and Gamecock fans alike. This classic duplex offers a total of 1920 sq. ft. , with 2 bedrooms and 1 bathroom on one side and one side has one large room upstairs that has potential
Key facts
- 9,583 sq ft lot
- 4 parking spots
- Built 1940
Tags
Property features AI
Finance
- Other: Pest control paid by tenant
- Financial info: Total of 2 units; Unit 1 rent: $950
Exterior
- Parking: Off-street parking for 4 vehicles
- Utilities: Public water; Public sewer (sewer costs paid by owner); Tenant pays gas and electricity; Tenant pays trash and cable
- Home design: 2-story building; Crawlspace foundation
- Construction: Crawlspace foundation
- Exterior features: Vinyl exterior; Tenant responsible for lawn maintenance; Paved road access
Interior
- Bedrooms: Unit 1: 2 bedrooms; Unit 2: 1 bedroom
- Bathrooms: Unit 1: 1 full bath; Unit 2: 1 full bath; Total full baths (both units): 2
- Heating & cooling: Central heating; Central cooling; Heating costs paid by owner
- Interior features: Two-unit duplex
Neighborhood map
What this means for you Summary
Snapshot
- This is a 2 × 3-bed/2.0-bath units multifamily listed at $199k.
Deal economics
- At list price, monthly cash flow is $2k ($18k/yr) — positive. Per door: $750/mo.
- The deal already cash-flows at list — no discount required.
- Meets the 1% rule at list price ($4k rent vs $199k).
- Cap rate 15.3% vs local median 5.0% in Columbia — top-decile yield for the area; either an underpriced asset or a hidden risk that comps aren't pricing in. Stress-test before assuming the spread holds.
Location & tenants
- Location reads 78/100 on livability (#18 in SC, #2,436 nationally) — a middle-class / working-renter tenant base. Strengths: amenities A+, commute A+, cost of living A+; Watch: employment D, crime F.
- Richland 01 (urban): math 26% / reading 36% proficiency, ranked #54 of 80 in SC (top 68%) — families likely to look elsewhere, expect single-tenant / working-renter base with shorter leases; 64% free/reduced lunch — lower-income household profile, screen leases tightly.
- Zoned schools: A. C. Moore Elementary (math 52% / reading 47%, grade D, #168 of 597 statewide, top 31%, 204 students, 100% FRL); Dreher High (math 47% / reading 92%, grade B, #60 of 196 statewide, top 32%, 1,150 students, 100% FRL) — zoned schools average 100% FRL vs 64% district-wide (36 pts higher); higher-poverty schools than district average — tighter screening recommended.
- Zoned-school proficiency averages 60% at this address vs 31% district-wide (+28 pts) — the actual schools serving this property are materially stronger than the Richland 01 average implies; a family-tenant draw the district grade alone would hide.
- Market conditions: Rents rising (+3.2%/yr); 114 active listings in the ZIP; 12 comparable units currently listed for rent nearby; rentals at typical pace (median 24d on market — plan ~3-4 weeks tenant-placement turnaround); lower-income renter base — watch delinquency; 3,472 units permitted in Richland County in 2024 (1,096 in 5+ unit buildings).
- At $3,572/mo this rent would consume 133% of the median local household income ($32k/yr) (locally 3456% of renters already pay >50% of income on rent) — very limited rent-growth headroom before tenants either downsize or default.
Forward outlook
- Local home prices are declining (-3.0%/yr); year-one equity from $1k of loan paydown is wiped out by about $6k of value loss. Plan a longer hold.
- Richland County population projected at +30% by 2050 — long-run rental-demand tailwind backs the buy-and-hold thesis.
- At projected returns (-3.0% appreciation + 3.2% rent growth), your $56k cash investment doubles in ~4 years — after that, you're playing with house money.
Negotiation context
- Only 3 days on market — expect competitive offers; lowballing is unlikely to land.
- 2 sale attempts with the ask held roughly flat each time — persistent listings suggest the price (not the market) is what's stuck; bring a comps-based counter.
Risks & watch-outs
- Watch-outs: built in 1940 — expect roof / HVAC / electrical / plumbing capex.
- Climate carrying-cost: extreme-heat days projected 7→16/yr by 2055 (HVAC capex compounding) — expect insurance premiums to compound above CPI over the hold.
Questions for the listing agent
- Can we see the unit-by-unit rent roll, current vacancy, and any below-market leases? What's the average tenancy length?
- What capital expenditures (roof, boiler, parking lot, exteriors) have been made in the last 5 years, and what's planned in the next 2?
- Built in 1940 — when were the roof, HVAC, electrical panel, plumbing, and water heater last replaced?
- Is there a deadline driving the sale (1031 exchange, divorce, estate, relocation)? That informs how much negotiation room exists.
- Schools are D-rated, which usually means shorter tenancies and higher turnover. Who's the typical renter profile here, and what's been the actual vacancy rate?
- Crime grade is F in this area — have there been break-ins, vandalism, or insurance claims at this property in the last 3 years? What carrier currently insures it and at what premium?
- What's the average days-on-market for RENTAL listings here right now (not sales)? A rising rental-DOM trend means longer vacancies and softer asking-rent achievability than the comps imply.
- What's the recent tenant-quality profile in this submarket — average credit score on applications, eviction rate, late-payment / NSF rate, and stable-employment percentage? A property-management company in the area should have these aggregated.
- How much new apartment / multifamily construction is in the pipeline within 1–3 miles? Heavy new supply (>2% of stock underway) typically softens rents 12–24 months out; light construction supports rent growth.
Investment metrics
- 1% rule
- 1.79% ✓
- Cap rate
- 15.34%
- Cash-on-cash
- 32.32%
- DSCR
- 2.44
- GRM
- 4.6
CMA / ARV
No comps found within radius.
Projected returns pro-forma
-3.0% appreciation · 3.18% rent growth · sell at horizon
- IRR
- 27.6%
- Equity multiple
- 2.15×
- Total profit
- $63,999
- Equity at exit
- $29,672
- IRR
- 35.2%
- Equity multiple
- 4.26×
- Total profit
- $181,552
- Equity at exit
- $17,206
Cash invested: $55,720 (down + closing). Projections, not guarantees.
Landlord ↔ Tenant lean methodology
- Overall (STATE)
- 90 Strongly Landlord-Friendly
- State South Carolina
- 90 Strongly Landlord-Friendly · R+6
- County
- — inherits STATE
- City
- — inherits STATE
ZIP-level market 29201
- Rents YoY
- 3.2%
- Active inventory
- 114
- Price-to-rent
- 9.3×
Monthly cashflow live
- Estimated rent
- $3,572 high interval (Pro) →
- Mortgage (P&I)
- −$1,044
- Tax from tax record
- −$195 /mo · $2,337/yr
- Insurance
- −$83
- HOA
- −$0
- Vacancy / Maint / Mgmt
- −$750
- Net cashflow
- $1,501
Break-even live
2-unit breakdown (identical units grouped — click to expand)
| Units | Beds | Baths | Est. rent |
|---|---|---|---|
| 2× units | 3 | 2 | $3,572 |
| #1 | 3 | 2 | $1,786 |
| #2 | 3 | 2 | $1,786 |
| Total (2 units) | $3,572 | ||
UW: 25.0% down · 7.5% · 30yr · 1.5% tax · 5.0% vac · 8.0% maint · 8.0% mgmt
Financing live
Cash to close
- Down payment
- $49,750
- Closing costs
- $5,970
- Reserves months
- —
- Total cash needed
- —
Loan-product check · same deal, 3 products live
Conventional
25% down · 7.5% · 30yr
- Down + closing
- —
- Monthly P&I
- —
- Monthly cashflow
- —
- DSCR
- —
- Eligible?
- —
Personal DTI + credit; lowest rate.
DSCR
20% down · 8.5% · 30yr
- Down + closing
- —
- Monthly P&I
- —
- Monthly cashflow
- —
- DSCR
- —
- Eligible?
- —
No personal income docs; deal must DSCR.
Hard money
10% down · 12.0% · 12mo
- Down + closing
- —
- Monthly P&I
- —
- Monthly cashflow
- —
- DSCR
- —
- Eligible?
- —
Short-term bridge; refi at stabilization.
Rent comps 12 comps
| Address | Beds | Baths | Sqft | Rent | $/sqft | DOM | Units | Dist |
|---|---|---|---|---|---|---|---|---|
| 126 Lincoln St Unit 126 Columbia, SC | 3.0 | 2.5 | 1750 | $2,800 | $1.60 | 14d | 1 | 0.48mi |
| 521 Georgia St Columbia, SC | 4.0 | 2.0 | 2160 | $3,500 | $1.62 | 19d | 1 | 0.50mi |
| 919 Catawba St Columbia, SC | 3.0 | 3.0 | 1334 | $1,100 | $0.82 | 23d | 1 | 0.54mi |
| 1110 Slann Dr Cayce, SC | 5.0 | 3.0 | 1904 | $3,749 | $1.97 | 23d | 1 | 0.64mi |
| 840 Ohio St Unit 840 Columbia, SC | 3.0 | 2.0 | 1235 | $2,350 | $1.90 | 2d | 1 | 0.75mi |
| 1120 Virginia St Unit 112014-A Columbia, SC | 4.0 | 4.5 | 1900 | $4,280 | $2.25 | 23d | 1 | 0.79mi |
| 611 Lady St Unit b Columbia, SC | 3.0 | 2.5 | 1600 | $2,200 | $1.38 | 23d | 1 | 1.12mi |
| 123 S Pickens St Columbia, SC | 3.0 | 2.0 | 2000 | $2,900 | $1.45 | 23d | 1 | 1.16mi |
| 147 S Pickens St Unit 147 Columbia, SC | 3.0 | 1.0 | 1302 | $1,950 | $1.50 | 23d | 1 | 1.21mi |
| 609 Center St West Columbia, SC | 4.0 | 2.0 | 1600 | $2,800 | $1.75 | 23d | 1 | 1.32mi |
| 127 Rosewood Hills Dr Columbia, SC | 3.0 | 2.5 | 1475 | $2,900 | $1.97 | 14d | 1 | 1.38mi |
| 500 S Bull St Columbia, SC | 4.0 | 2.5 | 1677 | $3,400 | $2.03 | 23d | 1 | 1.40mi |
Listing history 3 events
-
2026-05-27$199,000 Active
-
2025-08-11historical $1,100
-
2025-07-11$1,100
ⓘ Source: listings_history table (triggers on properties + properties_extension) + one-shot
backfill from property_details.listing_events for pre-trigger history.
Tax reassessment forecast SC · Resets to sale price
- Current annual tax
- $2,337 · $195/mo
- Projected year-2 tax
- $2,337 · $195/mo
- Expected delta
- $0/yr ($0/mo · 0.0%)
ⓘ Screening estimate from a state-policy table — verify with the county assessor before closing.
Climate risk First Street
- Flood 1/10 Low FEMA zone X · 0% chance over 30 yrs
- Wildfire 2/10 Low
- Heat 7/10 Severe
Nearby sold comps map
Loading sold comps map…
Walkable amenities ~0.75 mi
Loading nearby amenities…
Taxation est. · year 1
- Rental income
- $42,864
- − Mortgage interest
- −$11,147
- − Property taxes
- −$2,337
- − Insurance
- −$995
- − Repairs & maintenance
- −$3,429
- − Management
- −$3,429
- − Depreciation
- −$5,789
- Taxable income
- $15,738
- Est. tax owed @ 24.0%
- −$3,777
- After-tax cash flow
- $14,231/yr
For passive investors: Depreciation is non-cash, so a rental often shows a tax loss while cash-flowing — sheltering income. Rental losses are passive: they offset passive income freely, and up to $25,000/yr can offset ordinary (W-2) income if you actively participate and your MAGI is under $100k (phasing out to $0 by $150k); unused losses carry forward. On sale, claimed depreciation is recaptured at up to 25%, and gains may owe capital-gains tax (a 1031 exchange can defer both). Figures are a year-1 estimate at your 24.0% rate — not tax advice; consult a CPA.
Schools (NCES district)
- District
- Richland 01
- NCES district ID
- 4503360
- Math proficiency
- 26% ▼ -7.00%
- Reading proficiency
- 36% ▼ -5.00%
- Median HH income
- $38,931
- Composite
- 25.94/100
- National rank
- #7335
- State rank
- #54 of 80 in SC
Livability — Columbia
- Score
- 78/100
- State rank
- #18
- US rank
- #2436
Category grades
Schools grade is shown separately in the Schools card above.
Census & demographics
- Census place
- Columbia, SC
- County
- Richland County · 389,530 people
- City population
- 335,994
- Metro
- Columbia, SC
- Population (ZIP)
- 24,605
- Household income
- $32,297
- Rent vs Own
- Severe rent burden
- 3456.0
Population outlook (Richland County) Hauer SSP2
- Today (2025)
- 459,667 people
- By 2030
- 487,524 · +6.1%
- By 2040
- 542,035 · +17.9%
- By 2050
- 595,371 · +29.5%
- By 2075
- 732,998 · +59.5%
- By 2100
- 820,415 · +78.5%
Race, ethnicity, and origin ACS 2023
- Neighborhood character
- Majority White (64%)
- Race & ethnicity
- White 64% Black 24% Hispanic / Latino 4% Asian 4% Two or more races 4%
- Common ancestry
- Italian 2% Lithuanian 2% Serbian 2%
- Foreign-born
- 7% · China, Canada
- Languages at home
- 90% English-only · Spanish 3% Chinese 2% Other Indo-European 2%
Political lean MEDSL · Richland
- 2024 margin
- Solid D (+34.6) · D 66.4% · R 31.8% · Other 1.8%
- 2008→2024 swing
- +5.7pp toward D · 2008: 28.9pp · 2024: 34.6pp
- All cycles
- 2024: D+34.6 2020: D+38.3 2016: D+32.9 2012: D+33.3 2008: D+28.9
Not yet ingested
- Civics
- —
Market trends
- HPI YoY
- ▼ -142.00%
- Current HPI
- 229.8442
- Rent YoY
- ▲ 3.18%
- Metro
- Columbia, SC
- State GDP YoY
- ▲ 4.51%
- F500 in state
- 2
Industry mix (Fortune 500 HQ in SC)
| Industry | F500 HQs | Revenue |
|---|---|---|
| Packaging | 1 | $7B |
|
||
Price history
+17990.9% since first listed3 events — show timeline
- 2026-05-27 Listed $199,000 Consolidated MLS
- 2025-08-11 Rental Removed $1,100 TURBOTENANT
- 2025-07-11 Listed for Rent $1,100 TURBOTENANT
Property tax history
+2.2%/yrLatest (2025): $2,337 · +2.1% YoY. Source: county tax records.
Cash-flow waterfall
monthlySold comps — $/sqft
last 12 mo · ≤1 miLoading sold comps…