 🌊 Lakefront
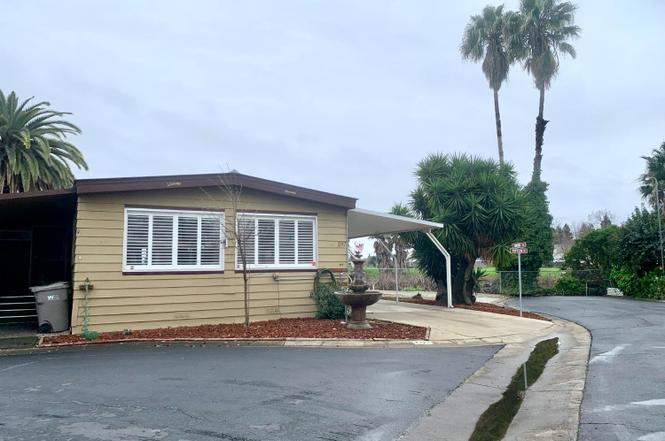
3901 Lake Rd #197 · West Sacramento, CA
Flood risk No data
- FEMA flood zone
- —
- Chance of flooding over 30 yrs
- —
- Est. flood insurance / yr
- —
Fire risk No data
- Est. fire insurance / yr
- —
Heat risk No data
- Hot days now (above threshold)
- —
- Hot days in 30 yrs
- —
Wind risk No data
- Chance of severe wind over 30 yrs
- —
Air-quality risk No data
- Unhealthy air days now
- —
- Unhealthy air days in 30 yrs
- —
Risk factors via First Street. Map © Google.
Why this score? — see what drove the B grade
The composite is a weighted blend of 9 inputs, each scored 0–100. Each bar is that input's sub-score; the figure is the points it added to the 100-point composite (weight × sub-score).
- Cash flow +30.0/30.0
- 1% rule +10.0/10.0
- DSCR +10.0/10.0
- ARV discount +7.5/15.0
- Schools +3.8/10.0
- Livability +3.7/5.0
- Rent growth +3.0/5.0
- Condition / age +2.5/5.0
- Appreciation +0.0/10.0
$139,000
🖨 Deal sheet 📄 Offer letter ✓ Due diligence
Listing remarks
Lake front home on a corner lot! Two separate parking spots! Dock on the lake! Each bedroom has a view of the lake while lying in your bed. Porch converted into an additional room off living area. New gas range, master bath has jetted tub with bidet, plantation shutters in living room. Newer HVAC, water heater, newer range, RECENTLY RELEVELED. Covered sliding security screen door, large deck on carport side which could leave room for your refrigerator. Washer and dryer included! 2 bedrooms and 2.5 baths.
Key facts
- 3 parking spots
- Built 1970
- Listed 81 days
Property features AI
Finance
- Financial info: Monthly land lease amount: $775; Land lease not owned (tenant pays land lease)
- HOA & community: Not part of an association; Located in a senior community; Community of 239 units
Exterior
- Parking: Covered parking; Guest parking available
- Utilities: Individual electric meter; Individual gas meter; 220 volts in kitchen; Public water; Public sewer
- Home design: Manufactured home in park; Double wide; Built in 1970; Updated/remodeled
- Construction: Shingle roof; Wood and other skirting; Manufacturer: Viking
- Exterior features: Carport awning; Porch awning; Landscaped front and back with automatic sprinklers; Additional storage
Interior
- Kitchen: Free standing gas range and oven; Dishwasher; Disposal; Breakfast area; Pantry cabinet and pantry closet; Laminate counters; Dining bar and space in kitchen
- Bedrooms: 2 bedrooms (including master bedroom)
- Flooring: Carpet; Laminate; Linoleum
- Bathrooms: 2 full bathrooms; Jetted tub; Tub with shower over
- Heating & cooling: Central heating; Central cooling
- Interior features: Cathedral/vaulted living room ceiling; Covered deck; Dual pane partial windows; Storage area; Updated/remodeled condition; Bonus room, den, and formal living and dining areas
- Laundry & utility: Washer and dryer included (inside area)
Neighborhood map
What this means for you Summary
Snapshot
- This is a 2-bed/2.0-bath manufactured listed at $139k.
Deal economics
- At list price, monthly cash flow is $780 ($9k/yr) — positive.
- The deal already cash-flows at list — no discount required.
- Meets the 1% rule at list price ($2k rent vs $139k).
- Recommended offer: $131k (6.0% below list) — sets the bar for market timing.
Location & tenants
- Location reads 73/100 on livability (#164 in CA) — a middle-class / working-renter tenant base. Strengths: housing A+, commute A, employment A-; Watch: cost of living F.
- Washington Unified (suburban): math 30% / reading 57% proficiency, ranked #197 of 517 in CA (top 38%) — families likely to look elsewhere, expect single-tenant / working-renter base with shorter leases.
- Market conditions: Rents rising (+1.9%/yr); 151 active listings in the ZIP; solid renter incomes; 721 units permitted in Yolo County in 2024 (260 in 5+ unit buildings).
Forward outlook
- Local home prices are declining (-3.0%/yr); year-one equity from $961 of loan paydown is wiped out by about $4k of value loss. Plan a longer hold.
- Yolo County population projected at +31% by 2050 — long-run rental-demand tailwind backs the buy-and-hold thesis.
- At projected returns (-3.0% appreciation + 1.9% rent growth), your $39k cash investment doubles in ~6 years — after that, you're playing with house money.
Negotiation context
- It's been on market 81 days — a 6% lower offer ($131k) is reasonable based on typical stale-listing flexibility.
Questions for the listing agent
- It's been on market 81 days. Have you received any prior offers? Is the seller open to a 6% concession, seller financing, or rate buy-down credit?
- Built in 1970 — when were the roof, HVAC, electrical panel, plumbing, and water heater last replaced?
- Why hasn't it sold? Are there any deal-killer items the seller is aware of (foundation, flood, title, zoning, code violations)?
- Is there a deadline driving the sale (1031 exchange, divorce, estate, relocation)? That informs how much negotiation room exists.
- This sits on a lake — are riparian / water-frontage rights deeded with the parcel? Any dock permits, shoreline easements, or HOA water-use restrictions?
- What's the documented flood / surge / shoreline-erosion history here (FEMA AND non-FEMA — e.g., storm surge, creek backup, septic-field saturation)?
- Any water-quality or seasonal algae-bloom issues that affect tenant satisfaction or short-term-rental demand?
- What's the average days-on-market for RENTAL listings here right now (not sales)? A rising rental-DOM trend means longer vacancies and softer asking-rent achievability than the comps imply.
- What's the recent tenant-quality profile in this submarket — average credit score on applications, eviction rate, late-payment / NSF rate, and stable-employment percentage? A property-management company in the area should have these aggregated.
- How much new for-sale + rental construction is in the pipeline within 1–3 miles? Heavy new supply typically softens prices + rents 12–24 months out; constrained supply supports both.
Investment metrics
- 1% rule
- 1.59% ✓
- Cap rate
- 13.03%
- Cash-on-cash
- 24.05%
- DSCR
- 2.07
- GRM
- 5.3
CMA / ARV
No comps found within radius.
Projected returns pro-forma
-3.0% appreciation · 1.87% rent growth · sell at horizon
- IRR
- 16.0%
- Equity multiple
- 1.64×
- Total profit
- $24,720
- Equity at exit
- $20,725
- IRR
- 23.8%
- Equity multiple
- 2.95×
- Total profit
- $75,706
- Equity at exit
- $12,018
Cash invested: $38,920 (down + closing). Projections, not guarantees.
Landlord ↔ Tenant lean methodology
- Overall (STATE)
- 18 Strongly Tenant-Friendly
- State California
- 18 Strongly Tenant-Friendly · D+13
- County
- — inherits STATE
- City
- — inherits STATE
ZIP-level market 95691
- Home prices YoY
- -35.0%
- Rents YoY
- 1.9%
- Active inventory
- 151
- Price-to-rent
- 5.3×
Monthly cashflow live
- Estimated rent
- $2,203 medium interval (Pro) →
- Mortgage (P&I)
- −$729
- Tax est. 1.5%
- −$174 /mo · $2,085/yr
- Insurance
- −$58
- HOA
- −$0
- Vacancy / Maint / Mgmt
- −$463
- Net cashflow
- $780
Break-even live
UW: 25.0% down · 7.5% · 30yr · 1.5% tax · 5.0% vac · 8.0% maint · 8.0% mgmt
Financing live
Cash to close
- Down payment
- $34,750
- Closing costs
- $4,170
- Reserves months
- —
- Total cash needed
- —
Loan-product check · same deal, 3 products live
Conventional
25% down · 7.5% · 30yr
- Down + closing
- —
- Monthly P&I
- —
- Monthly cashflow
- —
- DSCR
- —
- Eligible?
- —
Personal DTI + credit; lowest rate.
DSCR
20% down · 8.5% · 30yr
- Down + closing
- —
- Monthly P&I
- —
- Monthly cashflow
- —
- DSCR
- —
- Eligible?
- —
No personal income docs; deal must DSCR.
Hard money
10% down · 12.0% · 12mo
- Down + closing
- —
- Monthly P&I
- —
- Monthly cashflow
- —
- DSCR
- —
- Eligible?
- —
Short-term bridge; refi at stabilization.
Listing history 2 events
-
2026-05-31remarks 510-char remark
-
2026-05-31$139,000 Pending 81 DOM
ⓘ Source: listings_history table (triggers on properties + properties_extension) + one-shot
backfill from property_details.listing_events for pre-trigger history.
Nearby sold comps map
Loading sold comps map…
Walkable amenities ~0.75 mi
Loading nearby amenities…
Taxation est. · year 1
- Rental income
- $26,442
- − Mortgage interest
- −$7,786
- − Property taxes
- −$2,085
- − Insurance
- −$695
- − Repairs & maintenance
- −$2,115
- − Management
- −$2,115
- − Depreciation
- −$4,044
- Taxable income
- $7,601
- Est. tax owed @ 24.0%
- −$1,824
- After-tax cash flow
- $7,538/yr
For passive investors: Depreciation is non-cash, so a rental often shows a tax loss while cash-flowing — sheltering income. Rental losses are passive: they offset passive income freely, and up to $25,000/yr can offset ordinary (W-2) income if you actively participate and your MAGI is under $100k (phasing out to $0 by $150k); unused losses carry forward. On sale, claimed depreciation is recaptured at up to 25%, and gains may owe capital-gains tax (a 1031 exchange can defer both). Figures are a year-1 estimate at your 24.0% rate — not tax advice; consult a CPA.
Schools (NCES district)
- District
- Washington Unified
- NCES district ID
- 0641580
- Math proficiency
- 30% ▼ -2.00%
- Reading proficiency
- 57% ▲ 12.00%
- Median HH income
- $55,207
- Composite
- 37.79/100
- National rank
- #4339
- State rank
- #197 of 517 in CA
Livability — West Sacramento
- Score
- 73/100
- State rank
- #164
- US rank
- #5389
Category grades
Schools grade is shown separately in the Schools card above.
Census & demographics
- Census place
- West Sacramento, CA
- County
- Yolo County · 212,115 people
- City population
- 55,039
- Metro
- Sacramento-Roseville-Folsom, CA
- Population (ZIP)
- 40,143
- Household income
- $104,750
- Rent vs Own
- Severe rent burden
- 1109.0
Population outlook (Yolo County) Hauer SSP2
- Today (2025)
- 242,183 people
- By 2030
- 257,662 · +6.4%
- By 2040
- 288,050 · +18.9%
- By 2050
- 318,202 · +31.4%
- By 2075
- 392,736 · +62.2%
- By 2100
- 438,150 · +80.9%
Race, ethnicity, and origin ACS 2023
- Neighborhood character
- Diverse neighborhood (Simpson 0.69)
- Race & ethnicity
- White 45% Hispanic / Latino 29% Two or more races 17% Asian 14% Black 3% Native American 1%
- Hispanic origin (detail)
- Mexican 24%
- Common ancestry
- Italian 4% Scotch-Irish 3% Lithuanian 2%
- Foreign-born
- 19% · Canada, China, Vietnam
- Languages at home
- 69% English-only · Spanish 15% Other Indo-European 6% Russian/Polish/Slavic 3%
Political lean MEDSL · Yolo
- 2024 margin
- Solid D (+36.2) · D 66.3% · R 30.1% · Other 3.6%
- 2008→2024 swing
- 0.0pp no change · 2008: 36.2pp · 2024: 36.2pp
- All cycles
- 2024: D+36.2 2020: D+41.4 2016: D+42.0 2012: D+33.2 2008: D+36.2
Not yet ingested
- Civics
- —
Market trends
- HPI YoY
- ▼ -170.47%
- Current HPI
- 316.9399
- Rent YoY
- ▲ 1.87%
- Metro
- Sacramento-Roseville-Folsom, CA
- State GDP YoY
- ▲ 3.21%
- F500 in state
- 116
Industry mix (Fortune 500 HQ in CA)
| Industry | F500 HQs | Revenue |
|---|---|---|
| Technology | 27 | $1,492B |
|
||
| Financial Services | 3 | $174B |
|
||
| Retail | 3 | $44B |
|
||
| Insurance | 3 | $26B |
|
||
| Media / Entertainment | 2 | $115B |
|
||
| Pharmaceuticals / Biotech | 2 | $62B |
|
||
Cash-flow waterfall
monthlySold comps — $/sqft
last 12 mo · ≤1 miLoading sold comps…