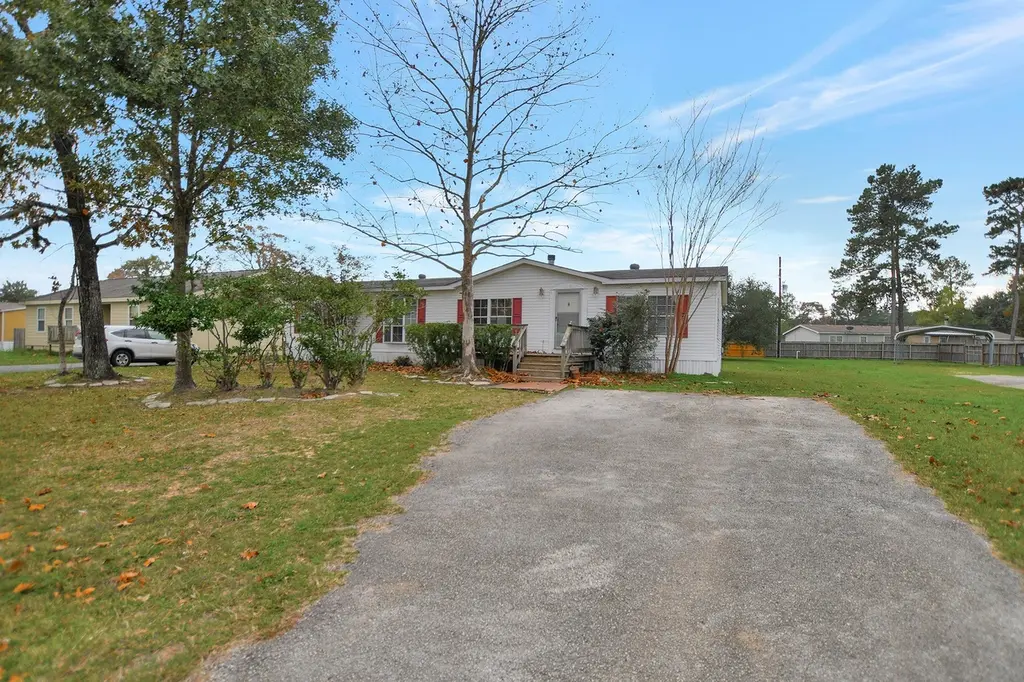
16407 Timberline Trl · Stagecoach, TX
Flood risk 1/10 · Minimal
- FEMA flood zone
- X (unshaded)
- Chance of flooding over 30 yrs
- 0.0%
- Est. flood insurance / yr
- $507 – $1,088
Fire risk 3/10 · Minor
- Est. fire insurance / yr
- $1,222 – $2,270
Heat risk 9/10 · Severe
- Hot days now (above 111°F)
- 7 days/yr
- Hot days in 30 yrs
- 24 days/yr
Wind risk 8/10 · Major
- Chance of severe wind over 30 yrs
- 99.0%
Air-quality risk 2/10 · Minimal
- Unhealthy air days now
- 2 days/yr
- Unhealthy air days in 30 yrs
- 2 days/yr
Risk factors via First Street. Map © Google.
Why this score? — see what drove the C grade
The composite is a weighted blend of 9 inputs, each scored 0–100. Each bar is that input's sub-score; the figure is the points it added to the 100-point composite (weight × sub-score).
- Cash flow +23.4/30.0
- ARV discount +10.9/15.0
- DSCR +7.5/10.0
- 1% rule +5.7/10.0
- Schools +3.9/10.0
- Livability +3.1/5.0
- Rent growth +2.5/5.0
- Condition / age +2.5/5.0
- Appreciation +0.0/10.0
$185,000
🖨 Deal sheet 📄 Offer letter ✓ Due diligence
Listing remarks
Large cul-de-sac lot. This spacious 3-bedroom, 2-bath home offers approximately 1,800 sq. ft. of comfortable living space on a generous 0.37-acre lot in Timberloch Estates. The open floor plan flows easily from the kitchen into the dining and living areas, creating a great space for everyday living and entertaining. The oversized bedrooms provide plenty of room to relax, while the primary suite features dual vanities, a separate tub and shower, and a large walk-through closet. Recent updates include new carpet, and the property also includes a storage shed for added convenience. HVAC 5 years old. Could be a fantastic investment property. Enjoy the peace of country living while still being c
Key facts
- Cul-de-sac lot
- Open floor plan
- Dual vanities
Tags
Property features AI
Finance
- HOA & community: Association managed by Chaparral Management with an annual fee of $200
Exterior
- Utilities: Public water; Septic tank sewer
- Home design: Residential property; One- or two-story not specified; Built in 2000
- Construction: Cement siding; Composition roof; Built in 2000
- Exterior features: Cleared lot in a subdivision
Interior
- Bedrooms: Primary bedroom on the first floor (approx. 18 x 16); Two additional bedrooms on the first floor (each approx. 12 x 11)
- Bathrooms: 2 full bathrooms
- Heating & cooling: Central heating (electric); Central air conditioning (electric)
- Interior features: 3 total rooms
Neighborhood map
What this means for you Summary
Snapshot
- This is a 3-bed/2.0-bath manufactured listed at $185k.
Deal economics
- At list price, monthly cash flow is $341 ($4k/yr) — positive.
- The deal already cash-flows at list — no discount required.
- Meets the 1% rule at list price ($2k rent vs $185k).
- Recommended offer: $182k (1.5% below list) — sets the bar for market timing.
- Cap rate 8.5% vs local median 4.2% in Stagecoach — top-decile yield for the area; either an underpriced asset or a hidden risk that comps aren't pricing in. Stress-test before assuming the spread holds.
Location & tenants
- Location reads 61/100 on livability (#1,010 in TX) — a middle-class / working-renter tenant base. Strengths: employment A+, housing A+, crime A; Watch: amenities F, commute F, health & safety F.
- Magnolia ISD (rural): math 42% / reading 45% proficiency, ranked #247 of 826 in TX (top 30%) — families likely to look elsewhere, expect single-tenant / working-renter base with shorter leases.
- Zoned schools: Magnolia West H S (math 41% / reading 53%, grade D-, #591 of 1,632 statewide, top 38%, 2,208 students, 52% FRL).
- Market conditions: 553 active listings in the ZIP; 1 comparable units currently listed for rent nearby; solid renter incomes; 13,259 units permitted in Montgomery County in 2024 (1,402 in 5+ unit buildings).
Forward outlook
- Local home prices are declining (-3.0%/yr); year-one equity from $1k of loan paydown is wiped out by about $6k of value loss. Plan a longer hold.
- Montgomery County population projected at +65% by 2050 — long-run rental-demand tailwind backs the buy-and-hold thesis.
Negotiation context
- It's been on market 27 days — a 2% lower offer ($182k) is reasonable based on typical stale-listing flexibility.
- 6 sale attempts since 9y ago with the ask held roughly flat each time — persistent listings suggest the price (not the market) is what's stuck; bring a comps-based counter.
Risks & watch-outs
- Climate carrying-cost: severe wind risk, 99% chance of damaging wind over 30y; extreme-heat days projected 7→24/yr by 2055 (HVAC capex compounding) — expect insurance premiums to compound above CPI over the hold.
Questions for the listing agent
- What does the HOA fee cover, when was the last increase, and are there any pending special assessments or reserve-fund shortfalls?
- Is there a deadline driving the sale (1031 exchange, divorce, estate, relocation)? That informs how much negotiation room exists.
- Schools are F-rated, which usually means shorter tenancies and higher turnover. Who's the typical renter profile here, and what's been the actual vacancy rate?
- What's the average days-on-market for RENTAL listings here right now (not sales)? A rising rental-DOM trend means longer vacancies and softer asking-rent achievability than the comps imply.
- What's the recent tenant-quality profile in this submarket — average credit score on applications, eviction rate, late-payment / NSF rate, and stable-employment percentage? A property-management company in the area should have these aggregated.
- How much new for-sale + rental construction is in the pipeline within 1–3 miles? Heavy new supply typically softens prices + rents 12–24 months out; constrained supply supports both.
Investment metrics
- 1% rule
- 1.07% ✓
- Cap rate
- 8.50%
- Cash-on-cash
- 7.90%
- DSCR
- 1.35
- GRM
- 7.8
CMA / ARV
- ARV (median comp)
- $199,900
- List price
- $185,000
- Delta
- -5.45%
- Verdict
- FAIR
- Comps
- 13 within 1.0 mi
Show comp detail 4 sales within ~0.75 mi
| Address | Dist | Beds/Ba | Sqft | Sold | Price | $/sf | Match |
|---|---|---|---|---|---|---|---|
| 31302 W Timberloch Trl | 0.11mi | 3/2.0 | 1,792 (-0%) | 2mo | $219,900 | $123 | 93 |
| 30935 Towering Oaks Dr | 0.14mi | 3/2.0 | 2,052 (+14%) | 2mo | $289,900 | $141 | 68 |
| 31307 W Timberloch Trl | 0.13mi | 3/2.0 | 1,560 (-13%) | 8mo | $195,000 | $125 | 66 |
| 16218 Evergreen Timbers | 0.44mi | 3/2.0 | 1,568 (-13%) | 6mo | $209,995 | $134 | 53 |
Match score weights: distance 35% · size 25% · config 20% · recency 20%. Top-matched comps best support the ARV.
Projected returns pro-forma
-3.0% appreciation · 3.0% rent growth · sell at horizon
- IRR
- -4.3%
- Equity multiple
- 0.84×
- Total profit
- $-8,267
- Equity at exit
- $27,584
- IRR
- 5.4%
- Equity multiple
- 1.40×
- Total profit
- $20,756
- Equity at exit
- $15,995
Cash invested: $51,800 (down + closing). Projections, not guarantees.
Landlord ↔ Tenant lean methodology
- Overall (STATE)
- 87 Strongly Landlord-Friendly
- State Texas
- 87 Strongly Landlord-Friendly · R+5
- County
- — inherits STATE
- City
- — inherits STATE
ZIP-level market 77355
- Home prices YoY
- -30.3%
- Active inventory
- 553
- Price-to-rent
- 7.8×
Monthly cashflow live
- Estimated rent
- $1,987 medium interval (Pro) →
- Mortgage (P&I)
- −$970
- Tax from tax record
- −$165 /mo · $1,976/yr
- Insurance
- −$77
- HOA
- −$17
- Vacancy / Maint / Mgmt
- −$417
- Net cashflow
- $341
Break-even live
UW: 25.0% down · 7.5% · 30yr · 1.5% tax · 5.0% vac · 8.0% maint · 8.0% mgmt
Financing live
Cash to close
- Down payment
- $46,250
- Closing costs
- $5,550
- Reserves months
- —
- Total cash needed
- —
Loan-product check · same deal, 3 products live
Conventional
25% down · 7.5% · 30yr
- Down + closing
- —
- Monthly P&I
- —
- Monthly cashflow
- —
- DSCR
- —
- Eligible?
- —
Personal DTI + credit; lowest rate.
DSCR
20% down · 8.5% · 30yr
- Down + closing
- —
- Monthly P&I
- —
- Monthly cashflow
- —
- DSCR
- —
- Eligible?
- —
No personal income docs; deal must DSCR.
Hard money
10% down · 12.0% · 12mo
- Down + closing
- —
- Monthly P&I
- —
- Monthly cashflow
- —
- DSCR
- —
- Eligible?
- —
Short-term bridge; refi at stabilization.
Rent comps 1 comps
| Address | Beds | Baths | Sqft | Rent | $/sqft | DOM | Units | Dist |
|---|---|---|---|---|---|---|---|---|
| 24836 Sugar Pine Cone St Magnolia, TX | 3.0 | 2.0 | 1501 | $1,950 | $1.30 | 17d | 1 | 0.88mi |
HOA detail
- Monthly dues
- $17 · $204/yr
Listing history 28 events
-
2026-06-16days on market $185,000 Pending 27 DOM
-
2026-06-15days on market $185,000 Pending 26 DOM
-
2026-06-13days on market $185,000 Pending 24 DOM
-
2026-06-09days on market $185,000 Pending 20 DOM
-
2026-06-08days on market $185,000 Pending 19 DOM
-
2026-06-07statusdays on market $185,000 Pending 18 DOM
-
2026-06-04days on market $185,000 Active 15 DOM
-
2026-06-03days on market $185,000 Active 14 DOM
-
2026-06-02days on market $185,000 Active 13 DOM
-
2026-06-02price $185,000 Active 12 DOM
-
2026-06-01days on market $189,900 Active 12 DOM
-
2026-05-31days on market $189,900 Active 11 DOM
-
2026-05-13price $185,000 859-char remark
-
2026-05-04$189,000 Active 859-char remark
-
2026-04-03historical
-
2026-03-07$179,900 Active
-
2025-06-03historical
-
2025-04-29price $195,000
-
2025-04-04$199,999 Active
-
2022-12-31historical
-
2022-12-19price $189,900
-
2022-12-08$194,900 Active
-
2022-12-06historical
-
2017-08-02soldstatus Sold
-
2017-08-02soldstatus
-
2017-07-16$85,000
-
2017-07-16historical
-
2000-03-24soldstatus
ⓘ Source: listings_history table (triggers on properties + properties_extension) + one-shot
backfill from property_details.listing_events for pre-trigger history.
Tax reassessment forecast TX · Resets to sale price
- Current annual tax
- $1,976 · $165/mo
- Projected year-2 tax
- $3,386 · $282/mo
- Expected delta
- +$1,410/yr (+$117/mo · 71.3%)
ⓘ Screening estimate from a state-policy table — verify with the county assessor before closing.
Climate risk First Street
- Flood 1/10 Low FEMA zone X (unshaded) · 0% chance over 30 yrs
- Wildfire 3/10 Moderate
- Heat 9/10 Extreme 7 d/yr ≥111°F today · 24 d/yr by 30 yrs out
- Wind 8/10 Severe 99% chance of damaging wind over 30 yrs
- Air quality 2/10 Low 2 unhealthy d/yr today · 2 by 30 yrs out
Nearby sold comps map
Loading sold comps map…
Walkable amenities ~0.75 mi
Loading nearby amenities…
Taxation est. · year 1
- Rental income
- $23,845
- − Mortgage interest
- −$10,363
- − Property taxes
- −$1,976
- − Insurance
- −$925
- − Repairs & maintenance
- −$1,908
- − Management
- −$1,908
- − HOA
- −$204
- − Depreciation
- −$5,382
- Taxable income
- $1,180
- Est. tax owed @ 24.0%
- −$283
- After-tax cash flow
- $3,807/yr
For passive investors: Depreciation is non-cash, so a rental often shows a tax loss while cash-flowing — sheltering income. Rental losses are passive: they offset passive income freely, and up to $25,000/yr can offset ordinary (W-2) income if you actively participate and your MAGI is under $100k (phasing out to $0 by $150k); unused losses carry forward. On sale, claimed depreciation is recaptured at up to 25%, and gains may owe capital-gains tax (a 1031 exchange can defer both). Figures are a year-1 estimate at your 24.0% rate — not tax advice; consult a CPA.
Schools (NCES district)
- District
- Magnolia ISD
- NCES district ID
- 4828740
- Math proficiency
- 42% ▼ -7.00%
- Reading proficiency
- 45% ▼ -4.00%
- Median HH income
- $71,692
- Composite
- 39.46/100
- National rank
- #3958
- State rank
- #247 of 826 in TX
Livability — Stagecoach
- Score
- 61/100
- State rank
- #1010
- US rank
- #17937
Category grades
Schools grade is shown separately in the Schools card above.
Census & demographics
- County
- Montgomery County · 663,713 people
- Metro
- Houston-The Woodlands-Sugar Land, TX
- Population (ZIP)
- 32,847
- Household income
- $102,066
- Rent vs Own
- Severe rent burden
- 209.0
Population outlook (Montgomery County) Hauer SSP2
- Today (2025)
- 713,896 people
- By 2030
- 805,263 · +12.8%
- By 2040
- 992,708 · +39.1%
- By 2050
- 1,179,590 · +65.2%
- By 2075
- 1,628,084 · +128.1%
- By 2100
- 1,937,880 · +171.5%
Race, ethnicity, and origin ACS 2023
- Neighborhood character
- Predominantly White (68%)
- Race & ethnicity
- White 68% Hispanic / Latino 25% Two or more races 14% Black 2% Native American 2%
- Hispanic origin (detail)
- Mexican 18%
- Common ancestry
- Slovak 4% Serbian 2% Romanian 2%
- Foreign-born
- 7% · Canada, Jamaica
- Languages at home
- 82% English-only · Spanish 17%
Political lean MEDSL · Montgomery
- 2024 margin
- Solid R (+45.5) · D 26.8% · R 72.3%
- 2008→2024 swing
- +7.2pp toward D · 2008: -52.7pp · 2024: -45.5pp
- All cycles
- 2024: R+45.5 2020: R+43.8 2016: R+51.4 2012: R+60.7 2008: R+52.7
Not yet ingested
- Civics
- —
Market trends
- HPI YoY
- ▼ -116.90%
- Current HPI
- 268.5845
- Rent YoY
- —
- Metro
- Houston-The Woodlands-Sugar Land, TX
- State GDP YoY
- ▲ 3.95%
- F500 in state
- 110
Industry mix (Fortune 500 HQ in TX)
| Industry | F500 HQs | Revenue |
|---|---|---|
| Energy | 16 | $1,198B |
|
||
| Technology | 5 | $198B |
|
||
| Engineering / Construction | 4 | $72B |
|
||
| Energy Services | 3 | $60B |
|
||
| Utilities | 3 | $41B |
|
||
| Healthcare | 2 | $330B |
|
||
Price history
+117.6% since first listed21 events — show timeline
- 2026-06-17 Pending — HARMLS
- 2026-06-05 Pending — HARMLS
- 2026-06-01 Price Changed $185,000 HARMLS
- 2026-05-20 Listed $189,900 HARMLS
- 2026-05-19 Listing Removed — HARMLS
- 2026-05-13 Price Changed $185,000 HARMLS
- 2026-05-04 Listed $189,000 HARMLS
- 2026-04-03 Listing Removed — HARMLS
- 2026-03-07 Listed $179,900 HARMLS
- 2025-06-03 Listing Removed — HARMLS
- 2025-04-29 Price Changed $195,000 HARMLS
- 2025-04-04 Listed $199,999 HARMLS
- 2022-12-31 Listing Removed — HARMLS
- 2022-12-19 Price Changed $189,900 HARMLS
- 2022-12-08 Listed $194,900 HARMLS
- 2022-12-06 Coming Soon — HARMLS
- 2017-08-02 Sold (Public Records) — Public Records
- 2017-08-02 Sold (MLS) — HARMLS
- 2017-07-16 Listed $85,000 HARMLS
- 2017-07-16 Listing Removed — HARMLS
- 2000-03-24 Sold (Public Records) — Public Records
Property tax history
+4.9%/yrLatest (2025): $1,976 · -19.5% YoY. Source: county tax records.
Cash-flow waterfall
monthlySold comps — $/sqft
last 12 mo · ≤1 miLoading sold comps…