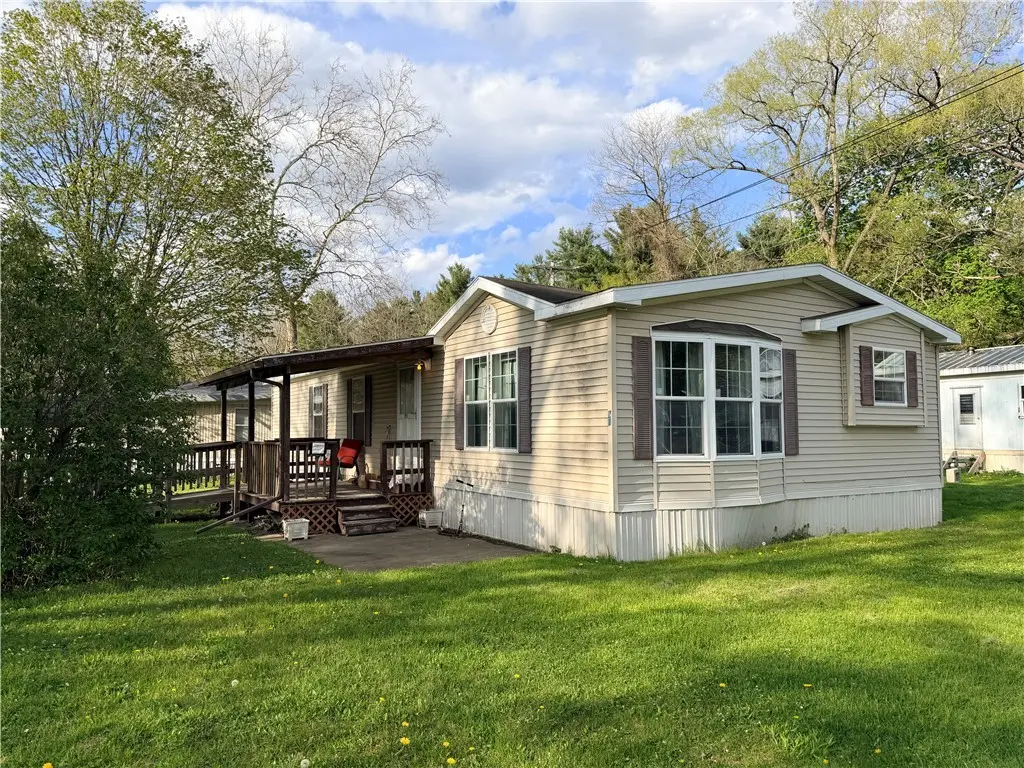
6592 State Route 21 · Almond, NY
Flood risk 1/10 · Minimal
- FEMA flood zone
- AE
- Chance of flooding over 30 yrs
- 0.0%
- Est. flood insurance / yr
- $2,026 – $9,024
Fire risk 2/10 · Minimal
- Est. fire insurance / yr
- $691 – $1,283
Heat risk 2/10 · Minimal
- Hot days now (above 89°F)
- 7 days/yr
- Hot days in 30 yrs
- 18 days/yr
Wind risk 1/10 · Minimal
- Chance of severe wind over 30 yrs
- —
Air-quality risk 1/10 · Minimal
- Unhealthy air days now
- 0 days/yr
- Unhealthy air days in 30 yrs
- 0 days/yr
Risk factors via First Street. Map © Google.
Why this score? — see what drove the B+ grade
The composite is a weighted blend of 9 inputs, each scored 0–100. Each bar is that input's sub-score; the figure is the points it added to the 100-point composite (weight × sub-score).
- Cash flow +30.0/30.0
- 1% rule +10.0/10.0
- DSCR +10.0/10.0
- ARV discount +7.5/15.0
- Appreciation +6.1/10.0
- Schools +4.5/10.0
- Livability +3.2/5.0
- Rent growth +2.5/5.0
- Condition / age +2.5/5.0
$50,000
🖨 Deal sheet 📄 Offer letter ✓ Due diligence
Listing remarks MLS
Bank owned sold as is Proof of funds required with all offers. 24 pads with 16 ooccuppied with tenants trailers. some water repairs needed. great deal for investors.
Key facts
- Covered porch
- Double wide
- Carport
Tags
Property features AI
Finance
- HOA & community: Land lease: $395
Exterior
- Parking: Carport
- Utilities: Well water; Circuit breaker electrical panel; Cable available; High-speed internet available
- Home design: Single-story dwelling; Double-wide manufactured home (Marlette Homes); Existing condition
- Construction: Vinyl siding; PEX plumbing; Asphalt shingle pitched roof; Pillar/post/pier foundation
- Exterior features: Covered porch; Gravel driveway; Shed(s)/storage
Interior
- Kitchen: Electric oven; Electric range; Free-standing range; Oven; Range hood; Dishwasher; Refrigerator
- Bedrooms: 2 main-level bedrooms
- Flooring: Carpet; Vinyl; Varied flooring
- Bathrooms: 2 full bathrooms (both on the main level)
- Heating & cooling: Gas forced-air heating; Central air conditioning
- Interior features: Den; Separate/formal dining room; Separate/formal living room; Kitchen island; Pantry; Quartz counters; Main level primary; Primary suite; Low threshold shower; No stairs; Accessible approach with ramp
- Laundry & utility: Washer; Dryer; Main-level laundry with accessible utilities
Neighborhood map
What this means for you Summary
Snapshot
- This is a 2-bed/2.0-bath manufactured listed at $50k.
Deal economics
- At list price, monthly cash flow is $48 ($577/yr) — positive.
- The deal already cash-flows at list — no discount required.
- Meets the 1% rule at list price ($1k rent vs $50k).
- Recommended offer: $48k (3.0% below list) — sets the bar for market timing.
Location & tenants
- Location reads 63/100 on livability (#801 in NY) — a middle-class / working-renter tenant base. Strengths: cost of living A+, housing A+, schools B; Watch: health & safety D, crime F, amenities F.
- Alfred-Almond Central School District (rural): math 50% / reading 55% proficiency, ranked #345 of 590 in NY (top 58%) — acceptable for families but not a draw, mixed tenant base, ~2y average lease.
- Market conditions: 4 active listings in the ZIP; 87 units permitted in Allegany County in 2024 (0 in 5+ unit buildings).
Forward outlook
- In year one you build about $1k of equity ($346 loan paydown + $1k appreciation (2.2% local appreciation)).
- Allegany County population projected at -26% by 2050 — secular population decline; favor cash flow + early exit over multi-decade hold.
- At projected returns (2.2% appreciation + 3.0% rent growth), your $14k cash investment doubles in ~6 years — after that, you're playing with house money.
Negotiation context
- It's been on market 42 days — a 3% lower offer ($48k) is reasonable based on typical stale-listing flexibility.
- 4 sale attempts since 16y ago with the ask held roughly flat each time — persistent listings suggest the price (not the market) is what's stuck; bring a comps-based counter.
Risks & watch-outs
- Watch-outs: flood insurance adds $460/mo.
- Climate carrying-cost: in FEMA flood zone AE (mandatory federal flood insurance) — expect insurance premiums to compound above CPI over the hold.
Questions for the listing agent
- It's been on market 42 days. Have you received any prior offers? Is the seller open to a 3% concession, seller financing, or rate buy-down credit?
- What's the actual annual flood-insurance premium (NFIP or private), and is the property in a SFHA with mandatory coverage?
- Is there a deadline driving the sale (1031 exchange, divorce, estate, relocation)? That informs how much negotiation room exists.
- Schools are B-rated — typically a magnet for longer-tenancy family renters. What's the average tenant stay here, and is there a school-zone premium baked into asking?
- Crime grade is F in this area — have there been break-ins, vandalism, or insurance claims at this property in the last 3 years? What carrier currently insures it and at what premium?
- What's the average days-on-market for RENTAL listings here right now (not sales)? A rising rental-DOM trend means longer vacancies and softer asking-rent achievability than the comps imply.
- What's the recent tenant-quality profile in this submarket — average credit score on applications, eviction rate, late-payment / NSF rate, and stable-employment percentage? A property-management company in the area should have these aggregated.
- How much new for-sale + rental construction is in the pipeline within 1–3 miles? Heavy new supply typically softens prices + rents 12–24 months out; constrained supply supports both.
Investment metrics
- 1% rule
- 2.16% ✓
- Cap rate
- 18.50%
- Cash-on-cash
- 43.59%
- DSCR
- 2.94
- GRM
- 3.9
CMA / ARV
No comps found within radius.
Projected returns pro-forma
2.17% appreciation · 3.0% rent growth · sell at horizon
- IRR
- 9.4%
- Equity multiple
- 1.52×
- Total profit
- $7,237
- Equity at exit
- $20,195
- IRR
- 12.7%
- Equity multiple
- 2.76×
- Total profit
- $24,655
- Equity at exit
- $29,449
Cash invested: $14,000 (down + closing). Projections, not guarantees.
Landlord ↔ Tenant lean methodology
- Overall (STATE)
- 15 Strongly Tenant-Friendly
- State New York
- 15 Strongly Tenant-Friendly · D+10
- County
- — inherits STATE
- City
- — inherits STATE
ZIP-level market 14803
- Home prices YoY
- 0.9%
- Active inventory
- 4
- Price-to-rent
- 3.9×
Monthly cashflow live
- Estimated rent
- $1,081 medium interval (Pro) →
- Mortgage (P&I)
- −$262
- Tax est. 1.5%
- −$62 /mo · $750/yr
- Insurance
- −$21
- Flood insurance flood zone
- −$460 /mo · $5,525/yr
- HOA
- −$0
- Vacancy / Maint / Mgmt
- −$227
- Net cashflow
- $48
Break-even live
UW: 25.0% down · 7.5% · 30yr · 1.5% tax · 5.0% vac · 8.0% maint · 8.0% mgmt
Financing live
Cash to close
- Down payment
- $12,500
- Closing costs
- $1,500
- Reserves months
- —
- Total cash needed
- —
Loan-product check · same deal, 3 products live
Conventional
25% down · 7.5% · 30yr
- Down + closing
- —
- Monthly P&I
- —
- Monthly cashflow
- —
- DSCR
- —
- Eligible?
- —
Personal DTI + credit; lowest rate.
DSCR
20% down · 8.5% · 30yr
- Down + closing
- —
- Monthly P&I
- —
- Monthly cashflow
- —
- DSCR
- —
- Eligible?
- —
No personal income docs; deal must DSCR.
Hard money
10% down · 12.0% · 12mo
- Down + closing
- —
- Monthly P&I
- —
- Monthly cashflow
- —
- DSCR
- —
- Eligible?
- —
Short-term bridge; refi at stabilization.
Listing history 23 events
-
2026-06-19days on market $50,000 Active 42 DOM
-
2026-06-18days on market $50,000 Active 41 DOM
-
2026-06-17days on market $50,000 Active 40 DOM
-
2026-06-16days on market $50,000 Active 39 DOM
-
2026-06-15days on market $50,000 Active 38 DOM
-
2026-06-14days on market $50,000 Active 36 DOM
-
2026-06-12days on market $50,000 Active 35 DOM
-
2026-06-09days on market $50,000 Active 32 DOM
-
2026-06-08days on market $50,000 Active 31 DOM
-
2026-06-07days on market $50,000 Active 30 DOM
-
2026-06-05days on market $50,000 Active 27 DOM
-
2026-06-02days on market $50,000 Active 25 DOM
-
2026-06-01days on market $50,000 Active 24 DOM
-
2026-05-31days on market $50,000 Active 23 DOM
-
2026-05-30days on market $50,000 Active 22 DOM
-
2026-05-08$50,000 Active 318-char remark
-
2025-07-13historical $415
-
2025-07-13historical $415
-
2025-07-13$415
-
2025-07-13$395
-
2010-11-02historical 165-char remark
Show marketing remark (165 chars)
Bank owned sold as is Proof of funds required with all offers. 24 pads with 16 ooccuppied with tenants trailers. some water repairs needed. great deal for investors.
-
2010-10-26soldstatus $62,000 165-char remark
Show marketing remark (165 chars)
Bank owned sold as is Proof of funds required with all offers. 24 pads with 16 ooccuppied with tenants trailers. some water repairs needed. great deal for investors.
-
2010-07-20$119,000 165-char remark
Show marketing remark (165 chars)
Bank owned sold as is Proof of funds required with all offers. 24 pads with 16 ooccuppied with tenants trailers. some water repairs needed. great deal for investors.
ⓘ Source: listings_history table (triggers on properties + properties_extension) + one-shot
backfill from property_details.listing_events for pre-trigger history.
Climate risk First Street
- Flood 1/10 Low FEMA zone AE · 0% chance over 30 yrs
- Wildfire 2/10 Low
- Heat 2/10 Low 7 d/yr ≥89°F today · 18 d/yr by 30 yrs out
- Wind 1/10 Low
- Air quality 1/10 Low 0 unhealthy d/yr today · 0 by 30 yrs out
Nearby sold comps map
Loading sold comps map…
Walkable amenities ~0.75 mi
Loading nearby amenities…
Taxation est. · year 1
- Rental income
- $12,973
- − Mortgage interest
- −$2,801
- − Property taxes
- −$750
- − Insurance
- −$5,775
- − Repairs & maintenance
- −$1,038
- − Management
- −$1,038
- − Depreciation
- −$1,455
- Taxable income
- $117
- Est. tax owed @ 24.0%
- −$28
- After-tax cash flow
- $549/yr
For passive investors: Depreciation is non-cash, so a rental often shows a tax loss while cash-flowing — sheltering income. Rental losses are passive: they offset passive income freely, and up to $25,000/yr can offset ordinary (W-2) income if you actively participate and your MAGI is under $100k (phasing out to $0 by $150k); unused losses carry forward. On sale, claimed depreciation is recaptured at up to 25%, and gains may owe capital-gains tax (a 1031 exchange can defer both). Figures are a year-1 estimate at your 24.0% rate — not tax advice; consult a CPA.
Schools (NCES district)
- District
- Alfred-Almond Central School District
- NCES district ID
- 3602700
- Math proficiency
- 50% ▼ -7.00%
- Reading proficiency
- 55% ▼ -3.00%
- Median HH income
- $47,682
- Composite
- 44.62/100
- National rank
- #2772
- State rank
- #345 of 590 in NY
Livability — Almond
- Score
- 63/100
- State rank
- #801
- US rank
- #15500
Category grades
Schools grade is shown separately in the Schools card above.
Census & demographics
- Population (ZIP)
- 1,491
Population outlook (Allegany County) Hauer SSP2
- Today (2025)
- 45,362 people
- By 2030
- 43,078 · -5.0%
- By 2040
- 38,031 · -16.2%
- By 2050
- 33,634 · -25.9%
- By 2075
- 25,285 · -44.3%
- By 2100
- 18,902 · -58.3%
Race, ethnicity, and origin ACS 2023
- Neighborhood character
- Predominantly White (95%)
- Race & ethnicity
- White 95% Hispanic / Latino 3% Two or more races 1%
- Common ancestry
- Romanian 7% Slovak 4% Iranian 1%
- Foreign-born
- 1%
- Languages at home
- 98% English-only · Spanish 2%
Political lean MEDSL · Allegany
- 2024 margin
- Solid R (+43.2) · D 28.4% · R 71.6%
- 2008→2024 swing
- -21.5pp toward R · 2008: -21.7pp · 2024: -43.2pp
- All cycles
- 2024: R+43.2 2020: R+38.9 2016: R+42.3 2012: R+25.3 2008: R+21.7
Not yet ingested
- Civics
- —
Market trends
- HPI YoY
- ▲ 2.17%
- Current HPI
- 235.4083
- Rent YoY
- —
- Metro
- —
- State GDP YoY
- ▲ 2.60%
- F500 in state
- 92
Industry mix (Fortune 500 HQ in NY)
| Industry | F500 HQs | Revenue |
|---|---|---|
| Financial Services | 10 | $950B |
|
||
| Consumer Goods | 9 | $162B |
|
||
| Insurance | 4 | $225B |
|
||
| Telecommunications | 2 | $144B |
|
||
| Pharmaceuticals | 2 | $112B |
|
||
| Media / Entertainment | 2 | $69B |
|
||
Price history
-58.0% since first listed8 events — show timeline
- 2026-05-08 Listed $50,000 UNYREIS
- 2025-07-13 Rental Removed $415 LEASESTAR
- 2025-07-13 Rental Removed $415 LEASESTAR
- 2025-07-13 Listed for Rent $415 LEASESTAR
- 2025-07-13 Listed for Rent $395 LEASESTAR
- 2010-11-02 Listing Removed — WNYREIS
- 2010-10-26 Sold (MLS) $62,000 WNYREIS
- 2010-07-20 Listed $119,000 WNYREIS
Cash-flow waterfall
monthlySold comps — $/sqft
last 12 mo · ≤1 miLoading sold comps…