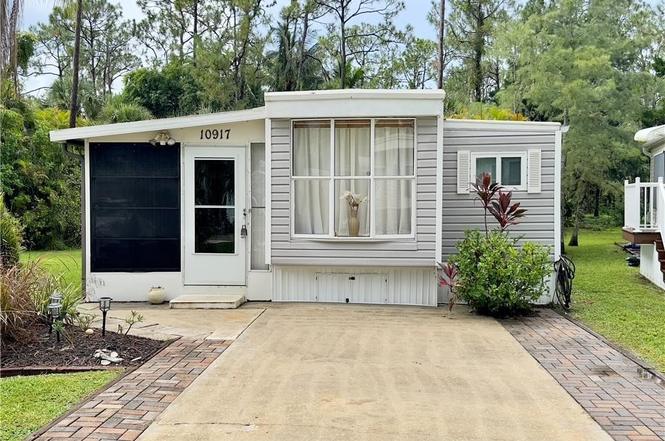
10917 Brown Pelican Cir · Estero, FL
Flood risk 4/10 · Minor
- FEMA flood zone
- AH
- Chance of flooding over 30 yrs
- 0.13%
- Est. flood insurance / yr
- $1,142 – $2,507
Fire risk 5/10 · Moderate
- Est. fire insurance / yr
- $947 – $1,759
Heat risk 9/10 · Severe
- Hot days now (above 107°F)
- 6 days/yr
- Hot days in 30 yrs
- 25 days/yr
Wind risk 10/10 · Severe
- Chance of severe wind over 30 yrs
- 99.0%
Air-quality risk 3/10 · Minor
- Unhealthy air days now
- 2 days/yr
- Unhealthy air days in 30 yrs
- 2 days/yr
Risk factors via First Street. Map © Google.
Why this score? — see what drove the B- grade
The composite is a weighted blend of 9 inputs, each scored 0–100. Each bar is that input's sub-score; the figure is the points it added to the 100-point composite (weight × sub-score).
- Cash flow +28.8/30.0
- 1% rule +10.0/10.0
- DSCR +10.0/10.0
- ARV discount +7.5/15.0
- Schools +4.1/10.0
- Livability +4.0/5.0
- Condition / age +2.5/5.0
- Rent growth +2.1/5.0
- Appreciation +0.0/10.0
$109,901
🖨 Deal sheet 📄 Offer letter ✓ Due diligence
Listing remarks
Enjoy this quaint Florida Oasis! Low HOA fees, taxes, and you own the land! 1 bedroom/ 1 bath with 2 sofa sleepers manufactured home. Newer windows, newer siding, newer AC, newer roof, recently remodeled bathroom, wide driveway, premier lot, fully furnished. This is a very active community park where you own the land your home sits on. Amenities include Pickle Ball, Bocce ball, tennis and shuffle ball courts, a huge swimming pool and spa, a butterfly garden, nature trails with bridges for bikers, hikers, or golf carts. A 23-acre lake to enjoy plus many more! Close to shopping, dining, and the Southwest Florida International Airport.
Key facts
- Newer ac
- Remodeled bathroom
- Newer roof
Tags
Property features AI
Finance
- Financial info: Pets not allowed
- HOA & community: Homeowners association with quarterly fee; Association fee includes cable TV, internet, and road maintenance; Community amenities include clubhouse, fitness center, pool, spa/hot tub, tennis, pickleball, bocce, shuffleboard, racquetball, billiard room, library, bike storage, RV/boat storage, park, trails, sidewalks, management, and street lights; Senior community; Approximately 640 units in the community
Exterior
- Security: Gated community with security gate
- Utilities: Cable available; Public water; Public sewer
- Home design: Manufactured home; Single-story; Entry level: 1; Faces northwest
- Construction: Aluminum siding; Rolled/Hot Mop roof; Manufactured construction
- Exterior features: Patio; Lanai; Porch; Screened patio/porch; Community pool; Irregular lot; Lot exposures to the southeast
Interior
- Kitchen: Microwave; Range; Refrigerator
- Bedrooms: Screened porch listed as a room type
- Flooring: Carpet; Laminate
- Bathrooms: 1 full bathroom
- Heating & cooling: Central heating (electric); Central air conditioning (electric)
- Interior features: Jalousie windows; Furnished; Shower only with separate shower; High-speed internet
Neighborhood map
What this means for you Summary
Snapshot
- This is a 1-bed/1.0-bath manufactured listed at $110k.
Deal economics
- At list price, monthly cash flow is $218 ($3k/yr) — positive.
- The deal already cash-flows at list — no discount required.
- Meets the 1% rule at list price ($2k rent vs $110k).
- Recommended offer: $97k (12.0% below list) — sets the bar for market timing.
- Cap rate 10.3% vs local median 3.4% in Estero — top-decile yield for the area; either an underpriced asset or a hidden risk that comps aren't pricing in. Stress-test before assuming the spread holds.
Location & tenants
- Location reads 79/100 on livability (#149 in FL, #2,242 nationally) — a middle-class / working-renter tenant base. Strengths: crime A+, employment A+, housing A+; Watch: amenities F, commute F, cost of living D-.
- Lee (suburban): math 47% / reading 50% proficiency, ranked #42 of 73 in FL (top 58%) — families likely to look elsewhere, expect single-tenant / working-renter base with shorter leases.
- Market conditions: Rents soft (-1.4%/yr); 668 active listings in the ZIP; solid renter incomes; 15,411 units permitted in Lee County in 2024 (4,686 in 5+ unit buildings).
Forward outlook
- Local home prices are declining (-3.0%/yr); year-one equity from $760 of loan paydown is wiped out by about $3k of value loss. Plan a longer hold.
- Lee County population projected at +44% by 2050 — long-run rental-demand tailwind backs the buy-and-hold thesis.
Negotiation context
- It's been on market 223 days — a 12% lower offer ($97k) is reasonable based on typical stale-listing flexibility.
- 3 sale attempts since 6y ago with the ask held roughly flat each time — persistent listings suggest the price (not the market) is what's stuck; bring a comps-based counter.
- Current owner paid $52k; list at $110k implies a 111% gain — meaningful room to come down on a strong offer.
Risks & watch-outs
- Watch-outs: flood insurance adds $152/mo.
- Climate carrying-cost: in FEMA flood zone AH (mandatory federal flood insurance); severe wind risk, 99% chance of damaging wind over 30y; moderate wildfire risk; extreme-heat days projected 6→25/yr by 2055 (HVAC capex compounding) — expect insurance premiums to compound above CPI over the hold.
Questions for the listing agent
- It's been on market 223 days. Have you received any prior offers? Is the seller open to a 12% concession, seller financing, or rate buy-down credit?
- What's the actual annual flood-insurance premium (NFIP or private), and is the property in a SFHA with mandatory coverage?
- What does the HOA fee cover, when was the last increase, and are there any pending special assessments or reserve-fund shortfalls?
- Why hasn't it sold? Are there any deal-killer items the seller is aware of (foundation, flood, title, zoning, code violations)?
- Is there a deadline driving the sale (1031 exchange, divorce, estate, relocation)? That informs how much negotiation room exists.
- Schools are A-rated — typically a magnet for longer-tenancy family renters. What's the average tenant stay here, and is there a school-zone premium baked into asking?
- What's the average days-on-market for RENTAL listings here right now (not sales)? A rising rental-DOM trend means longer vacancies and softer asking-rent achievability than the comps imply.
- What's the recent tenant-quality profile in this submarket — average credit score on applications, eviction rate, late-payment / NSF rate, and stable-employment percentage? A property-management company in the area should have these aggregated.
- How much new for-sale + rental construction is in the pipeline within 1–3 miles? Heavy new supply typically softens prices + rents 12–24 months out; constrained supply supports both.
Investment metrics
- 1% rule
- 1.52% ✓
- Cap rate
- 10.33%
- Cash-on-cash
- 14.43%
- DSCR
- 1.64
- GRM
- 5.5
CMA / ARV
No comps found within radius.
Projected returns pro-forma
-3.0% appreciation · 0.0% rent growth · sell at horizon
- IRR
- -7.9%
- Equity multiple
- 0.72×
- Total profit
- $-8,585
- Equity at exit
- $16,387
- IRR
- -4.6%
- Equity multiple
- 0.75×
- Total profit
- $-7,546
- Equity at exit
- $9,502
Cash invested: $30,772 (down + closing). Projections, not guarantees.
Landlord ↔ Tenant lean methodology
- Overall (STATE)
- 87 Strongly Landlord-Friendly
- State Florida
- 87 Strongly Landlord-Friendly · R+3
- County
- — inherits STATE
- City
- — inherits STATE
ZIP-level market 33928
- Rents YoY
- -1.4%
- Active inventory
- 668
- Price-to-rent
- 5.5×
Monthly cashflow live
- Estimated rent
- $1,668 medium interval (Pro) →
- Mortgage (P&I)
- −$576
- Tax from tax record
- −$87 /mo · $1,040/yr
- Insurance
- −$46
- Flood insurance flood zone
- −$152 /mo · $1,824/yr
- HOA
- −$239
- Vacancy / Maint / Mgmt
- −$350
- Net cashflow
- $218
Break-even live
UW: 25.0% down · 7.5% · 30yr · 1.5% tax · 5.0% vac · 8.0% maint · 8.0% mgmt
Financing live
Cash to close
- Down payment
- $27,475
- Closing costs
- $3,297
- Reserves months
- —
- Total cash needed
- —
Loan-product check · same deal, 3 products live
Conventional
25% down · 7.5% · 30yr
- Down + closing
- —
- Monthly P&I
- —
- Monthly cashflow
- —
- DSCR
- —
- Eligible?
- —
Personal DTI + credit; lowest rate.
DSCR
20% down · 8.5% · 30yr
- Down + closing
- —
- Monthly P&I
- —
- Monthly cashflow
- —
- DSCR
- —
- Eligible?
- —
No personal income docs; deal must DSCR.
Hard money
10% down · 12.0% · 12mo
- Down + closing
- —
- Monthly P&I
- —
- Monthly cashflow
- —
- DSCR
- —
- Eligible?
- —
Short-term bridge; refi at stabilization.
HOA detail
- Monthly dues
- $239 · $2,868/yr
- Likely covers
- pool
Listing history 17 events
-
2026-06-17days on market $109,901 Active 223 DOM
-
2026-06-16days on market $109,901 Active 222 DOM
-
2026-06-16days on market $109,901 Active 221 DOM
-
2026-06-13days on market $109,901 Active 219 DOM
-
2026-06-09days on market $109,901 Active 215 DOM
-
2026-06-07days on market $109,901 Active 213 DOM
-
2026-06-02days on market $109,901 Active 208 DOM
-
2026-06-01days on market $109,901 Active 207 DOM
-
2026-06-01days on market $109,901 Active 206 DOM
-
2025-10-30$109,901 Active
-
2025-10-30historical
-
2025-09-23price $109,901
-
2025-06-25$89,998 Active
-
2021-04-20historical
-
2020-10-08price $74,947
-
2020-08-27$79,900 Active
-
2007-06-14soldstatus $52,000
ⓘ Source: listings_history table (triggers on properties + properties_extension) + one-shot
backfill from property_details.listing_events for pre-trigger history.
Tax reassessment forecast FL · Resets to sale price
- Current annual tax
- $1,040 · $87/mo
- Projected year-2 tax
- $1,040 · $87/mo
- Expected delta
- $0/yr ($0/mo · 0.0%)
ⓘ Screening estimate from a state-policy table — verify with the county assessor before closing.
Climate risk First Street
- Flood 4/10 Moderate FEMA zone AH · 13% chance over 30 yrs
- Wildfire 5/10 Major
- Heat 9/10 Extreme 6 d/yr ≥107°F today · 25 d/yr by 30 yrs out
- Wind 10/10 Extreme 99% chance of damaging wind over 30 yrs
- Air quality 3/10 Moderate 2 unhealthy d/yr today · 2 by 30 yrs out
Nearby sold comps map
Loading sold comps map…
Walkable amenities ~0.75 mi
Loading nearby amenities…
Taxation est. · year 1
- Rental income
- $20,015
- − Mortgage interest
- −$6,156
- − Property taxes
- −$1,040
- − Insurance
- −$2,374
- − Repairs & maintenance
- −$1,601
- − Management
- −$1,601
- − HOA
- −$2,868
- − Depreciation
- −$3,197
- Taxable income
- $1,178
- Est. tax owed @ 24.0%
- −$283
- After-tax cash flow
- $2,332/yr
For passive investors: Depreciation is non-cash, so a rental often shows a tax loss while cash-flowing — sheltering income. Rental losses are passive: they offset passive income freely, and up to $25,000/yr can offset ordinary (W-2) income if you actively participate and your MAGI is under $100k (phasing out to $0 by $150k); unused losses carry forward. On sale, claimed depreciation is recaptured at up to 25%, and gains may owe capital-gains tax (a 1031 exchange can defer both). Figures are a year-1 estimate at your 24.0% rate — not tax advice; consult a CPA.
Schools (NCES district)
- District
- Lee
- NCES district ID
- 1201080
- Math proficiency
- 47% ▼ -11.00%
- Reading proficiency
- 50% ▼ -4.00%
- Median HH income
- $49,518
- Composite
- 41.49/100
- National rank
- #3458
- State rank
- #42 of 73 in FL
Livability — Estero
- Score
- 79/100
- State rank
- #149
- US rank
- #2242
Category grades
Schools grade is shown separately in the Schools card above.
Census & demographics
- Census place
- Estero, FL
- County
- Lee County · 788,662 people
- City population
- 31,926
- Metro
- Cape Coral-Fort Myers, FL
- Population (ZIP)
- 31,926
- Household income
- $102,624
- Rent vs Own
- Severe rent burden
- 606.0
Population outlook (Lee County) Hauer SSP2
- Today (2025)
- 871,946 people
- By 2030
- 955,468 · +9.6%
- By 2040
- 1,113,587 · +27.7%
- By 2050
- 1,256,891 · +44.1%
- By 2075
- 1,560,270 · +78.9%
- By 2100
- 1,726,848 · +98.0%
Race, ethnicity, and origin ACS 2023
- Neighborhood character
- Predominantly White (85%)
- Race & ethnicity
- White 85% Hispanic / Latino 8% Two or more races 7% Asian 3% Black 1%
- Hispanic origin (detail)
- Mexican 2% Puerto Rican 2% Cuban 1%
- Common ancestry
- Romanian 5% Lithuanian 3% Slovak 2%
- Foreign-born
- 11% · Canada, China, Jamaica
- Languages at home
- 90% English-only · Spanish 5% Other Indo-European 1% French/Haitian/Cajun 1%
Political lean MEDSL · Lee
- 2024 margin
- Strong R (+28.4) · D 35.5% · R 63.9%
- 2008→2024 swing
- -18.0pp toward R · 2008: -10.4pp · 2024: -28.4pp
- All cycles
- 2024: R+28.4 2020: R+19.2 2016: R+20.4 2012: R+16.6 2008: R+10.4
Not yet ingested
- Civics
- —
Market trends
- HPI YoY
- ▼ -109.49%
- Current HPI
- 197.5913
- Rent YoY
- ▼ -1.42%
- Metro
- Cape Coral-Fort Myers, FL
- State GDP YoY
- ▲ 3.28%
- F500 in state
- 36
Industry mix (Fortune 500 HQ in FL)
| Industry | F500 HQs | Revenue |
|---|---|---|
| Industrial Technology | 2 | $29B |
|
||
| Insurance | 2 | $17B |
|
||
| Retail | 1 | $60B |
|
||
| Technology Distribution | 1 | $58B |
|
||
| Homebuilding | 1 | $35B |
|
||
| Technology Manufacturing | 1 | $35B |
|
||
Price history
+111.3% since first listed8 events — show timeline
- 2025-10-30 Listing Removed — FORTMLS
- 2025-10-30 Listed $109,901 FORTMLS
- 2025-09-23 Price Changed $109,901 FORTMLS
- 2025-06-25 Listed $89,998 FORTMLS
- 2021-04-20 Listing Removed — FORTMLS
- 2020-10-08 Price Changed $74,947 FORTMLS
- 2020-08-27 Listed $79,900 FORTMLS
- 2007-06-14 Sold (Public Records) $52,000 Public Records
Property tax history
+5.5%/yrLatest (2025): $1,040 · -2.7% YoY. Source: county tax records.
Cash-flow waterfall
monthlySold comps — $/sqft
last 12 mo · ≤1 miLoading sold comps…