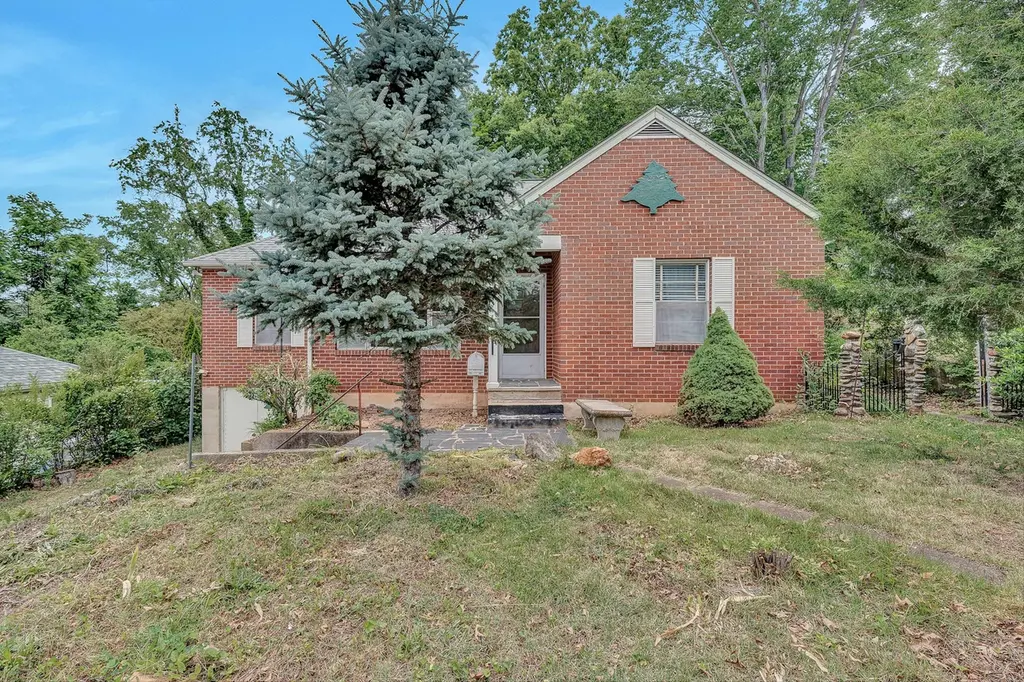
1917 Langdon Rd SW · Roanoke, VA
Flood risk 1/10 · Minimal
- FEMA flood zone
- X (unshaded)
- Chance of flooding over 30 yrs
- 0.0%
- Est. flood insurance / yr
- $473 – $860
Fire risk 1/10 · Minimal
- Est. fire insurance / yr
- $666 – $1,236
Heat risk 5/10 · Moderate
- Hot days now (above 100°F)
- 7 days/yr
- Hot days in 30 yrs
- 18 days/yr
Wind risk 2/10 · Minimal
- Chance of severe wind over 30 yrs
- 1.0%
Air-quality risk 1/10 · Minimal
- Unhealthy air days now
- 0 days/yr
- Unhealthy air days in 30 yrs
- 0 days/yr
Risk factors via First Street. Map © Google.
Why this score? — see what drove the C- grade
The composite is a weighted blend of 9 inputs, each scored 0–100. Each bar is that input's sub-score; the figure is the points it added to the 100-point composite (weight × sub-score).
- ARV discount +15.0/15.0
- Cash flow +13.4/30.0
- Rent growth +4.1/5.0
- Schools +4.1/10.0
- DSCR +4.0/10.0
- Livability +3.7/5.0
- 1% rule +3.4/10.0
- Condition / age +2.5/5.0
- Appreciation +0.0/10.0
$249,500
🖨 Deal sheet 📄 Offer letter ✓ Due diligence
Listing remarks
For the first time since it was custom-built in 1948, this cherished Raleigh Court/Grandin Court home is ready for its next chapter. Filled with timeless character and solid craftsmanship, this unique one-owner property even comes with the original blueprints. Step inside to find original hardwood floors throughout, spacious living room and a cozy fireplace. The main level flows into an expansive 19'x35' addition that serves as a spectacular gathering space, showcasing beautiful, Natural ¾'' Tongue and Groove Western Cedar Paneling. The upper level features a private suite complete with a third bedroom, a full bathroom with a shower, and deep dormer storageThe exterior is a private o
Key facts
- Classic rock walls
- Private oasis
- Expansive addition
Tags
Neighborhood map
What this means for you Summary
Snapshot
- This is a 3-bed/2.0-bath single-family listed at $250k.
Deal economics
- At list price, monthly cash flow is $3 ($33/yr) — positive.
- The deal already cash-flows at list — no discount required.
- To meet the 1% rule (rent ≥ 1% of price), the offer needs to be $209k (16.3% below list).
- Recommended offer: $209k (16.3% below list) — sets the bar for 1% rule.
- Cap rate 6.3% vs local median 4.2% in Roanoke — top-decile yield for the area; either an underpriced asset or a hidden risk that comps aren't pricing in. Stress-test before assuming the spread holds.
Location & tenants
- Location reads 73/100 on livability (#163 in VA) — a middle-class / working-renter tenant base. Strengths: cost of living A+, health & safety A+, housing A; Watch: amenities C-, employment D, crime F.
- Roanoke City Public School District (urban): math 40% / reading 58% proficiency, ranked #102 of 131 in VA (top 78%) — families likely to look elsewhere, expect single-tenant / working-renter base with shorter leases; 67% free/reduced lunch — lower-income household profile, screen leases tightly.
- Market conditions: Rents rising fast (+6.4%/yr); 120 active listings in the ZIP; 10 comparable units currently listed for rent nearby; rentals lingering (median 44d on market — plan ~5-8 weeks vacancy on turnover, expect pricing pressure); 60% of comp listings sitting > 30 days — soft ceiling on asking rent; 113 units permitted in Roanoke city in 2024 (0 in 5+ unit buildings).
- This rent runs 36% of the median local income ($70k/yr) — at the standard rent-burdened threshold; future hikes will face affordability resistance.
Forward outlook
- Local home prices are declining (-3.0%/yr); year-one equity from $2k of loan paydown is wiped out by about $7k of value loss. Plan a longer hold.
- Roanoke County population projected at +11% by 2050 — modest demand growth; plan on rents tracking national, not racing it.
Negotiation context
- It's been on market 24 days — a 2% lower offer ($246k) is reasonable based on typical stale-listing flexibility.
Risks & watch-outs
- Watch-outs: built in 1948 — expect roof / HVAC / electrical / plumbing capex.
- Climate carrying-cost: extreme-heat days projected 7→18/yr by 2055 (HVAC capex compounding) — expect insurance premiums to compound above CPI over the hold.
Questions for the listing agent
- Built in 1948 — when were the roof, HVAC, electrical panel, plumbing, and water heater last replaced?
- Is there a deadline driving the sale (1031 exchange, divorce, estate, relocation)? That informs how much negotiation room exists.
- Schools are A-rated — typically a magnet for longer-tenancy family renters. What's the average tenant stay here, and is there a school-zone premium baked into asking?
- Crime grade is F in this area — have there been break-ins, vandalism, or insurance claims at this property in the last 3 years? What carrier currently insures it and at what premium?
- What's the average days-on-market for RENTAL listings here right now (not sales)? A rising rental-DOM trend means longer vacancies and softer asking-rent achievability than the comps imply.
- What's the recent tenant-quality profile in this submarket — average credit score on applications, eviction rate, late-payment / NSF rate, and stable-employment percentage? A property-management company in the area should have these aggregated.
- How much new for-sale + rental construction is in the pipeline within 1–3 miles? Heavy new supply typically softens prices + rents 12–24 months out; constrained supply supports both.
Investment metrics
- 1% rule
- 0.84% ✗
- Cap rate
- 6.31%
- Cash-on-cash
- 0.05%
- DSCR
- 1.00
- GRM
- 10.0
CMA / ARV
- ARV (on-the-fly)
- $313,470
- Comps found
- 12
Show comp detail 12 sales within ~0.75 mi
| Address | Dist | Beds/Ba | Sqft | Sold | Price | $/sf | Match |
|---|---|---|---|---|---|---|---|
| 2629 Fairway Dr SW | 0.25mi | 3/2.0 | 1,949 (+1%) | 7mo | $279,000 | $143 | 81 |
| 2316 Fairway Dr SW | 0.38mi | 3/1.5 | 1,888 (-2%) | 0mo | $318,000 | $168 | 76 |
| 1811 Fareham Rd SW | 0.13mi | 4/2.5 (+1) | 1,802 (-7%) | 0mo | $291,175 | $162 | 75 |
| 1868 Carlton Rd SW | 0.16mi | 2/1.0 (-1) | 1,831 (-5%) | 3mo | $250,750 | $137 | 72 |
| 1918 Langdon Rd SW | 0.03mi | 3/2.5 | 2,168 (+12%) | 7mo | $365,000 | $168 | 71 |
| 2775 Derwent Dr SW | 0.07mi | 2/1.0 (-1) | 1,782 (-8%) | 6mo | $245,000 | $137 | 70 |
| 1842 Carlton Rd SW | 0.21mi | 2/1.0 (-1) | 1,878 (-3%) | 8mo | $240,000 | $128 | 70 |
| 2334 Maiden Ln SW | 0.38mi | 3/2.5 | 1,802 (-7%) | 7mo | $357,500 | $198 | 63 |
| 2232 Lincoln Ave SW | 0.34mi | 3/2.0 | 2,152 (+11%) | 4mo | $325,000 | $151 | 62 |
| 1923 Brandon Ave SW | 0.72mi | 3/2.5 | 1,984 (+2%) | 5mo | $329,950 | $166 | 56 |
| 2714 Grandin Rd SW | 0.68mi | 3/3.0 | 1,869 (-3%) | 5mo | $318,000 | $170 | 54 |
| 1930 Brandon Ave SW | 0.70mi | 4/1.0 (+1) | 1,969 (+2%) | 6mo | $254,000 | $129 | 50 |
Match score weights: distance 35% · size 25% · config 20% · recency 20%. Top-matched comps best support the ARV.
Projected returns pro-forma
-3.0% appreciation · 6.39% rent growth · sell at horizon
- IRR
- -12.7%
- Equity multiple
- 0.53×
- Total profit
- $-32,900
- Equity at exit
- $37,201
- IRR
- 0.7%
- Equity multiple
- 1.06×
- Total profit
- $3,939
- Equity at exit
- $21,572
Cash invested: $69,860 (down + closing). Projections, not guarantees.
Landlord ↔ Tenant lean methodology
- Overall (STATE)
- 55 Moderately Landlord-Leaning
- State Virginia
- 55 Moderately Landlord-Leaning · D+2
- County
- — inherits STATE
- City
- — inherits STATE
ZIP-level market 24015
- Rents YoY
- 6.4%
- Active inventory
- 120
- Price-to-rent
- 10.0×
Monthly cashflow live
- Estimated rent
- $2,089 high interval (Pro) →
- Mortgage (P&I)
- −$1,308
- Tax from tax record
- −$235 /mo · $2,826/yr
- Insurance
- −$104
- HOA
- −$0
- Vacancy / Maint / Mgmt
- −$439
- Net cashflow
- $3
Break-even live
UW: 25.0% down · 7.5% · 30yr · 1.5% tax · 5.0% vac · 8.0% maint · 8.0% mgmt
Financing live
Cash to close
- Down payment
- $62,375
- Closing costs
- $7,485
- Reserves months
- —
- Total cash needed
- —
Loan-product check · same deal, 3 products live
Conventional
25% down · 7.5% · 30yr
- Down + closing
- —
- Monthly P&I
- —
- Monthly cashflow
- —
- DSCR
- —
- Eligible?
- —
Personal DTI + credit; lowest rate.
DSCR
20% down · 8.5% · 30yr
- Down + closing
- —
- Monthly P&I
- —
- Monthly cashflow
- —
- DSCR
- —
- Eligible?
- —
No personal income docs; deal must DSCR.
Hard money
10% down · 12.0% · 12mo
- Down + closing
- —
- Monthly P&I
- —
- Monthly cashflow
- —
- DSCR
- —
- Eligible?
- —
Short-term bridge; refi at stabilization.
Rent comps 10 comps
| Address | Beds | Baths | Sqft | Rent | $/sqft | DOM | Units | Dist |
|---|---|---|---|---|---|---|---|---|
| 2615 Laburnum Ave SW Roanoke, VA | 2.0 | 1.5 | 1323 | $1,800 | $1.36 | 43d | 1 | 0.12mi |
| 2615 Laburnum Ave SW Roanoke, VA | 2.0 | 1.5 | 1323 | $1,825 | $1.38 | 21d | 1 | 0.12mi |
| 1668 Brandon Ave SW Roanoke, VA | 3.0 | 1.0 | 1552 | $1,849 | $1.19 | 43d | 1 | 0.95mi |
| 1709 Sherwood Ave SW Roanoke, VA | 2.0 | 1.0 | 1271 | $1,650 | $1.30 | 43d | 1 | 1.07mi |
| 3419 Evergreen Ln SW Roanoke, VA | 4.0 | 3.5 | 2240 | $3,195 | $1.43 | 43d | 1 | 1.17mi |
| 3423 Evergreen Ln SW Roanoke, VA | 4.0 | 3.5 | 2240 | $3,195 | $1.43 | 43d | 1 | 1.19mi |
| 3427 Evergreen Ln SW Roanoke, VA | 4.0 | 3.5 | 2240 | $3,195 | $1.43 | 43d | 1 | 1.19mi |
| 2911 Evergreen Ln SW Roanoke, VA | 4.0 | 3.5 | 2240 | $3,195 | $1.43 | 21d | 1 | 1.20mi |
| 2923 Evergreen Ln SW Roanoke, VA | 4.0 | 3.5 | 2240 | $3,195 | $1.43 | 21d | 1 | 1.20mi |
| 2917 Evergreen Ln SW Roanoke, VA | 4.0 | 3.5 | 2240 | $3,195 | $1.43 | 21d | 1 | 1.20mi |
Listing history 18 events
-
2026-06-18days on market $249,500 Active 24 DOM
-
2026-06-17days on market $249,500 Active 23 DOM
-
2026-06-16days on market $249,500 Active 22 DOM
-
2026-06-15days on market $249,500 Active 21 DOM
-
2026-06-14days on market $249,500 Active 19 DOM
-
2026-06-13days on market $249,500 Active 18 DOM
-
2026-06-10days on market $249,500 Active 16 DOM
-
2026-06-09days on market $249,500 Active 15 DOM
-
2026-06-08days on market $249,500 Active 14 DOM
-
2026-06-05days on market $249,500 Active 10 DOM
-
2026-06-03days on market $249,500 Active 9 DOM
-
2026-06-02days on market $249,500 Active 8 DOM
-
2026-06-01days on market $249,500 Active 7 DOM
-
2026-05-31days on market $249,500 Active 6 DOM
-
2026-05-30days on market $249,500 Active 5 DOM
-
2026-05-08historical
-
2026-04-13price $259,000
-
2025-11-08$279,000 Active
ⓘ Source: listings_history table (triggers on properties + properties_extension) + one-shot
backfill from property_details.listing_events for pre-trigger history.
Tax reassessment forecast VA · Resets to sale price
- Current annual tax
- $2,826 · $235/mo
- Projected year-2 tax
- $2,826 · $235/mo
- Expected delta
- $0/yr ($0/mo · 0.0%)
ⓘ Screening estimate from a state-policy table — verify with the county assessor before closing.
Climate risk First Street
- Flood 1/10 Low FEMA zone X (unshaded) · 0% chance over 30 yrs
- Wildfire 1/10 Low
- Heat 5/10 Major 7 d/yr ≥100°F today · 18 d/yr by 30 yrs out
- Wind 2/10 Low 100% chance of damaging wind over 30 yrs
- Air quality 1/10 Low 0 unhealthy d/yr today · 0 by 30 yrs out
Nearby sold comps map
Loading sold comps map…
Walkable amenities ~0.75 mi
Loading nearby amenities…
Taxation est. · year 1
- Rental income
- $25,072
- − Mortgage interest
- −$13,976
- − Property taxes
- −$2,826
- − Insurance
- −$1,248
- − Repairs & maintenance
- −$2,006
- − Management
- −$2,006
- − Depreciation
- −$7,258
- Taxable loss
- −$4,246
- Est. tax savings @ 24.0%
- +$1,019
- After-tax cash flow
- $1,052/yr
For passive investors: Depreciation is non-cash, so a rental often shows a tax loss while cash-flowing — sheltering income. Rental losses are passive: they offset passive income freely, and up to $25,000/yr can offset ordinary (W-2) income if you actively participate and your MAGI is under $100k (phasing out to $0 by $150k); unused losses carry forward. On sale, claimed depreciation is recaptured at up to 25%, and gains may owe capital-gains tax (a 1031 exchange can defer both). Figures are a year-1 estimate at your 24.0% rate — not tax advice; consult a CPA.
Schools (NCES district)
- District
- Roanoke City Public School District
- NCES district ID
- 5103300
- Math proficiency
- 40% ▼ -38.00%
- Reading proficiency
- 58% ▼ -12.00%
- Median HH income
- $38,592
- Composite
- 40.8/100
- National rank
- #3639
- State rank
- #102 of 131 in VA
Livability — Roanoke
- Score
- 73/100
- State rank
- #163
- US rank
- #5055
Category grades
Schools grade is shown separately in the Schools card above.
Census & demographics
- Census place
- Roanoke, VA
- County
- Roanoke City · 101,625 people
- City population
- 168,930
- Metro
- Roanoke, VA
- Population (ZIP)
- 15,865
- Household income
- $69,831
- Rent vs Own
- Severe rent burden
- 525.0
Population outlook (Roanoke County) Hauer SSP2
- Today (2025)
- 106,094 people
- By 2030
- 108,927 · +2.7%
- By 2040
- 114,104 · +7.5%
- By 2050
- 118,032 · +11.3%
- By 2075
- 123,363 · +16.3%
- By 2100
- 116,827 · +10.1%
Race, ethnicity, and origin ACS 2023
- Neighborhood character
- Predominantly White (83%)
- Race & ethnicity
- White 83% Two or more races 7% Black 5% Hispanic / Latino 5% Asian 2%
- Common ancestry
- Italian 5% Slovak 3% Serbian 2%
- Foreign-born
- 4% · Canada, Jamaica
- Languages at home
- 95% English-only · Spanish 2% Tagalog/Filipino 1% Other Indo-European 1%
Political lean MEDSL · Roanoke
- 2024 margin
- Strong D (+23.6) · D 61.1% · R 37.5% · Other 1.4%
- 2008→2024 swing
- +0.2pp no change · 2008: 23.4pp · 2024: 23.6pp
- All cycles
- 2024: D+23.6 2020: D+25.8 2016: D+17.6 2012: D+21.5 2008: D+23.4
Not yet ingested
- Civics
- —
Market trends
- HPI YoY
- ▼ -333.83%
- Current HPI
- 192.3108
- Rent YoY
- ▲ 6.39%
- Metro
- Roanoke, VA
- State GDP YoY
- ▲ 2.40%
- F500 in state
- 50
Industry mix (Fortune 500 HQ in VA)
| Industry | F500 HQs | Revenue |
|---|---|---|
| Aerospace / Defense | 4 | $236B |
|
||
| Technology / Defense | 3 | $32B |
|
||
| Financial Services | 2 | $176B |
|
||
| Utilities | 2 | $27B |
|
||
| Insurance | 2 | $25B |
|
||
| Technology | 2 | $15B |
|
||
Price history
-7.2% since first listed3 events — show timeline
- 2026-05-08 Listing Removed — MLSRV
- 2026-04-13 Price Changed $259,000 MLSRV
- 2025-11-08 Listed $279,000 MLSRV
Property tax history
+3.1%/yrLatest (2025): $2,826 · +0.3% YoY. Source: county tax records.
Cash-flow waterfall
monthlySold comps — $/sqft
last 12 mo · ≤1 miLoading sold comps…