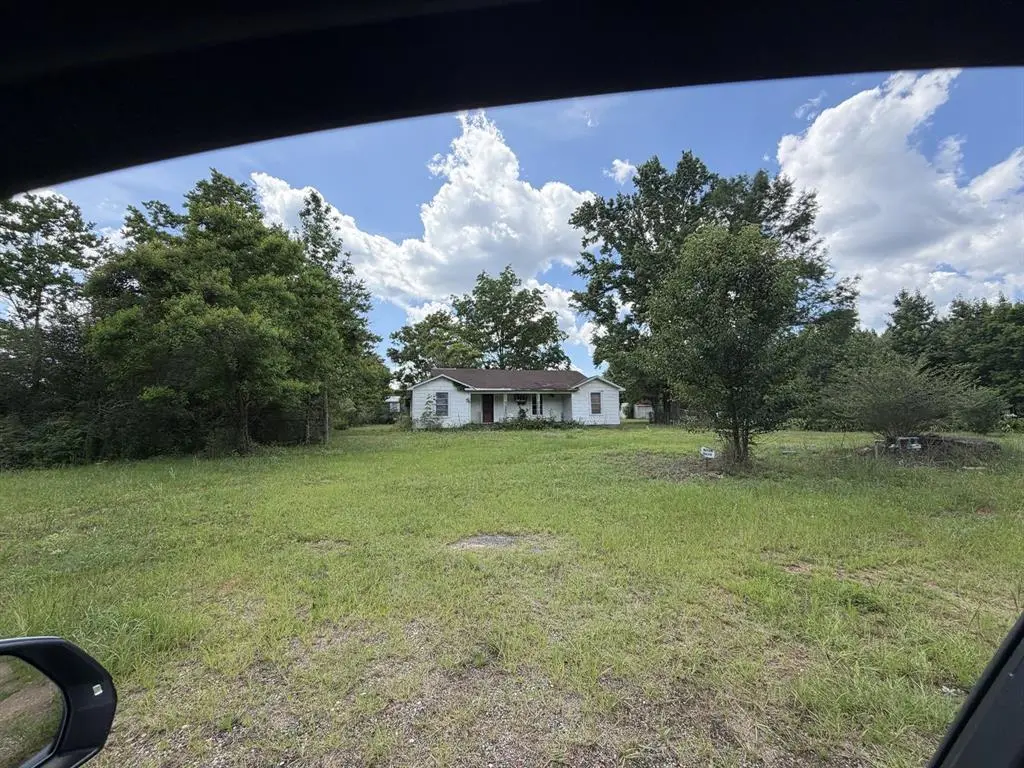
1112 Old Sarepta Church Rd · Sarepta, LA
Flood risk 1/10 · Minimal
- FEMA flood zone
- X (unshaded)
- Chance of flooding over 30 yrs
- 0.0%
- Est. flood insurance / yr
- $507 – $1,088
Fire risk 3/10 · Minor
- Est. fire insurance / yr
- $1,269 – $2,357
Heat risk 6/10 · Moderate
- Hot days now (above 112°F)
- 7 days/yr
- Hot days in 30 yrs
- 22 days/yr
Wind risk 6/10 · Moderate
- Chance of severe wind over 30 yrs
- 53.0%
Air-quality risk 1/10 · Minimal
- Unhealthy air days now
- 0 days/yr
- Unhealthy air days in 30 yrs
- 0 days/yr
Risk factors via First Street. Map © Google.
Why this score? — see what drove the B grade
The composite is a weighted blend of 9 inputs, each scored 0–100. Each bar is that input's sub-score; the figure is the points it added to the 100-point composite (weight × sub-score).
- Cash flow +30.0/30.0
- 1% rule +10.0/10.0
- DSCR +10.0/10.0
- ARV discount +7.5/15.0
- Appreciation +5.0/10.0
- Livability +2.8/5.0
- Rent growth +2.5/5.0
- Condition / age +2.5/5.0
- Schools +1.8/10.0
$40,000
🖨 Deal sheet (PDF) 📄 Offer letter ✓ Due diligence
Listing remarks
Opportunity knocks at 1112 Old Sarepta Church Road! Sitting on 2 acres in a quiet rural setting, this property offers solid value and real potential for the right buyer. The 3 bedroom, 2 bath mobile home is livable and has a rental history, making it a reasonable option for an investor looking for immediate income potential or a buyer seeking affordable acreage to call home. The land provides plenty of open space with room to grow, garden, or simply enjoy the peace and quiet of country living. A partially damaged structure on the front of the property is present and will require removal, and buyers should be aware it contains asbestos siding requiring professional abatement prior to demolit
Key facts
- Open space
- Country living
- 2 acres
Tags
Property features AI
Finance
- Other: Lot is approximately 2 acres and is subdivided
- Financial info: Listing terms: Cash; Loan type: Treat as clear; No second mortgage
- HOA & community: No association
Exterior
- Parking: Driveway
- Utilities: City water; Septic system; Cable available; Not in a municipal utility district
- Home design: Single family residence; Residential property; Attached: Yes; Built in 1980; Entry level: One
- Construction: Aluminum siding; Vinyl siding; Other exterior materials; Pillar/post/pier foundation; Other roof
- Exterior features: Covered patio/porch; Deck; Horse permitted
Interior
- Kitchen: Electric oven; Electric range
- Bedrooms: Primary bedroom on level 1; Total of 3 bedrooms
- Flooring: Luxury vinyl plank
- Bathrooms: 2 full bathrooms
- Heating & cooling: Central heating; Electric cooling
- Interior features: Eat-in kitchen; Kitchen island; High-speed internet available; Window coverings; One living area; One dining area; Room count: 3; Levels: One
- Laundry & utility: Washer; Dryer; Utility room
Neighborhood map
What this means for you Summary
Snapshot
- This is a 3-bed/2.0-bath single-family listed at $40k.
Deal economics
- At list price, monthly cash flow is $604 ($7k/yr) — positive.
- The deal already cash-flows at list — no discount required.
- Meets the 1% rule at list price ($1k rent vs $40k).
- Recommended offer: $39k (1.5% below list) — sets the bar for market timing.
Location & tenants
- Location reads 55/100 on livability (#369 in LA) — a working-class tenant base; expect higher turnover. Strengths: cost of living A+, housing A-; Watch: crime F, amenities F, commute F.
- Webster Parish (town): math 17% / reading 26% proficiency, ranked #67 of 98 in LA (top 68%) — low school quality limits family demand, transient renter base, plan for 1-2y turnover; 61% free/reduced lunch — lower-income household profile, screen leases tightly.
- Market conditions: 16 active listings in the ZIP; 36 units permitted in Webster Parish in 2024 (0 in 5+ unit buildings).
Forward outlook
- In year one you build about $1k of equity ($277 loan paydown + $1k appreciation (3.0% local appreciation)).
- Webster County population projected at -21% by 2050 — secular population decline; favor cash flow + early exit over multi-decade hold.
- At projected returns (3.0% appreciation + 3.0% rent growth), your $11k cash investment doubles in ~2 years — after that, you're playing with house money.
Negotiation context
- It's been on market 21 days — a 2% lower offer ($39k) is reasonable based on typical stale-listing flexibility.
Risks & watch-outs
- Climate carrying-cost: major wind risk, 53% chance of damaging wind over 30y; extreme-heat days projected 7→22/yr by 2055 (HVAC capex compounding) — expect insurance premiums to compound above CPI over the hold.
Questions for the listing agent
- Is there a deadline driving the sale (1031 exchange, divorce, estate, relocation)? That informs how much negotiation room exists.
- Crime grade is F in this area — have there been break-ins, vandalism, or insurance claims at this property in the last 3 years? What carrier currently insures it and at what premium?
- What's the average days-on-market for RENTAL listings here right now (not sales)? A rising rental-DOM trend means longer vacancies and softer asking-rent achievability than the comps imply.
- What's the recent tenant-quality profile in this submarket — average credit score on applications, eviction rate, late-payment / NSF rate, and stable-employment percentage? A property-management company in the area should have these aggregated.
- How much new for-sale + rental construction is in the pipeline within 1–3 miles? Heavy new supply typically softens prices + rents 12–24 months out; constrained supply supports both.
Investment metrics
- 1% rule
- 2.70% ✓
- Cap rate
- 24.42%
- Cash-on-cash
- 64.76%
- DSCR
- 3.88
- GRM
- 3.1
CMA / ARV
- ARV (on-the-fly)
- $91,200
- Comps found
- 1
Show comp detail 1 sale within ~0.75 mi
| Address | Dist | Beds/Ba | Sqft | Sold | Price | $/sf | Match |
|---|---|---|---|---|---|---|---|
| 777 802 Hwy | 0.49mi | 2/1.0 (-1) | 1,252 (+4%) | 2mo | $95,000 | $76 | 59 |
Match score weights: distance 35% · size 25% · config 20% · recency 20%. Top-matched comps best support the ARV.
Projected returns pro-forma
3.0% appreciation · 3.0% rent growth · sell at horizon
- IRR
- 69.5%
- Equity multiple
- 4.87×
- Total profit
- $43,313
- Equity at exit
- $17,986
- IRR
- 69.0%
- Equity multiple
- 9.95×
- Total profit
- $100,247
- Equity at exit
- $27,718
Cash invested: $11,200 (down + closing). Projections, not guarantees.
Landlord ↔ Tenant lean methodology
- Overall (STATE)
- 90 Strongly Landlord-Friendly
- State Louisiana
- 90 Strongly Landlord-Friendly · R+12
- County
- — inherits STATE
- City
- — inherits STATE
ZIP-level market 71071
- Active inventory
- 16
- Price-to-rent
- 3.1×
Monthly cashflow live
- Estimated rent
- $1,082 medium interval (Pro) →
- Mortgage (P&I)
- −$210
- Tax from tax record
- −$24 /mo · $283/yr
- Insurance
- −$17
- HOA
- −$0
- Vacancy / Maint / Mgmt
- −$227
- Net cashflow
- $604
Break-even live
Sensitivity live
| Price | -10% $627 | -5% $616 | +0% $604 | +5% $593 | +10% $582 |
|---|---|---|---|---|---|
| Rent | -10% $519 | -5% $562 | +0% $604 | +5% $647 | +10% $690 |
| Rate | -1.0pp $625 | -0.5pp $615 | base $604 | +0.5pp $594 | +1.0pp $583 |
UW: 25.0% down · 7.5% · 30yr · 1.5% tax · 5.0% vac · 8.0% maint · 8.0% mgmt
Financing live
Cash to close
- Down payment
- $10,000
- Closing costs
- $1,200
- Reserves months
- —
- Total cash needed
- —
Loan-product check · same deal, 3 products live
Conventional
25% down · 7.5% · 30yr
- Down + closing
- —
- Monthly P&I
- —
- Monthly cashflow
- —
- DSCR
- —
- Eligible?
- —
Personal DTI + credit; lowest rate.
DSCR
20% down · 8.5% · 30yr
- Down + closing
- —
- Monthly P&I
- —
- Monthly cashflow
- —
- DSCR
- —
- Eligible?
- —
No personal income docs; deal must DSCR.
Hard money
10% down · 12.0% · 12mo
- Down + closing
- —
- Monthly P&I
- —
- Monthly cashflow
- —
- DSCR
- —
- Eligible?
- —
Short-term bridge; refi at stabilization.
Listing history 15 events
-
2026-06-18days on market $40,000 Active 21 DOM
-
2026-06-17days on market $40,000 Active 20 DOM
-
2026-06-16days on market $40,000 Active 19 DOM
-
2026-06-15days on market $40,000 Active 18 DOM
-
2026-06-14days on market $40,000 Active 16 DOM
-
2026-06-13days on market $40,000 Active 15 DOM
-
2026-06-10days on market $40,000 Active 13 DOM
-
2026-06-09days on market $40,000 Active 12 DOM
-
2026-06-08days on market $40,000 Active 11 DOM
-
2026-06-07days on market $40,000 Active 10 DOM
-
2026-06-02days on market $40,000 Active 5 DOM
-
2026-06-01days on market $40,000 Active 4 DOM
-
2026-05-31days on market $40,000 Active 3 DOM
-
2026-05-30days on market $40,000 Active 2 DOM
-
2026-05-06$40,000 Active
ⓘ Source: listings_history table (triggers on properties + properties_extension) + one-shot
backfill from property_details.listing_events for pre-trigger history.
Tax reassessment forecast LA · Resets to sale price
- Current annual tax
- $283 · $24/mo
- Projected year-2 tax
- $283 · $24/mo
- Expected delta
- $0/yr ($0/mo · 0.0%)
ⓘ Screening estimate from a state-policy table — verify with the county assessor before closing.
Climate risk First Street
- Flood 1/10 Low FEMA zone X (unshaded) · 0% chance over 30 yrs
- Wildfire 3/10 Moderate
- Heat 6/10 Major 7 d/yr ≥112°F today · 22 d/yr by 30 yrs out
- Wind 6/10 Major 53% chance of damaging wind over 30 yrs
- Air quality 1/10 Low 0 unhealthy d/yr today · 0 by 30 yrs out
Nearby sold comps map
Loading sold comps map…
Walkable amenities ~0.75 mi
Loading nearby amenities…
Taxation est. · year 1
- Rental income
- $12,979
- − Mortgage interest
- −$2,241
- − Property taxes
- −$283
- − Insurance
- −$200
- − Repairs & maintenance
- −$1,038
- − Management
- −$1,038
- − Depreciation
- −$1,164
- Taxable income
- $7,015
- Est. tax owed @ 24.0%
- −$1,683
- After-tax cash flow
- $5,569/yr
For passive investors: Depreciation is non-cash, so a rental often shows a tax loss while cash-flowing — sheltering income. Rental losses are passive: they offset passive income freely, and up to $25,000/yr can offset ordinary (W-2) income if you actively participate and your MAGI is under $100k (phasing out to $0 by $150k); unused losses carry forward. On sale, claimed depreciation is recaptured at up to 25%, and gains may owe capital-gains tax (a 1031 exchange can defer both). Figures are a year-1 estimate at your 24.0% rate — not tax advice; consult a CPA.
Schools (NCES district)
- District
- Webster Parish
- NCES district ID
- 2201890
- Math proficiency
- 17% ▼ -39.00%
- Reading proficiency
- 26% ▼ -38.00%
- Median HH income
- $33,011
- Composite
- 17.5/100
- National rank
- #9055
- State rank
- #67 of 98 in LA
Livability — Sarepta
- Score
- 55/100
- State rank
- #369
- US rank
- #23421
Category grades
Schools grade is shown separately in the Schools card above.
Census & demographics
- Population (ZIP)
- 2,184
Population outlook (Webster County) Hauer SSP2
- Today (2025)
- 37,736 people
- By 2030
- 36,203 · -4.1%
- By 2040
- 32,988 · -12.6%
- By 2050
- 29,743 · -21.2%
- By 2075
- 22,346 · -40.8%
- By 2100
- 15,045 · -60.1%
Race, ethnicity, and origin ACS 2023
- Neighborhood character
- Predominantly White (96%)
- Race & ethnicity
- White 96% Two or more races 2% Black 1%
- Common ancestry
- Slovak 2% Lithuanian 1% Iranian 1%
- Foreign-born
- 1%
- Languages at home
- 99% English-only · German/W. Germanic 1%
Political lean MEDSL · Webster
- 2024 margin
- Solid R (+36.5) · D 31.2% · R 67.7% · Other 1.1%
- 2008→2024 swing
- -10.2pp toward R · 2008: -26.3pp · 2024: -36.5pp
- All cycles
- 2024: R+36.5 2020: R+31.1 2016: R+29.1 2012: R+25.0 2008: R+26.3
Not yet ingested
- Civics
- —
Market trends
- HPI YoY
- —
- Current HPI
- —
- Rent YoY
- —
- Metro
- —
- State GDP YoY
- ▲ 3.29%
- F500 in state
- 10
Industry mix (Fortune 500 HQ in LA)
| Industry | F500 HQs | Revenue |
|---|---|---|
| Telecommunications | 2 | $23B |
|
||
| Utilities | 1 | $12B |
|
||
| Wholesale / Distribution | 1 | $5B |
|
||
| Advertising | 1 | $2B |
|
||
Price history
1 event — show timeline
- 2026-05-06 Listed $40,000 NTREIS
Property tax history
-2.9%/yrLatest (2025): $283 · +1.3% YoY. Source: county tax records.
Cash-flow waterfall
monthlySold comps — $/sqft
last 12 mo · ≤1 miLoading sold comps…