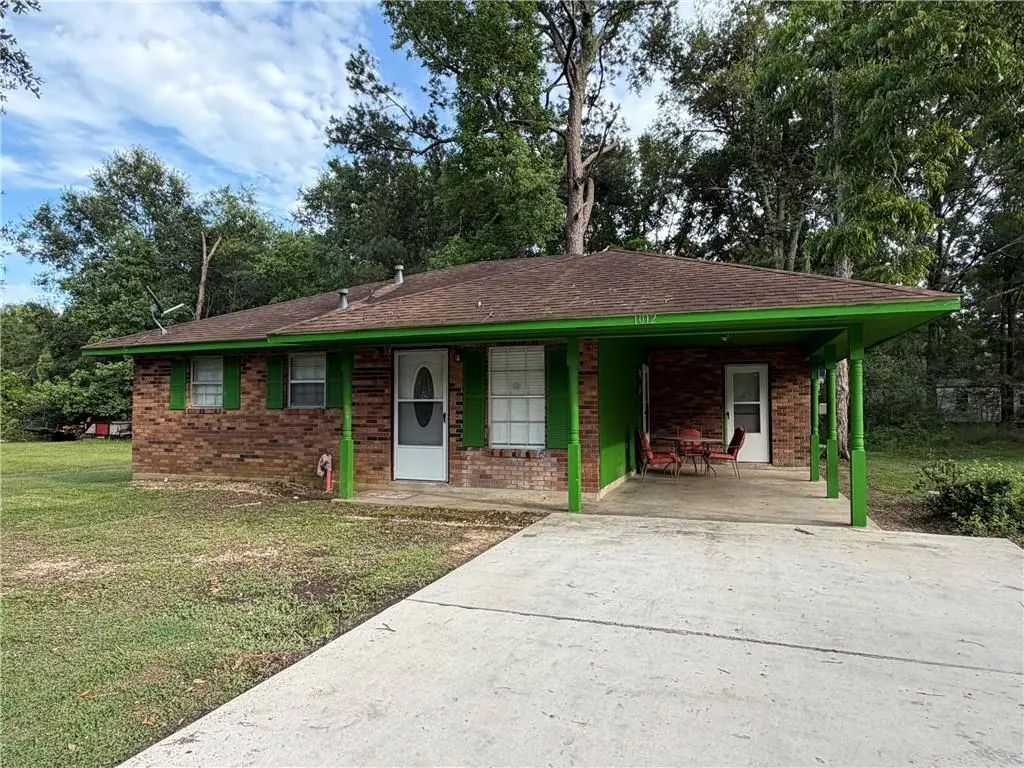
1012 Varnado St · Hammond, LA
Flood risk 7/10 · Major
- FEMA flood zone
- A
- Chance of flooding over 30 yrs
- 0.96%
- Est. flood insurance / yr
- $1,009 – $1,996
Fire risk 3/10 · Minor
- Est. fire insurance / yr
- $1,269 – $2,357
Heat risk 8/10 · Major
- Hot days now (above 109°F)
- 7 days/yr
- Hot days in 30 yrs
- 21 days/yr
Wind risk 9/10 · Severe
- Chance of severe wind over 30 yrs
- 99.0%
Air-quality risk 2/10 · Minimal
- Unhealthy air days now
- 0 days/yr
- Unhealthy air days in 30 yrs
- 1 days/yr
Risk factors via First Street. Map © Google.
Why this score? — see what drove the D+ grade
The composite is a weighted blend of 9 inputs, each scored 0–100. Each bar is that input's sub-score; the figure is the points it added to the 100-point composite (weight × sub-score).
- Cash flow +19.6/30.0
- ARV discount +7.5/15.0
- DSCR +6.2/10.0
- 1% rule +4.1/10.0
- Livability +3.5/5.0
- Rent growth +2.6/5.0
- Condition / age +2.5/5.0
- Schools +2.0/10.0
- Appreciation +0.0/10.0
$160,000
🖨 Deal sheet (PDF) 📄 Offer letter ✓ Due diligence
Listing remarks MLS
Updated and move-in ready ranch-style home featuring approximately 1,100 SF of living area. Recent updates include kitchen, baths, flooring, and paint. Functional floor plan, spacious yard, and convenient location to schools, shopping, and dining. A great opportunity for first-time buyers, downsizers, or investors.
Key facts
- Spacious yard
- Recent updates
- Ranch-style home
Tags
Property features AI
Exterior
- Parking: Carport (one space)
- Security: Smoke detector(s)
- Utilities: Public water; Public sewer; Electric service (standard)
- Home design: Single-story; Brick construction; Shingle roof; Slab foundation; Average condition
- Construction: Built with brick
- Exterior features: Porch; City lot; Rectangular lot
Interior
- Kitchen: Oven; Range
- Bathrooms: 1 full bathroom; 1 half bathroom
- Heating & cooling: Central heating; Central air; Attic fan
- Interior features: Attic; Ceiling fan(s); Pantry; Pull-down attic stairs
- Laundry & utility: Washer hookup; Dryer hookup
Neighborhood map
What this means for you Summary
Snapshot
- This is a 3-bed/1.5-bath single-family listed at $160k.
Deal economics
- At list price, monthly cash flow is $60 ($721/yr) — positive.
- The deal already cash-flows at list — no discount required.
- To meet the 1% rule (rent ≥ 1% of price), the offer needs to be $145k (9.2% below list).
- Recommended offer: $145k (9.2% below list) — sets the bar for 1% rule.
- Cap rate 7.7% vs local median 5.0% in Hammond — top-decile yield for the area; either an underpriced asset or a hidden risk that comps aren't pricing in. Stress-test before assuming the spread holds.
Location & tenants
- Location reads 69/100 on livability (#77 in LA) — a middle-class / working-renter tenant base. Strengths: cost of living A+, health & safety A+; Watch: amenities C-, commute D+, crime F.
- Tangipahoa Parish (rural): math 18% / reading 29% proficiency, ranked #63 of 98 in LA (top 64%) — low school quality limits family demand, transient renter base, plan for 1-2y turnover; 73% free/reduced lunch — lower-income household profile, screen leases tightly.
- Zoned schools: Hammond Westside Montessori (math 15% / reading 21%, grade F, #472 of 646 statewide, top 74%, 1,072 students, 73% FRL); Greenville Park Leadership Academy (math 8% / reading 12%, grade F, #199 of 218 statewide, top 92%, 447 students, 86% FRL); Hammond High Magnet School (math 19% / reading 28%, grade F, #167 of 265 statewide, top 63%, 1,750 students, 64% FRL) — zoned schools at 74% FRL track the district average.
- Market conditions: Rents flat; 328 active listings in the ZIP; 14 comparable units currently listed for rent nearby; rentals lingering (median 46d on market — plan ~5-8 weeks vacancy on turnover, expect pricing pressure); 100% of comp listings sitting > 30 days — soft ceiling on asking rent; 1,085 units permitted in Tangipahoa Parish in 2024 (378 in 5+ unit buildings).
- This rent runs 34% of the median local income ($51k/yr) — at the standard rent-burdened threshold; future hikes will face affordability resistance.
Forward outlook
- Local home prices are declining (-3.0%/yr); year-one equity from $1k of loan paydown is wiped out by about $5k of value loss. Plan a longer hold.
- Tangipahoa County population projected at +22% by 2050 — long-run rental-demand tailwind backs the buy-and-hold thesis.
Negotiation context
- It's been on market 17 days — a 2% lower offer ($158k) is reasonable based on typical stale-listing flexibility.
- 2 sale attempts with the ask held roughly flat each time — persistent listings suggest the price (not the market) is what's stuck; bring a comps-based counter.
Risks & watch-outs
- Watch-outs: flood insurance adds $125/mo.
- Climate carrying-cost: in FEMA flood zone A (mandatory federal flood insurance); severe wind risk, 99% chance of damaging wind over 30y; extreme-heat days projected 7→21/yr by 2055 (HVAC capex compounding) — expect insurance premiums to compound above CPI over the hold.
Questions for the listing agent
- Built in 1978 — when were the roof, HVAC, electrical panel, plumbing, and water heater last replaced?
- What's the actual annual flood-insurance premium (NFIP or private), and is the property in a SFHA with mandatory coverage?
- Is there a deadline driving the sale (1031 exchange, divorce, estate, relocation)? That informs how much negotiation room exists.
- Schools are D-rated, which usually means shorter tenancies and higher turnover. Who's the typical renter profile here, and what's been the actual vacancy rate?
- Crime grade is F in this area — have there been break-ins, vandalism, or insurance claims at this property in the last 3 years? What carrier currently insures it and at what premium?
- The area grade is low — what's the realistic commute time and amenity access for the typical tenant pool here? Any planned neighborhood developments (good or bad) we should know about?
- What's the average days-on-market for RENTAL listings here right now (not sales)? A rising rental-DOM trend means longer vacancies and softer asking-rent achievability than the comps imply.
- What's the recent tenant-quality profile in this submarket — average credit score on applications, eviction rate, late-payment / NSF rate, and stable-employment percentage? A property-management company in the area should have these aggregated.
- How much new for-sale + rental construction is in the pipeline within 1–3 miles? Heavy new supply typically softens prices + rents 12–24 months out; constrained supply supports both.
Investment metrics
- 1% rule
- 0.91% ✗
- Cap rate
- 7.68%
- Cash-on-cash
- 4.96%
- DSCR
- 1.22
- GRM
- 9.2
CMA / ARV
- ARV (on-the-fly)
- $76,510
- Comps found
- 2
Show comp detail 2 sales within ~0.75 mi
| Address | Dist | Beds/Ba | Sqft | Sold | Price | $/sf | Match |
|---|---|---|---|---|---|---|---|
| 99 White St | 0.50mi | 3/2.0 | 1,000 (-8%) | 9mo | $70,000 | $70 | 53 |
| 110 Wells Dr | 0.53mi | 3/2.0 | 1,237 (+13%) | 1mo | $70,000 | $57 | 51 |
Match score weights: distance 35% · size 25% · config 20% · recency 20%. Top-matched comps best support the ARV.
Projected returns pro-forma
-3.0% appreciation · 0.33% rent growth · sell at horizon
- IRR
- -16.7%
- Equity multiple
- 0.42×
- Total profit
- $-25,890
- Equity at exit
- $23,857
- IRR
- -14.2%
- Equity multiple
- 0.28×
- Total profit
- $-32,360
- Equity at exit
- $13,834
Cash invested: $44,800 (down + closing). Projections, not guarantees.
Landlord ↔ Tenant lean methodology
- Overall (STATE)
- 90 Strongly Landlord-Friendly
- State Louisiana
- 90 Strongly Landlord-Friendly · R+12
- County
- — inherits STATE
- City
- — inherits STATE
ZIP-level market 70403
- Home prices YoY
- -34.1%
- Rents YoY
- 0.3%
- Active inventory
- 328
- Price-to-rent
- 9.2×
Monthly cashflow live
- Estimated rent
- $1,453 high interval (Pro) →
- Mortgage (P&I)
- −$839
- Tax from tax record
- −$57 /mo · $682/yr
- Insurance
- −$67
- Flood insurance flood zone
- −$125 /mo · $1,502/yr
- HOA
- −$0
- Vacancy / Maint / Mgmt
- −$305
- Net cashflow
- $60
Break-even live
Sensitivity live
| Price | -10% $151 | -5% $105 | +0% $60 | +5% $15 | +10% $-30 |
|---|---|---|---|---|---|
| Rent | -10% $-55 | -5% $3 | +0% $60 | +5% $118 | +10% $175 |
| Rate | -1.0pp $141 | -0.5pp $101 | base $60 | +0.5pp $19 | +1.0pp $-24 |
UW: 25.0% down · 7.5% · 30yr · 1.5% tax · 5.0% vac · 8.0% maint · 8.0% mgmt
Financing live
Cash to close
- Down payment
- $40,000
- Closing costs
- $4,800
- Reserves months
- —
- Total cash needed
- —
Loan-product check · same deal, 3 products live
Conventional
25% down · 7.5% · 30yr
- Down + closing
- —
- Monthly P&I
- —
- Monthly cashflow
- —
- DSCR
- —
- Eligible?
- —
Personal DTI + credit; lowest rate.
DSCR
20% down · 8.5% · 30yr
- Down + closing
- —
- Monthly P&I
- —
- Monthly cashflow
- —
- DSCR
- —
- Eligible?
- —
No personal income docs; deal must DSCR.
Hard money
10% down · 12.0% · 12mo
- Down + closing
- —
- Monthly P&I
- —
- Monthly cashflow
- —
- DSCR
- —
- Eligible?
- —
Short-term bridge; refi at stabilization.
Rent comps 14 comps
| Address | Beds | Baths | Sqft | Rent | $/sqft | DOM | Units | Dist |
|---|---|---|---|---|---|---|---|---|
| 1600 Bauerle Rd Hammond, LA | 1.0–2.0 | 1.0–2.0 | 884 | $1,751 | $1.98 | 45d | 4 | 0.63mi |
| 1002 S Pine St Hammond, LA | 3.0 | 2.5 | 1324 | $1,500 | $1.13 | 45d | 1 | 0.72mi |
| 207 S Laurel St Unit B Hammond, LA | 3.0 | 2.0 | 1100 | $1,350 | $1.23 | 45d | 1 | 0.73mi |
| 309 Hewitt Rd Unit B Hammond, LA | 2.0 | 1.0 | 806 | $1,350 | $1.67 | 45d | 1 | 0.76mi |
| 204 W Clark St Hammond, LA | 2.0 | 1.0 | 840 | $900 | $1.07 | 45d | 1 | 0.91mi |
| 209 Dixie Dr Hammond, LA | 3.0 | 1.0 | 1100 | $1,150 | $1.05 | 45d | 1 | 0.97mi |
| 221 W Thomas St Unit A Hammond, LA | 3.0 | 1.0 | 1400 | $2,050 | $1.46 | 45d | 1 | 1.09mi |
| 2617 Rue Saint Martin Hammond, LA | 2.0 | 1.5 | 1399 | $1,000 | $0.71 | 45d | 1 | 1.11mi |
| 402 S Cherry St Hammond, LA | 3.0 | 2.0 | 1400 | $1,700 | $1.21 | 45d | 1 | 1.19mi |
| 606 Rue Saint Martin Unit B Hammond, LA | 2.0 | 1.5 | 1100 | $900 | $0.82 | 45d | 1 | 1.21mi |
| 100 S Cypress St Hammond, LA | 2.0 | 2.5 | 1100 | $1,750 | $1.59 | 45d | 1 | 1.27mi |
| 16218 E Minnesota Park Rd Unit 3B Hammond, LA | 2.0 | 2.5 | 1095 | $1,450 | $1.32 | 45d | 1 | 1.46mi |
| 42114 Gardens Blvd Unit B Hammond, LA | 2.0 | 2.0 | 1343 | $1,450 | $1.08 | 45d | 1 | 1.46mi |
| 308 Alexander Dr Hammond, LA | 3.0 | 2.0 | 1193 | $1,390 | $1.17 | 45d | 1 | 1.46mi |
Listing history 14 events
-
2026-06-21days on market $160,000 Active 17 DOM
-
2026-06-19days on market $160,000 Active 15 DOM
-
2026-06-18days on market $160,000 Active 14 DOM
-
2026-06-17days on market $160,000 Active 13 DOM
-
2026-06-16days on market $160,000 Active 12 DOM
-
2026-06-15days on market $160,000 Active 11 DOM
-
2026-06-14days on market $160,000 Active 9 DOM
-
2026-06-13days on market $160,000 Active 8 DOM
-
2026-06-10days on market $160,000 Active 6 DOM
-
2026-06-09days on market $160,000 Active 5 DOM
-
2026-06-08days on market $160,000 Active 4 DOM
-
2026-06-07days on market $160,000 Active 3 DOM
-
2026-06-05remarks 316-char remark
-
2026-06-05$160,000 Active 1 DOM
ⓘ Source: listings_history table (triggers on properties + properties_extension) + one-shot
backfill from property_details.listing_events for pre-trigger history.
Tax reassessment forecast LA · Resets to sale price
- Current annual tax
- $682 · $57/mo
- Projected year-2 tax
- $880 · $73/mo
- Expected delta
- +$198/yr (+$17/mo · 29.1%)
ⓘ Screening estimate from a state-policy table — verify with the county assessor before closing.
Climate risk First Street
- Flood 7/10 Severe FEMA zone A · 96% chance over 30 yrs
- Wildfire 3/10 Moderate
- Heat 8/10 Severe 7 d/yr ≥109°F today · 21 d/yr by 30 yrs out
- Wind 9/10 Extreme 99% chance of damaging wind over 30 yrs
- Air quality 2/10 Low 0 unhealthy d/yr today · 1 by 30 yrs out
Nearby sold comps map
Loading sold comps map…
Walkable amenities ~0.75 mi
Loading nearby amenities…
Taxation est. · year 1
- Rental income
- $17,436
- − Mortgage interest
- −$8,962
- − Property taxes
- −$682
- − Insurance
- −$2,302
- − Repairs & maintenance
- −$1,395
- − Management
- −$1,395
- − Depreciation
- −$4,655
- Taxable loss
- −$1,955
- Est. tax savings @ 24.0%
- +$469
- After-tax cash flow
- $1,191/yr
For passive investors: Depreciation is non-cash, so a rental often shows a tax loss while cash-flowing — sheltering income. Rental losses are passive: they offset passive income freely, and up to $25,000/yr can offset ordinary (W-2) income if you actively participate and your MAGI is under $100k (phasing out to $0 by $150k); unused losses carry forward. On sale, claimed depreciation is recaptured at up to 25%, and gains may owe capital-gains tax (a 1031 exchange can defer both). Figures are a year-1 estimate at your 24.0% rate — not tax advice; consult a CPA.
Schools (NCES district)
- District
- Tangipahoa Parish
- NCES district ID
- 2201680
- Math proficiency
- 18% ▼ -32.00%
- Reading proficiency
- 29% ▼ -31.00%
- Median HH income
- $41,283
- Composite
- 19.94/100
- National rank
- #8676
- State rank
- #63 of 98 in LA
Livability — Hammond
- Score
- 69/100
- State rank
- #77
- US rank
- #8868
Category grades
Schools grade is shown separately in the Schools card above.
Census & demographics
- Census place
- Hammond, LA
- County
- Tangipahoa Parish · 85,958 people
- City population
- 51,394
- Metro
- Hammond, LA
- Population (ZIP)
- 30,173
- Household income
- $50,976
- Rent vs Own
- Severe rent burden
- 1201.0
Population outlook (Tangipahoa County) Hauer SSP2
- Today (2025)
- 144,204 people
- By 2030
- 151,413 · +5.0%
- By 2040
- 164,374 · +14.0%
- By 2050
- 175,427 · +21.7%
- By 2075
- 195,165 · +35.3%
- By 2100
- 201,641 · +39.8%
Race, ethnicity, and origin ACS 2023
- Neighborhood character
- Diverse neighborhood (Simpson 0.56)
- Race & ethnicity
- White 55% Black 37% Hispanic / Latino 6% Two or more races 6%
- Hispanic origin (detail)
- Mexican 3%
- Common ancestry
- Lithuanian 9% Serbian 1% Slovak 1%
- Foreign-born
- 3% · Canada
- Languages at home
- 95% English-only · Spanish 4% Arabic 1%
Political lean MEDSL · Tangipahoa
- 2024 margin
- Solid R (+37.4) · D 30.6% · R 68.0% · Other 1.3%
- 2008→2024 swing
- -6.5pp toward R · 2008: -30.9pp · 2024: -37.4pp
- All cycles
- 2024: R+37.4 2020: R+32.8 2016: R+32.6 2012: R+27.7 2008: R+30.9
Not yet ingested
- Civics
- —
Market trends
- HPI YoY
- ▼ -66.04%
- Current HPI
- 127.4535
- Rent YoY
- ▲ 0.33%
- Metro
- Hammond, LA
- State GDP YoY
- ▲ 3.29%
- F500 in state
- 10
Industry mix (Fortune 500 HQ in LA)
| Industry | F500 HQs | Revenue |
|---|---|---|
| Telecommunications | 2 | $23B |
|
||
| Utilities | 1 | $12B |
|
||
| Wholesale / Distribution | 1 | $5B |
|
||
| Advertising | 1 | $2B |
|
||
Price history
+0.0% since first listed2 events — show timeline
- 2026-06-04 Listed $160,000 AcadianaMLS
- 2026-06-04 Listed $160,000 GSREIN
Property tax history
+6.2%/yrLatest (2025): $682 · +0.5% YoY. Source: county tax records.
Cash-flow waterfall
monthlySold comps — $/sqft
last 12 mo · ≤1 miLoading sold comps…