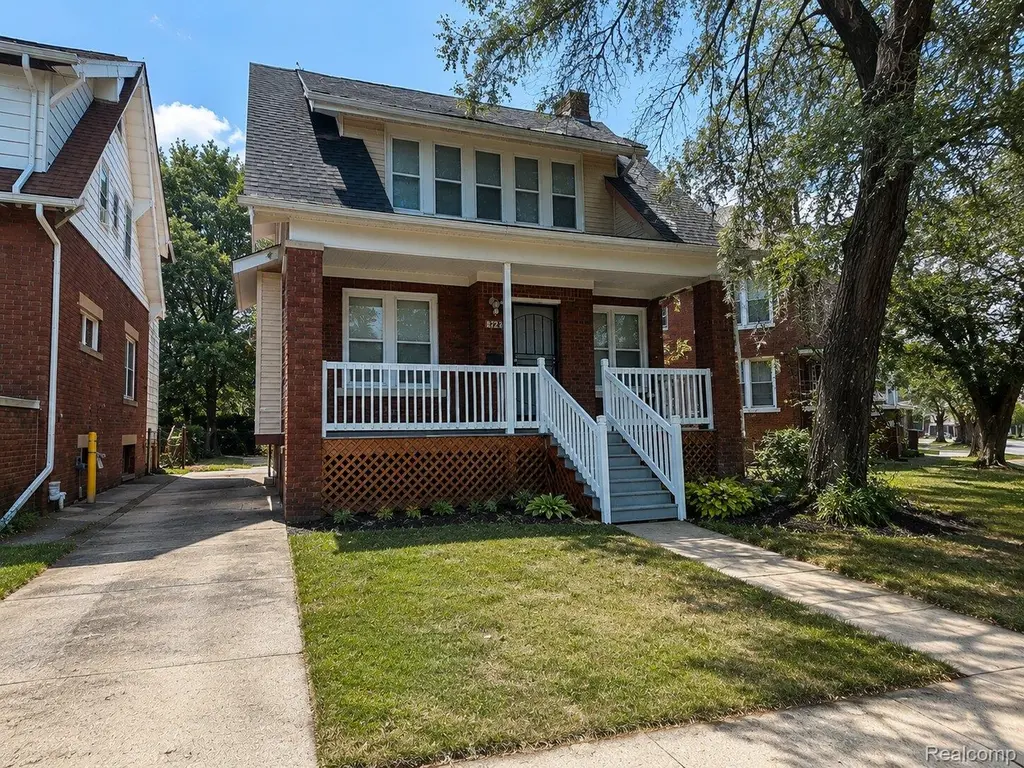
8821 Arcadia St · Detroit, MI
Flood risk 1/10 · Minimal
- FEMA flood zone
- X (unshaded)
- Chance of flooding over 30 yrs
- 0.0%
- Est. flood insurance / yr
- $507 – $1,088
Fire risk 1/10 · Minimal
- Est. fire insurance / yr
- $784 – $1,456
Heat risk 3/10 · Minor
- Hot days now (above 97°F)
- 7 days/yr
- Hot days in 30 yrs
- 15 days/yr
Wind risk 2/10 · Minimal
- Chance of severe wind over 30 yrs
- —
Air-quality risk 4/10 · Minor
- Unhealthy air days now
- 4 days/yr
- Unhealthy air days in 30 yrs
- 6 days/yr
Risk factors via First Street. Map © Google.
Why this score? — see what drove the B- grade
The composite is a weighted blend of 9 inputs, each scored 0–100. Each bar is that input's sub-score; the figure is the points it added to the 100-point composite (weight × sub-score).
- Cash flow +26.5/30.0
- Appreciation +10.0/10.0
- DSCR +9.1/10.0
- ARV discount +7.5/15.0
- 1% rule +6.3/10.0
- Livability +3.7/5.0
- Rent growth +2.5/5.0
- Condition / age +2.5/5.0
- Schools +1.3/10.0
$110,000
🖨 Deal sheet (PDF) 📄 Offer letter ✓ Due diligence
Listing remarks MLS
Coming Soon!
Key facts
- 3,920 sq ft lot
- Built 1915
- Listed 17 days
Property features AI
Exterior
- Parking: No garage
- Utilities: Public water; Public sewer; Water and sewer available
- Home design: Single-family residence; Two levels; Ground-level entry with steps
- Construction: Brick and vinyl siding exterior; Brick/mortar foundation; Built area above grade: 1,114 square feet
- Exterior features: Paved private road access (private road maintained by owner)
Interior
- Bathrooms: One full bathroom
- Heating & cooling: Forced air heating (natural gas); No central cooling
- Interior features: Unfinished basement; Three total rooms
Neighborhood map
What this means for you Summary
Snapshot
- This is a 3-bed/1.0-bath single-family listed at $110k.
Deal economics
- At list price, monthly cash flow is $292 ($4k/yr) — positive.
- The deal already cash-flows at list — no discount required.
- Meets the 1% rule at list price ($1k rent vs $110k).
- Recommended offer: $108k (1.5% below list) — sets the bar for market timing.
Location & tenants
- Location reads 73/100 on livability (#218 in MI) — a middle-class / working-renter tenant base. Strengths: amenities A+, commute A+, cost of living A+; Watch: schools F, crime F, employment F.
- Detroit Public Schools Community District (urban): math 10% / reading 24% proficiency, ranked #499 of 540 in MI (top 92%) — low school quality limits family demand, transient renter base, plan for 1-2y turnover; 90% free/reduced lunch — lower-income household profile, screen leases tightly.
- Market conditions: 244 active listings in the ZIP; 40 comparable units currently listed for rent nearby; rentals at typical pace (median 25d on market — plan ~3-4 weeks tenant-placement turnaround); 45% of comp listings sitting > 30 days — soft ceiling on asking rent; lower-income renter base — watch delinquency; 2,639 units permitted in Wayne County in 2024 (1,216 in 5+ unit buildings).
- This rent runs 43% of the median local income ($34k/yr) — at the standard rent-burdened threshold; future hikes will face affordability resistance.
Forward outlook
- In year one you build about $12k of equity ($761 loan paydown + $11k appreciation (10.0% local appreciation)).
- Wayne County population projected at -17% by 2050 — secular population decline; favor cash flow + early exit over multi-decade hold.
- At projected returns (10.0% appreciation + 3.0% rent growth), your $31k cash investment doubles in ~2 years — after that, you're playing with house money.
- By year 4, paydown + projected appreciation supports a ~$42k cash-out refi (75% LTV) — recoverable capital for the next deal without selling this one.
Negotiation context
- It's been on market 17 days — a 2% lower offer ($108k) is reasonable based on typical stale-listing flexibility.
- 6 sale attempts since 10y ago with the ask held roughly flat each time — persistent listings suggest the price (not the market) is what's stuck; bring a comps-based counter.
- Current owner paid $90k; 22% above their basis — modest negotiation headroom, anchor on the comps not their cost.
Risks & watch-outs
- Watch-outs: built in 1915 — expect roof / HVAC / electrical / plumbing capex.
Questions for the listing agent
- Built in 1915 — when were the roof, HVAC, electrical panel, plumbing, and water heater last replaced?
- Is there a deadline driving the sale (1031 exchange, divorce, estate, relocation)? That informs how much negotiation room exists.
- Schools are F-rated, which usually means shorter tenancies and higher turnover. Who's the typical renter profile here, and what's been the actual vacancy rate?
- Crime grade is F in this area — have there been break-ins, vandalism, or insurance claims at this property in the last 3 years? What carrier currently insures it and at what premium?
- What's the average days-on-market for RENTAL listings here right now (not sales)? A rising rental-DOM trend means longer vacancies and softer asking-rent achievability than the comps imply.
- What's the recent tenant-quality profile in this submarket — average credit score on applications, eviction rate, late-payment / NSF rate, and stable-employment percentage? A property-management company in the area should have these aggregated.
- How much new for-sale + rental construction is in the pipeline within 1–3 miles? Heavy new supply typically softens prices + rents 12–24 months out; constrained supply supports both.
Investment metrics
- 1% rule
- 1.13% ✓
- Cap rate
- 9.48%
- Cash-on-cash
- 11.37%
- DSCR
- 1.51
- GRM
- 7.4
CMA / ARV
- ARV (on-the-fly)
- $63,498
- Comps found
- 12
Show comp detail 12 sales within ~0.75 mi
| Address | Dist | Beds/Ba | Sqft | Sold | Price | $/sf | Match |
|---|---|---|---|---|---|---|---|
| 9329 Petoskey Ave | 0.38mi | 3/1.0 | 1,097 (-2%) | 7mo | $16,000 | $15 | 74 |
| 9419 Ravenswood St | 0.44mi | 3/1.0 | 1,144 (+3%) | 7mo | $67,500 | $59 | 69 |
| 8792 Mackinaw St | 0.04mi | 2/1.0 (-1) | 1,005 (-10%) | 16mo | $15,000 | $15 | 64 |
| 5230 Maplewood St | 0.40mi | 3/1.5 | 1,248 (+12%) | 8mo | $25,000 | $20 | 53 |
| 4010 Hazelwood St | 0.30mi | 2/2.0 (-1) | 1,206 (+8%) | 14mo | $80,500 | $67 | 52 |
| 4010 HAZELWOOD St | 0.30mi | 2/2.0 (-1) | 1,206 (+8%) | 14mo | $80,500 | $67 | 51 |
| 5362 Allendale St | 0.74mi | 3/1.0 | 1,200 (+8%) | 2mo | $70,000 | $58 | 51 |
| 5327 Vancouver St | 0.60mi | 3/1.0 | 1,274 (+14%) | 5mo | $40,000 | $31 | 44 |
| 9715 Yosemite St | 0.58mi | 2/1.0 (-1) | 1,000 (-10%) | 11mo | $57,000 | $57 | 41 |
| 3286 Columbus St | 0.71mi | 3/1.0 | 1,272 (+14%) | 6mo | $13,600 | $11 | 38 |
| 4288 Larchmont St | 0.73mi | 3/1.5 | 1,248 (+12%) | 10mo | $55,000 | $44 | 36 |
| 5325 Allendale St | 0.74mi | 3/3.0 | 1,008 (-10%) | 12mo | $125,000 | $124 | 31 |
Match score weights: distance 35% · size 25% · config 20% · recency 20%. Top-matched comps best support the ARV.
Projected returns pro-forma
10.0% appreciation · 3.0% rent growth · sell at horizon
- IRR
- 32.6%
- Equity multiple
- 3.55×
- Total profit
- $78,476
- Equity at exit
- $99,097
- IRR
- 28.1%
- Equity multiple
- 8.03×
- Total profit
- $216,436
- Equity at exit
- $213,706
Cash invested: $30,800 (down + closing). Projections, not guarantees.
Landlord ↔ Tenant lean methodology
- Overall (STATE)
- 62 Landlord-Friendly
- State Michigan
- 62 Landlord-Friendly · EVEN
- County
- — inherits STATE
- City
- — inherits STATE
ZIP-level market 48204
- Home prices YoY
- 18.5%
- Active inventory
- 244
- Price-to-rent
- 7.4×
Monthly cashflow live
- Estimated rent
- $1,247 high interval (Pro) →
- Mortgage (P&I)
- −$577
- Tax from tax record
- −$70 /mo · $843/yr
- Insurance
- −$46
- HOA
- −$0
- Vacancy / Maint / Mgmt
- −$262
- Net cashflow
- $292
Break-even live
Sensitivity live
| Price | -10% $354 | -5% $323 | +0% $292 | +5% $261 | +10% $230 |
|---|---|---|---|---|---|
| Rent | -10% $193 | -5% $243 | +0% $292 | +5% $341 | +10% $390 |
| Rate | -1.0pp $347 | -0.5pp $320 | base $292 | +0.5pp $263 | +1.0pp $234 |
UW: 25.0% down · 7.5% · 30yr · 1.5% tax · 5.0% vac · 8.0% maint · 8.0% mgmt
Financing live
Cash to close
- Down payment
- $27,500
- Closing costs
- $3,300
- Reserves months
- —
- Total cash needed
- —
Loan-product check · same deal, 3 products live
Conventional
25% down · 7.5% · 30yr
- Down + closing
- —
- Monthly P&I
- —
- Monthly cashflow
- —
- DSCR
- —
- Eligible?
- —
Personal DTI + credit; lowest rate.
DSCR
20% down · 8.5% · 30yr
- Down + closing
- —
- Monthly P&I
- —
- Monthly cashflow
- —
- DSCR
- —
- Eligible?
- —
No personal income docs; deal must DSCR.
Hard money
10% down · 12.0% · 12mo
- Down + closing
- —
- Monthly P&I
- —
- Monthly cashflow
- —
- DSCR
- —
- Eligible?
- —
Short-term bridge; refi at stabilization.
Rent comps 40 comps
| Address | Beds | Baths | Sqft | Rent | $/sqft | DOM | Units | Dist |
|---|---|---|---|---|---|---|---|---|
| 4915 Maplewood St Detroit, MI | 3.0 | 1.0 | 1324 | $1,100 | $0.83 | 17d | 1 | 0.23mi |
| 4345 W Euclid St Unit 2 Detroit, MI | 3.0 | 1.0 | 1300 | $1,450 | $1.12 | 25d | 1 | 0.28mi |
| 4345 W Euclid St Unit 1 Detroit, MI | 3.0 | 1.0 | 1300 | $1,400 | $1.08 | 25d | 1 | 0.28mi |
| 3786 Carter St Unit 2 Detroit, MI | 3.0 | 1.0 | 1400 | $1,100 | $0.79 | 25d | 1 | 0.35mi |
| 3757 Blaine St Detroit, MI | 3.0 | 1.0 | 1169 | $1,480 | $1.27 | 17d | 1 | 0.38mi |
| 9376 Otsego St Detroit, MI | 3.0 | 1.0 | 873 | $1,396 | $1.60 | 44d | 1 | 0.45mi |
| 3759 Atkinson St Unit 2 Detroit, MI | 2.0 | 1.0 | 919 | $1,200 | $1.31 | 25d | 1 | 0.47mi |
| 5101 Oregon St Detroit, MI | 2.0 | 1.0 | 1000 | $1,049 | $1.05 | 44d | 1 | 0.53mi |
| 3259 W Philadelphia St Detroit, MI | 3.0 | 1.0 | 1293 | $1,400 | $1.08 | 17d | 1 | 0.58mi |
| 3220 Gladstone St Detroit, MI | 3.0 | 1.0 | 1248 | $1,200 | $0.96 | 44d | 1 | 0.60mi |
| 4016 Hogarth St Unit 4018 Hogarth Lower Detroit, MI | 2.0 | 1.0 | 1200 | $1,100 | $0.92 | 4d | 1 | 0.61mi |
| 4566 Seebaldt St Detroit, MI | 2.0 | 1.0 | 1200 | $1,250 | $1.04 | 22d | 1 | 0.62mi |
| 3422 Edison St Detroit, MI | 3.0 | 1.0 | 1300 | $1,295 | $1.00 | 17d | 1 | 0.66mi |
| 8762 Epworth St Unit 8768 Detroit, MI | 2.0 | 1.0 | 900 | $1,000 | $1.11 | 25d | 1 | 0.67mi |
| 9789 Chenlot St Unit 1 Detroit, MI | 2.0 | 1.0 | 1000 | $1,000 | $1.00 | 5d | 1 | 0.72mi |
| 5398 Allendale St Detroit, MI | 2.0 | 1.0 | 1100 | $1,200 | $1.09 | 24d | 1 | 0.73mi |
| 3295 Rochester St Unit 2 Detroit, MI | 2.0 | 1.0 | 782 | $850 | $1.09 | 44d | 1 | 0.77mi |
| 3295 Rochester St Unit 2 Detroit, MI | 2.0 | 1.0 | 800 | $1,000 | $1.25 | 5d | 1 | 0.77mi |
| 9917 Woodside St Apt 1 Detroit, MI | 2.0 | 1.0 | 800 | $800 | $1.00 | 44d | 1 | 0.87mi |
| 3266 Calvert Ave Fl 2 Detroit, MI | 3.0 | 1.0 | 1279 | $1,300 | $1.02 | 25d | 1 | 0.93mi |
| 3226 Calvert Ave Detroit, MI | 3.0 | 1.0 | 1100 | $1,200 | $1.09 | 13d | 1 | 0.96mi |
| 3224 Calvert St Detroit, MI | 3.0 | 1.0 | 1150 | $1,150 | $1.00 | 44d | 1 | 0.96mi |
| 2531 Pingree St Unit 2 (FL 2) Detroit, MI | 3.0 | 1.0 | 893 | $1,100 | $1.23 | 2d | 1 | 0.99mi |
| 6307 Woodrow St Detroit, MI | 2.0 | 1.0 | 1000 | $750 | $0.75 | 44d | 1 | 1.00mi |
| 11704 Broadstreet Ave Detroit, MI | 3.0 | 1.0 | 1200 | $1,050 | $0.88 | 44d | 1 | 1.02mi |
| 5440 Milford St Unit 1 Detroit, MI | 2.0 | 1.0 | 850 | $1,150 | $1.35 | 44d | 1 | 1.02mi |
| 2506 W Euclid St Detroit, MI | 3.0 | 1.0 | 1475 | $1,675 | $1.14 | 44d | 1 | 1.03mi |
| 2504 W Euclid St Unit 2504 Detroit, MI | 3.0 | 1.0 | 1475 | $1,650 | $1.12 | 44d | 1 | 1.03mi |
| 2504 W Euclid St Unit 2506 Detroit, MI | 3.0 | 1.0 | 1475 | $1,675 | $1.14 | 44d | 1 | 1.03mi |
| 2925 Calvert St Detroit, MI | 3.0 | 1.0 | 1400 | $1,300 | $0.93 | 17d | 1 | 1.05mi |
| 2463 Taylor St Detroit, MI | 3.0 | 1.0 | 1350 | $1,100 | $0.81 | 44d | 1 | 1.05mi |
| 2727 Calvert Ave Unit 1 Detroit, MI | 3.0 | 1.5 | 1350 | $1,200 | $0.89 | 44d | 1 | 1.09mi |
| 2653 Calvert Ave Unit 1 Detroit, MI | 3.0 | 1.0 | 1305 | $1,200 | $0.92 | 44d | 1 | 1.15mi |
| 2254 Taylor St Unit Taylor St unit Detroit, MI | 3.0 | 1.0 | 1307 | $1,550 | $1.19 | 4d | 1 | 1.22mi |
| 12019 Stoepel St Detroit, MI | 2.0 | 1.0 | 1000 | $943 | $0.94 | 5d | 1 | 1.24mi |
| 2634 Lawrence St Detroit, MI | 3.0 | 1.5 | 1388 | $1,600 | $1.15 | 2d | 1 | 1.26mi |
| 12032 Santa Rosa Dr Unit 1 Detroit, MI | 3.0 | 1.0 | 900 | $1,423 | $1.58 | 5d | 1 | 1.27mi |
| 4426 McGraw Ave Unit 1 Detroit, MI | 3.0 | 1.0 | 1400 | $1,200 | $0.86 | 44d | 1 | 1.30mi |
| 4268 Cortland St Unit 1 Detroit, MI | 2.0 | 1.0 | 1000 | $1,050 | $1.05 | 44d | 1 | 1.31mi |
| 2021 Blaine St Detroit, MI | 1.0–2.0 | 1.0 | 684 | $1,200 | $1.75 | 44d | 1 | 1.32mi |
Listing history 12 events
-
2026-06-18days on market $110,000 Active 17 DOM
-
2026-06-17days on market $110,000 Active 16 DOM
-
2026-06-15days on market $110,000 Active 14 DOM
-
2026-06-13days on market $110,000 Active 12 DOM
-
2026-06-13days on market $110,000 Active 11 DOM
-
2026-06-09days on market $110,000 Active 8 DOM
-
2026-06-08days on market $110,000 Active 7 DOM
-
2026-06-07days on market $110,000 Active 6 DOM
-
2026-06-04days on market $110,000 Active 3 DOM
-
2026-06-03days on market $110,000 Active 2 DOM
-
2026-06-02remarks 12-char remark
-
2026-06-02$110,000 Active 1 DOM
ⓘ Source: listings_history table (triggers on properties + properties_extension) + one-shot
backfill from property_details.listing_events for pre-trigger history.
Tax reassessment forecast MI · Partial reset (capped growth)
- Current annual tax
- $843 · $70/mo
- Projected year-2 tax
- $1,269 · $106/mo
- Expected delta
- +$425/yr (+$35/mo · 50.4%)
ⓘ Screening estimate from a state-policy table — verify with the county assessor before closing.
Climate risk First Street
- Flood 1/10 Low FEMA zone X (unshaded) · 0% chance over 30 yrs
- Wildfire 1/10 Low
- Heat 3/10 Moderate 7 d/yr ≥97°F today · 15 d/yr by 30 yrs out
- Wind 2/10 Low
- Air quality 4/10 Moderate 4 unhealthy d/yr today · 6 by 30 yrs out
Nearby sold comps map
Loading sold comps map…
Walkable amenities ~0.75 mi
Loading nearby amenities…
Taxation est. · year 1
- Rental income
- $14,960
- − Mortgage interest
- −$6,162
- − Property taxes
- −$843
- − Insurance
- −$550
- − Repairs & maintenance
- −$1,197
- − Management
- −$1,197
- − Depreciation
- −$3,200
- Taxable income
- $1,811
- Est. tax owed @ 24.0%
- −$435
- After-tax cash flow
- $3,068/yr
For passive investors: Depreciation is non-cash, so a rental often shows a tax loss while cash-flowing — sheltering income. Rental losses are passive: they offset passive income freely, and up to $25,000/yr can offset ordinary (W-2) income if you actively participate and your MAGI is under $100k (phasing out to $0 by $150k); unused losses carry forward. On sale, claimed depreciation is recaptured at up to 25%, and gains may owe capital-gains tax (a 1031 exchange can defer both). Figures are a year-1 estimate at your 24.0% rate — not tax advice; consult a CPA.
Schools (NCES district)
- District
- Detroit Public Schools Community District
- NCES district ID
- 2601103
- Math proficiency
- 10% ▼ -2.00%
- Reading proficiency
- 24% ▲ 6.00%
- Median HH income
- $25,815
- Composite
- 13.06/100
- National rank
- #9564
- State rank
- #499 of 540 in MI
Livability — Detroit
- Score
- 73/100
- State rank
- #218
- US rank
- #5427
Category grades
Schools grade is shown separately in the Schools card above.
Census & demographics
- Census place
- Detroit, MI
- County
- Wayne County · 1,562,939 people
- City population
- 572,865
- Metro
- Detroit-Warren-Dearborn, MI
- Population (ZIP)
- 20,696
- Household income
- $34,468
- Rent vs Own
- Severe rent burden
- 1418.0
Population outlook (Wayne County) Hauer SSP2
- Today (2025)
- 1,675,273 people
- By 2030
- 1,620,300 · -3.3%
- By 2040
- 1,502,341 · -10.3%
- By 2050
- 1,384,039 · -17.4%
- By 2075
- 1,124,592 · -32.9%
- By 2100
- 881,193 · -47.4%
Race, ethnicity, and origin ACS 2023
- Neighborhood character
- Predominantly Black (86%)
- Race & ethnicity
- Black 86% Two or more races 7% Hispanic / Latino 5% White 4% Native American 2%
- Hispanic origin (detail)
- Mexican 4%
- Common ancestry
- Hispanic 1% Romanian 1%
- Foreign-born
- 2% · Canada
- Languages at home
- 95% English-only · Spanish 4%
Political lean MEDSL · Wayne
- 2024 margin
- Strong D (+29.0) · D 62.7% · R 33.7% · Other 3.6%
- 2008→2024 swing
- -20.5pp toward R · 2008: 49.5pp · 2024: 29.0pp
- All cycles
- 2024: D+29.0 2020: D+38.1 2016: D+37.3 2012: D+46.9 2008: D+49.5
Not yet ingested
- Civics
- —
Market trends
- HPI YoY
- ▲ 36.51%
- Current HPI
- 234.0465
- Rent YoY
- —
- Metro
- Detroit-Warren-Dearborn, MI
- State GDP YoY
- ▲ 1.37%
- F500 in state
- 28
Industry mix (Fortune 500 HQ in MI)
| Industry | F500 HQs | Revenue |
|---|---|---|
| Automotive Parts | 3 | $48B |
|
||
| Automotive | 2 | $372B |
|
||
| Chemicals | 1 | $45B |
|
||
| Automotive Retail | 1 | $29B |
|
||
| Healthcare / Medical Devices | 1 | $23B |
|
||
| Automotive Technology | 1 | $20B |
|
||
Price history
+5400.0% since first listed13 events — show timeline
- 2026-06-01 Listed $110,000 REALCOMP
- 2026-06-01 Listed $110,000 MiRealSource-MiMLS
- 2024-02-29 Listing Removed — MiRealSource-MiMLS
- 2024-02-29 Listing Removed — REALCOMP
- 2024-01-11 Listed $89,900 MiRealSource-MiMLS
- 2024-01-11 Listed $89,900 REALCOMP
- 2022-04-18 Sold (Public Records) $89,900 Public Records
- 2016-03-10 Sold (MLS) $2,000 MiRealSource-MiMLS
- 2016-03-10 Sold (MLS) $2,000 REALCOMP
- 2016-02-11 Pending — REALCOMP
- 2016-02-11 Listing Removed — MiRealSource-MiMLS
- 2016-01-30 Listed $2,000 REALCOMP
- 2016-01-30 Listed $2,000 MiRealSource-MiMLS
Property tax history
-2.2%/yrLatest (2025): $843 · -7.5% YoY. Source: county tax records.
Cash-flow waterfall
monthlySold comps — $/sqft
last 12 mo · ≤1 miLoading sold comps…