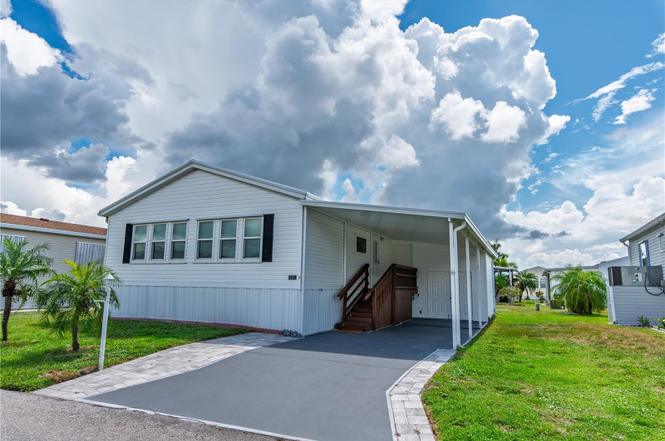
21 Brink Ave · Charlotte Park, FL
Flood risk 10/10 · Severe
- FEMA flood zone
- AE
- Chance of flooding over 30 yrs
- 0.99%
- Est. flood insurance / yr
- $1,737 – $8,500
Fire risk 4/10 · Minor
- Est. fire insurance / yr
- $947 – $1,759
Heat risk 10/10 · Severe
- Hot days now (above 107°F)
- 7 days/yr
- Hot days in 30 yrs
- 29 days/yr
Wind risk 10/10 · Severe
- Chance of severe wind over 30 yrs
- 99.0%
Air-quality risk 3/10 · Minor
- Unhealthy air days now
- 2 days/yr
- Unhealthy air days in 30 yrs
- 2 days/yr
Risk factors via First Street. Map © Google.
Why this score? — see what drove the C- grade
The composite is a weighted blend of 9 inputs, each scored 0–100. Each bar is that input's sub-score; the figure is the points it added to the 100-point composite (weight × sub-score).
- Cash flow +23.1/30.0
- DSCR +7.4/10.0
- 1% rule +7.3/10.0
- Schools +4.6/10.0
- Livability +3.3/5.0
- Rent growth +2.5/5.0
- Condition / age +2.5/5.0
- ARV discount +0.0/15.0
- Appreciation +0.0/10.0
$190,000
🖨 Deal sheet 📄 Offer letter ✓ Due diligence
Listing remarks
This beautifully maintained 2005 ScotBilt home offers 1,080 square feet of comfortable living in the sought-after Windmill Village 55+ community. The open-concept floor plan features a spacious kitchen with wood cabinets, generous counter space, a large pantry, and stainless steel appliances, flowing seamlessly into the living and dining combination. Crown molding and drywall throughout add a polished touch, while luxury vinyl plank flooring runs through most of the home (with vinyl in the second bath). The ample primary bedroom includes two closets and a private bath with a walk-in shower (no tub). The second bedroom offers a built-in closet and plenty of storage. Additional conveniences i
Key facts
- Private bath
- Spacious kitchen
- Large pantry
Tags
Property features AI
Finance
- Other: Partially furnished; Association contact: Liz Dewar
- Financial info: Total annual fees: $3,180; Lease restrictions apply
- HOA & community: Monthly HOA fee of $265 (includes pool, water, sewer, trash, management, maintenance of grounds, escrow reserves fund); Association approval required; Community amenities: clubhouse, pool, pickleball and shuffleboard courts; Senior community with buyer approval required; Pets allowed with restrictions (cats and dogs OK, breed/number/weight limits apply — max weight 40 lbs)
Exterior
- Parking: Ground level parking; Carport with 2 spaces
- Utilities: Public water; Public sewer; Electricity connected; Cable available
- Home design: Manufactured home (double wide); One story; Facing west; Completed condition
- Construction: Vinyl siding; Membrane roof; Crawlspace foundation; Built on a 0.11-acre lot
- Exterior features: Storage; Paved road access; Canal and creek water access; Private boat ramp
Interior
- Kitchen: Dishwasher; Range; Refrigerator
- Bedrooms: 2 bedrooms
- Bathrooms: 2 full bathrooms
- Heating & cooling: Central heating; Central air conditioning
- Interior features: Ceiling fans; Crown molding; Open floorplan with living/dining combo; Solid wood cabinets; Window treatments (blinds)
- Laundry & utility: Washer; Dryer; Laundry closet
Neighborhood map
What this means for you Summary
Snapshot
- This is a 2-bed/2.0-bath manufactured listed at $190k.
Deal economics
- At list price, monthly cash flow is $-85 ($-1k/yr) — negative.
- To cash-flow at today's rent, offer at most $175k (7.9% below list).
- Meets the 1% rule at list price ($2k rent vs $190k).
- Recommended offer: $175k (7.9% below list) — sets the bar for cash-flow.
- Cap rate 8.5% vs local median 4.3% in Charlotte Park — top-decile yield for the area; either an underpriced asset or a hidden risk that comps aren't pricing in. Stress-test before assuming the spread holds.
Location & tenants
- Location reads 66/100 on livability (#624 in FL) — a middle-class / working-renter tenant base. Strengths: crime A+, cost of living A+, housing A+; Watch: schools F, amenities F, commute F.
- Charlotte (suburban): math 54% / reading 54% proficiency, ranked #22 of 73 in FL (top 30%) — acceptable for families but not a draw, mixed tenant base, ~2y average lease.
- Market conditions: Rents soft (-0.1%/yr); 999 active listings in the ZIP; 27 comparable units currently listed for rent nearby; rentals at typical pace (median 21d on market — plan ~3-4 weeks tenant-placement turnaround); solid renter incomes; 4,585 units permitted in Charlotte County in 2024 (703 in 5+ unit buildings).
- This rent runs 37% of the median local income ($76k/yr) — at the standard rent-burdened threshold; future hikes will face affordability resistance.
Forward outlook
- Local home prices are declining (-3.0%/yr); year-one equity from $1k of loan paydown is wiped out by about $6k of value loss. Plan a longer hold.
- Charlotte County population projected at +24% by 2050 — long-run rental-demand tailwind backs the buy-and-hold thesis.
Negotiation context
- Only 2 days on market — expect competitive offers; lowballing is unlikely to land.
Risks & watch-outs
- Watch-outs: flood insurance adds $427/mo.
- Climate carrying-cost: in FEMA flood zone AE (mandatory federal flood insurance); severe wind risk, 99% chance of damaging wind over 30y; extreme-heat days projected 7→29/yr by 2055 (HVAC capex compounding) — expect insurance premiums to compound above CPI over the hold.
Questions for the listing agent
- What do current leases actually rent for vs. the listed asking? Can we see a recent rent roll and the last 12 months of T-12 income?
- What's the actual annual flood-insurance premium (NFIP or private), and is the property in a SFHA with mandatory coverage?
- What does the HOA fee cover, when was the last increase, and are there any pending special assessments or reserve-fund shortfalls?
- Is there a deadline driving the sale (1031 exchange, divorce, estate, relocation)? That informs how much negotiation room exists.
- Schools are F-rated, which usually means shorter tenancies and higher turnover. Who's the typical renter profile here, and what's been the actual vacancy rate?
- What's the average days-on-market for RENTAL listings here right now (not sales)? A rising rental-DOM trend means longer vacancies and softer asking-rent achievability than the comps imply.
- What's the recent tenant-quality profile in this submarket — average credit score on applications, eviction rate, late-payment / NSF rate, and stable-employment percentage? A property-management company in the area should have these aggregated.
- How much new for-sale + rental construction is in the pipeline within 1–3 miles? Heavy new supply typically softens prices + rents 12–24 months out; constrained supply supports both.
Investment metrics
- 1% rule
- 1.23% ✓
- Cap rate
- 8.45%
- Cash-on-cash
- 7.71%
- DSCR
- 1.34
- GRM
- 6.8
CMA / ARV
- ARV (on-the-fly)
- $158,760
- Comps found
- 1
Show comp detail 1 sale within ~0.75 mi
| Address | Dist | Beds/Ba | Sqft | Sold | Price | $/sf | Match |
|---|---|---|---|---|---|---|---|
| 16 Alligator Ave | 0.22mi | 2/2.0 | 1,193 (+10%) | 8mo | $175,000 | $147 | 66 |
Match score weights: distance 35% · size 25% · config 20% · recency 20%. Top-matched comps best support the ARV.
Projected returns pro-forma
-3.0% appreciation · 0.0% rent growth · sell at horizon
- IRR
- -24.4%
- Equity multiple
- 0.20×
- Total profit
- $-42,625
- Equity at exit
- $28,330
- IRR
- -43.1%
- Equity multiple
- -0.29×
- Total profit
- $-68,860
- Equity at exit
- $16,428
Cash invested: $53,200 (down + closing). Projections, not guarantees.
Landlord ↔ Tenant lean methodology
- Overall (STATE)
- 87 Strongly Landlord-Friendly
- State Florida
- 87 Strongly Landlord-Friendly · R+3
- County
- — inherits STATE
- City
- — inherits STATE
ZIP-level market 33950
- Home prices YoY
- -29.9%
- Rents YoY
- -0.1%
- Active inventory
- 999
- Price-to-rent
- 6.8×
Monthly cashflow live
- Estimated rent
- $2,338 high interval (Pro) →
- Mortgage (P&I)
- −$996
- Tax from tax record
- −$164 /mo · $1,974/yr
- Insurance
- −$79
- Flood insurance flood zone
- −$427 /mo · $5,118/yr
- HOA
- −$265
- Vacancy / Maint / Mgmt
- −$491
- Net cashflow
- $-85
Break-even live
UW: 25.0% down · 7.5% · 30yr · 1.5% tax · 5.0% vac · 8.0% maint · 8.0% mgmt
Financing live
Cash to close
- Down payment
- $47,500
- Closing costs
- $5,700
- Reserves months
- —
- Total cash needed
- —
Loan-product check · same deal, 3 products live
Conventional
25% down · 7.5% · 30yr
- Down + closing
- —
- Monthly P&I
- —
- Monthly cashflow
- —
- DSCR
- —
- Eligible?
- —
Personal DTI + credit; lowest rate.
DSCR
20% down · 8.5% · 30yr
- Down + closing
- —
- Monthly P&I
- —
- Monthly cashflow
- —
- DSCR
- —
- Eligible?
- —
No personal income docs; deal must DSCR.
Hard money
10% down · 12.0% · 12mo
- Down + closing
- —
- Monthly P&I
- —
- Monthly cashflow
- —
- DSCR
- —
- Eligible?
- —
Short-term bridge; refi at stabilization.
Rent comps 27 comps
| Address | Beds | Baths | Sqft | Rent | $/sqft | DOM | Units | Dist |
|---|---|---|---|---|---|---|---|---|
| 16 Freeman Ave Unit Reservation spot 2 Punta Gorda, FL | 2.0 | 2.0 | 1375 | $3,500 | $2.55 | 20d | 1 | 0.06mi |
| 4020 Palm Dr Punta Gorda, FL | 2.0 | 2.0 | 1228 | $2,300 | $1.87 | 20d | 1 | 0.21mi |
| 3121 Vasco St #6 Punta Gorda, FL | 2.0 | 2.0 | 748 | $1,200 | $1.60 | 20d | 1 | 0.66mi |
| 4730 Almar Dr Unit 1049742P Punta Gorda, FL | 2.0 | 2.0 | 861 | $3,851 | $4.47 | 13d | 1 | 0.70mi |
| 3025 Magnolia Way Punta Gorda, FL | 2.0 | 2.0 | 1068 | $2,500 | $2.34 | 20d | 1 | 0.77mi |
| 2926 Vasco St Unit 112 Punta Gorda, FL | 3.0 | 2.0 | 1329 | $2,250 | $1.69 | 20d | 1 | 0.77mi |
| 2921 Vasco St Unit B Punta Gorda, FL | 2.0 | 2.0 | 900 | $1,500 | $1.67 | 20d | 1 | 0.80mi |
| 3701 Albacete Cir #98 Punta Gorda, FL | 2.0 | 2.0 | 1451 | $3,250 | $2.24 | 20d | 1 | 0.89mi |
| 1358 Rock Dove Ct Apt 7 Punta Gorda, FL | 2.0 | 2.0 | 1012 | $1,650 | $1.63 | 13d | 1 | 1.00mi |
| 323 Dolphin Pkwy Punta Gorda, FL | 2.0 | 2.0 | 1272 | $2,100 | $1.65 | 20d | 1 | 1.01mi |
| 3800 Tripoli Blvd #35 Punta Gorda, FL | 2.0 | 2.0 | 1451 | $4,200 | $2.89 | 20d | 1 | 1.14mi |
| 3221 White Ibis Ct Punta Gorda, FL | 2.0 | 1.0 | 826 | $1,425 | $1.73 | 13d | 2 | 1.14mi |
| 3251 White Ibis Ct Unit A1 Punta Gorda, FL | 2.0 | 2.0 | 1025 | $1,500 | $1.46 | 20d | 1 | 1.15mi |
| 625 Pompano Ter Punta Gorda, FL | 2.0 | 2.0 | 1220 | $1,850 | $1.52 | 20d | 1 | 1.18mi |
| 3845 Albacete Cir #50 Punta Gorda, FL | 2.0 | 2.0 | 1451 | $2,200 | $1.52 | 20d | 1 | 1.20mi |
| 2845 Magdalina Dr Unit 2 Punta Gorda, FL | 2.0 | 1.0 | 895 | $1,200 | $1.34 | 20d | 1 | 1.22mi |
| 255 W End Dr Punta Gorda, FL | 2.0–3.0 | 2.0 | 1559 | $2,800 | $1.80 | 20d | 3 | 1.24mi |
| 3233 Wood Thrush Dr Unit 24A Punta Gorda, FL | 2.0 | 2.0 | 1024 | $2,100 | $2.05 | 13d | 1 | 1.25mi |
| 920 Conecta Dr Punta Gorda, FL | 2.0 | 2.5 | 1137 | $1,500 | $1.32 | 13d | 1 | 1.28mi |
| 3322 Purple Martin Dr #132 Punta Gorda, FL | 2.0 | 2.0 | 1381 | $1,650 | $1.19 | 20d | 1 | 1.33mi |
| 3322 Purple Martin Dr Unit Reservation Spot 1 Punta Gorda, FL | 2.0 | 2.0 | 1400 | $3,800 | $2.71 | 20d | 1 | 1.33mi |
| 1461 Aqui Esta Dr Unit B4 Punta Gorda, FL | 2.0 | 2.0 | 1049 | $1,800 | $1.72 | 13d | 1 | 1.36mi |
| 240 W End Dr #611 Punta Gorda, FL | 2.0 | 2.0 | 1306 | $1,675 | $1.28 | 20d | 1 | 1.37mi |
| 1335 Mineo Dr Unit G Punta Gorda, FL | 2.0 | 1.0 | 839 | $1,400 | $1.67 | 13d | 1 | 1.39mi |
| 1204 Spanish Cay Ln Unit A Punta Gorda, FL | 2.0 | 2.0 | 1176 | $1,495 | $1.27 | 20d | 1 | 1.44mi |
| 3640 Bal Harbor Blvd #534 Punta Gorda, FL | 2.0 | 2.0 | 1405 | $1,800 | $1.28 | 13d | 1 | 1.47mi |
| 26120 Jones Loop Rd Punta Gorda, FL | 3.0 | 1.0–2.0 | 1105 | $1,940 | $1.75 | 13d | 27 | 1.49mi |
HOA detail
- Monthly dues
- $265 · $3,180/yr
Listing history 3 events
-
2026-06-18days on market $190,000 Active 2 DOM
-
2026-06-16remarks 699-char remark
-
2026-06-16$190,000 Active 1 DOM
ⓘ Source: listings_history table (triggers on properties + properties_extension) + one-shot
backfill from property_details.listing_events for pre-trigger history.
Tax reassessment forecast FL · Resets to sale price
- Current annual tax
- $1,974 · $164/mo
- Projected year-2 tax
- $1,974 · $164/mo
- Expected delta
- $0/yr ($0/mo · 0.0%)
ⓘ Screening estimate from a state-policy table — verify with the county assessor before closing.
Climate risk First Street
- Flood 10/10 Extreme FEMA zone AE · 99% chance over 30 yrs
- Wildfire 4/10 Moderate
- Heat 10/10 Extreme 7 d/yr ≥107°F today · 29 d/yr by 30 yrs out
- Wind 10/10 Extreme 99% chance of damaging wind over 30 yrs
- Air quality 3/10 Moderate 2 unhealthy d/yr today · 2 by 30 yrs out
Nearby sold comps map
Loading sold comps map…
Walkable amenities ~0.75 mi
Loading nearby amenities…
Taxation est. · year 1
- Rental income
- $28,052
- − Mortgage interest
- −$10,643
- − Property taxes
- −$1,974
- − Insurance
- −$6,068
- − Repairs & maintenance
- −$2,244
- − Management
- −$2,244
- − HOA
- −$3,180
- − Depreciation
- −$5,527
- Taxable loss
- −$3,829
- Est. tax savings @ 24.0%
- +$919
- After-tax cash flow
- $-99/yr
For passive investors: Depreciation is non-cash, so a rental often shows a tax loss while cash-flowing — sheltering income. Rental losses are passive: they offset passive income freely, and up to $25,000/yr can offset ordinary (W-2) income if you actively participate and your MAGI is under $100k (phasing out to $0 by $150k); unused losses carry forward. On sale, claimed depreciation is recaptured at up to 25%, and gains may owe capital-gains tax (a 1031 exchange can defer both). Figures are a year-1 estimate at your 24.0% rate — not tax advice; consult a CPA.
Schools (NCES district)
- District
- Charlotte
- NCES district ID
- 1200240
- Math proficiency
- 54% ▼ -6.00%
- Reading proficiency
- 54% ▼ -1.00%
- Median HH income
- $44,864
- Composite
- 45.62/100
- National rank
- #2586
- State rank
- #22 of 73 in FL
Livability — Charlotte Park
- Score
- 66/100
- State rank
- #624
- US rank
- #12150
Category grades
Schools grade is shown separately in the Schools card above.
Census & demographics
- Census place
- Charlotte Park, FL
- County
- Charlotte County · 196,994 people
- Metro
- Punta Gorda, FL
- Population (ZIP)
- 24,955
- Household income
- $76,369
- Rent vs Own
- Severe rent burden
- 608.0
Population outlook (Charlotte County) Hauer SSP2
- Today (2025)
- 198,646 people
- By 2030
- 210,507 · +6.0%
- By 2040
- 230,857 · +16.2%
- By 2050
- 247,148 · +24.4%
- By 2075
- 281,777 · +41.8%
- By 2100
- 293,609 · +47.8%
Race, ethnicity, and origin ACS 2023
- Neighborhood character
- Predominantly White (86%)
- Race & ethnicity
- White 86% Two or more races 5% Black 5% Hispanic / Latino 4% Asian 1%
- Common ancestry
- Lithuanian 5% Romanian 4% Italian 2%
- Foreign-born
- 7% · Canada
- Languages at home
- 95% English-only · Spanish 3% Other Indo-European 1% German/W. Germanic 1%
Political lean MEDSL · Charlotte
- 2024 margin
- Solid R (+34.0) · D 32.7% · R 66.7%
- 2008→2024 swing
- -26.7pp toward R · 2008: -7.2pp · 2024: -34.0pp
- All cycles
- 2024: R+34.0 2020: R+26.6 2016: R+27.8 2012: R+14.3 2008: R+7.2
Not yet ingested
- Civics
- —
Market trends
- HPI YoY
- ▼ -111.73%
- Current HPI
- 261.6573
- Rent YoY
- ▼ -0.06%
- Metro
- Punta Gorda, FL
- State GDP YoY
- ▲ 3.28%
- F500 in state
- 36
Industry mix (Fortune 500 HQ in FL)
| Industry | F500 HQs | Revenue |
|---|---|---|
| Industrial Technology | 2 | $29B |
|
||
| Insurance | 2 | $17B |
|
||
| Retail | 1 | $60B |
|
||
| Technology Distribution | 1 | $58B |
|
||
| Homebuilding | 1 | $35B |
|
||
| Technology Manufacturing | 1 | $35B |
|
||
Price history
1 event — show timeline
- 2026-06-16 Listed $190,000 Stellar MLS as Distributed by MLS Grid
Property tax history
+1.9%/yrLatest (2025): $1,974 · +6.4% YoY. Source: county tax records.
Cash-flow waterfall
monthlySold comps — $/sqft
last 12 mo · ≤1 miLoading sold comps…