 Fourplex
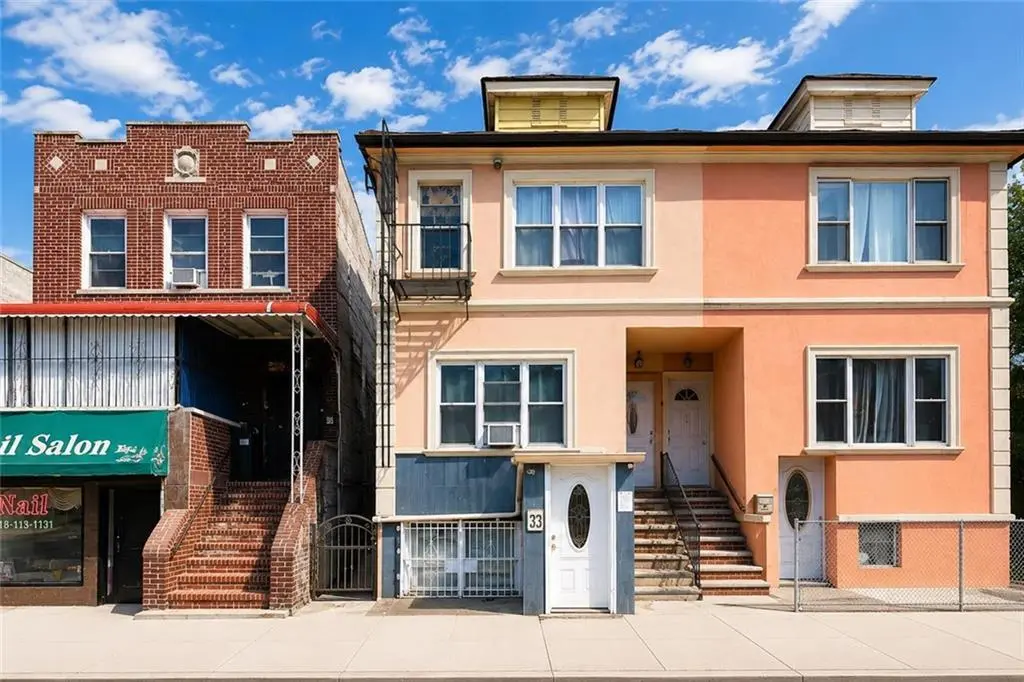
33 Avenue U · New York, NY
Flood risk No data
- FEMA flood zone
- —
- Chance of flooding over 30 yrs
- —
- Est. flood insurance / yr
- —
Fire risk No data
- Est. fire insurance / yr
- —
Heat risk No data
- Hot days now (above threshold)
- —
- Hot days in 30 yrs
- —
Wind risk No data
- Chance of severe wind over 30 yrs
- —
Air-quality risk No data
- Unhealthy air days now
- —
- Unhealthy air days in 30 yrs
- —
Risk factors via First Street. Map © Google.
Why this score? — see what drove the C grade
The composite is a weighted blend of 9 inputs, each scored 0–100. Each bar is that input's sub-score; the figure is the points it added to the 100-point composite (weight × sub-score).
- Cash flow +20.5/30.0
- ARV discount +9.5/15.0
- DSCR +6.5/10.0
- 1% rule +5.4/10.0
- Rent growth +5.0/5.0
- Schools +5.0/10.0
- Livability +3.8/5.0
- Condition / age +2.5/5.0
- Appreciation +0.0/10.0
$1,599,000
🖨 Deal sheet 📄 Offer letter ✓ Due diligence
Multi-family units
County records classify this as Multi-Family (2-4 Unit). Listing-text estimate: 4 units. confirmed
Listing remarks MLS
Great investment opportunity! Mixed-use building 1 retail store and 4 families in Gravesend. Building size: 20x65, Lot size: 22x100. Tax: $10,006. Zoning R5B. Gross annual income $97,200. Total annual expenses: $10,780. Net income: $76,414. Cap Rate: 5%. Near N train Ave U and D train 25th Ave. Also close to 86th St and Ave U business district. Convenient to all shopping, restaurants, supermarket.
Key facts
- Strong cash flow
- Annual rental income
- Excellent visibility
Tags
Property features AI
Finance
- Other: Zoning: R5B
- Financial info: Financing options include bank mortgage, cash, and exchange considered; Utility expense listed (annual): $2,800; Property configured as a 5-unit income building with month-to-month leases for listed units and current rents around $1,800–$1,850 for residential units; one unit shows projected rent of $1,850
Exterior
- Parking: No designated parking
- Utilities: Electric: 110V and 220V; Hot water: Gas; Heating fuel: Gas
- Home design: Semi-detached building; Mixed-use property
- Construction: Brick and block construction with stucco exterior; Pitched roof; Block foundation; Building footprint about 1,300 sq ft; building dimensions approximately 65 x 20
- Exterior features: Back yard; Mixed-use property
Interior
- Bedrooms: Five units total: two 3-bedroom units, two 2-bedroom units, and one medical/commercial unit
- Flooring: Hardwood floors; Laminate floors; Tile floors
- Bathrooms: Four residential units each with one full bathroom; Medical/commercial unit with one half bath
- Heating & cooling: Gas hot water; Steam/radiator heat
- Interior features: Finished basement; Hardwood, laminate and tile floors; No central air conditioning units listed
Neighborhood map
What this means for you Summary
Snapshot
- This is a 2×3bd/1.1ba + 2×2bd/1.1ba units multifamily listed at $1.60M.
Deal economics
- At list price, monthly cash flow is $2k ($25k/yr) — positive. Per door: $525/mo.
- The deal already cash-flows at list — no discount required.
- Meets the 1% rule at list price ($17k rent vs $1.60M).
- Cap rate 7.9% vs local median 2.6% in New York — top-decile yield for the area; either an underpriced asset or a hidden risk that comps aren't pricing in. Stress-test before assuming the spread holds.
Location & tenants
- Location reads 75/100 on livability (#268 in NY, #4,188 nationally) — a middle-class / working-renter tenant base. Strengths: amenities A+, commute A+, health & safety A; Watch: crime F, cost of living F.
- Market conditions: Rents rising fast (+13.1%/yr); 216 active listings in the ZIP; 10,063 units permitted in Kings County in 2024 (9,789 in 5+ unit buildings).
- At $16,645/mo this rent would consume 315% of the median local household income ($63k/yr) (locally 6011% of renters already pay >50% of income on rent) — very limited rent-growth headroom before tenants either downsize or default.
Forward outlook
- Local home prices are declining (-3.0%/yr); year-one equity from $11k of loan paydown is wiped out by about $48k of value loss. Plan a longer hold.
- Kings County population projected at +13% by 2050 — modest demand growth; plan on rents tracking national, not racing it.
- At projected returns (-3.0% appreciation + 8.0% rent growth), your $448k cash investment doubles in ~9 years — after that, you're playing with house money.
Negotiation context
- Only 10 days on market — expect competitive offers; lowballing is unlikely to land.
- 3 sale attempts since 11y ago with the ask held roughly flat each time — persistent listings suggest the price (not the market) is what's stuck; bring a comps-based counter.
Risks & watch-outs
- Watch-outs: built in 1931 — expect roof / HVAC / electrical / plumbing capex.
Questions for the listing agent
- Can we see the unit-by-unit rent roll, current vacancy, and any below-market leases? What's the average tenancy length?
- What capital expenditures (roof, boiler, parking lot, exteriors) have been made in the last 5 years, and what's planned in the next 2?
- Built in 1931 — when were the roof, HVAC, electrical panel, plumbing, and water heater last replaced?
- Is there a deadline driving the sale (1031 exchange, divorce, estate, relocation)? That informs how much negotiation room exists.
- Schools are B-rated — typically a magnet for longer-tenancy family renters. What's the average tenant stay here, and is there a school-zone premium baked into asking?
- Crime grade is F in this area — have there been break-ins, vandalism, or insurance claims at this property in the last 3 years? What carrier currently insures it and at what premium?
- What's the average days-on-market for RENTAL listings here right now (not sales)? A rising rental-DOM trend means longer vacancies and softer asking-rent achievability than the comps imply.
- What's the recent tenant-quality profile in this submarket — average credit score on applications, eviction rate, late-payment / NSF rate, and stable-employment percentage? A property-management company in the area should have these aggregated.
- How much new apartment / multifamily construction is in the pipeline within 1–3 miles? Heavy new supply (>2% of stock underway) typically softens rents 12–24 months out; light construction supports rent growth.
Investment metrics
- 1% rule
- 1.04% ✓
- Cap rate
- 7.87%
- Cash-on-cash
- 5.63%
- DSCR
- 1.25
- GRM
- 8.0
CMA / ARV
- ARV (on-the-fly)
- $1,671,800
- Comps found
- 11
Show comp detail 11 sales within ~0.75 mi
| Address | Dist | Beds/Ba | Sqft | Sold | Price | $/sf | Match |
|---|---|---|---|---|---|---|---|
| 1880 W 6th St | 0.45mi | 7/4.0 (-1) | 2,700 (+4%) | 2mo | $1,459,000 | $540 | 65 |
| 1864 W 6th St | 0.47mi | 7/3.0 (-1) | 2,560 (-2%) | 2mo | $1,052,000 | $411 | 63 |
| 2365 82nd St | 0.46mi | 8/4.0 | 2,800 (+8%) | 7mo | $1,800,000 | $643 | 58 |
| 70 Bay 34th St | 0.51mi | 8/4.0 | 2,490 (-4%) | 11mo | $1,570,000 | $631 | 58 |
| 1945 W 6th St | 0.40mi | 7/6.0 (-1) | 2,706 (+4%) | 6mo | $1,910,000 | $706 | 58 |
| 1962 W 10th St | 0.22mi | 7/4.0 (-1) | 2,340 (-10%) | 11mo | $1,638,000 | $700 | 57 |
| 156 28th Ave | 0.64mi | 8/3.0 | 2,595 (-0%) | 14mo | $988,000 | $381 | 52 |
| 1718 W 11th St | 0.61mi | 9/3.0 (+1) | 2,652 (+2%) | 8mo | $1,450,000 | $547 | 51 |
| 8666 24th Ave | 0.42mi | 8/3.0 | 2,268 (-13%) | 10mo | $1,880,000 | $829 | 45 |
| 2260 80th St | 0.63mi | 7/5.5 (-1) | 2,784 (+7%) | 17mo | $1,880,000 | $675 | 35 |
| 163 Bay 38th St | 0.41mi | 7/4.5 (-1) | 2,256 (-13%) | 23mo | $1,500,000 | $665 | 34 |
Match score weights: distance 35% · size 25% · config 20% · recency 20%. Top-matched comps best support the ARV.
Projected returns pro-forma
-3.0% appreciation · 8.0% rent growth · sell at horizon
- IRR
- -2.1%
- Equity multiple
- 0.92×
- Total profit
- $-37,190
- Equity at exit
- $238,416
- IRR
- 12.4%
- Equity multiple
- 2.21×
- Total profit
- $541,161
- Equity at exit
- $138,252
Cash invested: $447,720 (down + closing). Projections, not guarantees.
Landlord ↔ Tenant lean methodology
- Overall (CITY)
- 0 Strongly Tenant-Friendly
- State New York
- 15 Strongly Tenant-Friendly · D+10
- County
- — inherits STATE
- City New York
- 0 Strongly Tenant-Friendly · D+34
ZIP-level market 11223
- Rents YoY
- 13.1%
- Active inventory
- 216
- Price-to-rent
- 29.7×
Monthly cashflow live
- Estimated rent
- $16,645 medium interval (Pro) →
- Mortgage (P&I)
- −$8,385
- Tax est. 1.5%
- −$1,999 /mo · $23,985/yr
- Insurance
- −$666
- HOA
- −$0
- Vacancy / Maint / Mgmt
- −$3,495
- Net cashflow
- $2,099
Break-even live
4-unit breakdown (identical units grouped — click to expand)
| Units | Beds | Baths | Est. rent |
|---|---|---|---|
| 2× units | 3 | 1.1 | $8,986 |
| #1 | 3 | 1.1 | $4,493 |
| #2 | 3 | 1.1 | $4,493 |
| 2× units | 2 | 1.1 | $7,658 |
| #3 | 2 | 1.1 | $3,829 |
| #4 | 2 | 1.1 | $3,829 |
| Total (4 units) | $16,645 | ||
UW: 25.0% down · 7.5% · 30yr · 1.5% tax · 5.0% vac · 8.0% maint · 8.0% mgmt
Financing live
Cash to close
- Down payment
- $399,750
- Closing costs
- $47,970
- Reserves months
- —
- Total cash needed
- —
Loan-product check · same deal, 3 products live
Conventional
25% down · 7.5% · 30yr
- Down + closing
- —
- Monthly P&I
- —
- Monthly cashflow
- —
- DSCR
- —
- Eligible?
- —
Personal DTI + credit; lowest rate.
DSCR
20% down · 8.5% · 30yr
- Down + closing
- —
- Monthly P&I
- —
- Monthly cashflow
- —
- DSCR
- —
- Eligible?
- —
No personal income docs; deal must DSCR.
Hard money
10% down · 12.0% · 12mo
- Down + closing
- —
- Monthly P&I
- —
- Monthly cashflow
- —
- DSCR
- —
- Eligible?
- —
Short-term bridge; refi at stabilization.
Listing history 7 events
-
2026-06-18days on market $1,599,000 Active 10 DOM
-
2026-06-17days on market $1,599,000 Active 9 DOM
-
2026-06-16days on market $1,599,000 Active 8 DOM
-
2026-06-15days on market $1,599,000 Active 7 DOM
-
2026-06-13days on market $1,599,000 Active 5 DOM
-
2026-06-08remarks 699-char remark
-
2026-06-08$1,599,000 Active 1 DOM
ⓘ Source: listings_history table (triggers on properties + properties_extension) + one-shot
backfill from property_details.listing_events for pre-trigger history.
Nearby sold comps map
Loading sold comps map…
Walkable amenities ~0.75 mi
Loading nearby amenities…
Taxation est. · year 1
- Rental income
- $199,740
- − Mortgage interest
- −$89,569
- − Property taxes
- −$23,985
- − Insurance
- −$7,995
- − Repairs & maintenance
- −$15,979
- − Management
- −$15,979
- − Depreciation
- −$46,516
- Taxable loss
- −$284
- Est. tax savings @ 24.0%
- +$68
- After-tax cash flow
- $25,259/yr
For passive investors: Depreciation is non-cash, so a rental often shows a tax loss while cash-flowing — sheltering income. Rental losses are passive: they offset passive income freely, and up to $25,000/yr can offset ordinary (W-2) income if you actively participate and your MAGI is under $100k (phasing out to $0 by $150k); unused losses carry forward. On sale, claimed depreciation is recaptured at up to 25%, and gains may owe capital-gains tax (a 1031 exchange can defer both). Figures are a year-1 estimate at your 24.0% rate — not tax advice; consult a CPA.
Schools (NCES district)
No district data.
Livability — New York
- Score
- 75/100
- State rank
- #268
- US rank
- #4188
Category grades
Schools grade is shown separately in the Schools card above.
Census & demographics
- Census place
- New York, NY
- County
- Kings County · 2,614,986 people
- City population
- 7,731,280
- Metro
- New York-Newark-Jersey City, NY-NJ-PA
- Population (ZIP)
- 78,093
- Household income
- $63,368
- Rent vs Own
- Severe rent burden
- 6011.0
Population outlook (Kings County) Hauer SSP2
- Today (2025)
- 2,847,441 people
- By 2030
- 2,937,006 · +3.1%
- By 2040
- 3,095,491 · +8.7%
- By 2050
- 3,228,968 · +13.4%
- By 2075
- 3,321,723 · +16.7%
- By 2100
- 3,111,387 · +9.3%
Race, ethnicity, and origin ACS 2023
- Neighborhood character
- Diverse neighborhood (Simpson 0.65)
- Race & ethnicity
- White 51% Asian 26% Hispanic / Latino 13% Black 5% Two or more races 4%
- Hispanic origin (detail)
- Mexican 5% Puerto Rican 2% Dominican 1%
- Common ancestry
- Scotch-Irish 4% Subsaharan African 4% Romanian 1%
- Foreign-born
- 46% · China, Canada, Philippines
- Languages at home
- 41% English-only · Chinese 17% Russian/Polish/Slavic 15% Spanish 9%
Political lean MEDSL · Kings
- 2024 margin
- Solid D (+44.0) · D 72.0% · R 28.0%
- 2008→2024 swing
- -15.5pp toward R · 2008: 59.4pp · 2024: 44.0pp
- All cycles
- 2024: D+44.0 2020: D+54.8 2016: D+61.8 2012: D+63.9 2008: D+59.4
Not yet ingested
- Civics
- —
Market trends
- HPI YoY
- ▼ -286.92%
- Current HPI
- 430.9891
- Rent YoY
- ▲ 13.09%
- Metro
- New York-Newark-Jersey City, NY-NJ-PA
- State GDP YoY
- ▲ 2.60%
- F500 in state
- 92
Industry mix (Fortune 500 HQ in NY)
| Industry | F500 HQs | Revenue |
|---|---|---|
| Financial Services | 10 | $950B |
|
||
| Consumer Goods | 9 | $162B |
|
||
| Insurance | 4 | $225B |
|
||
| Telecommunications | 2 | $144B |
|
||
| Pharmaceuticals | 2 | $112B |
|
||
| Media / Entertainment | 2 | $69B |
|
||
Price history
+23.1% since first listed11 events — show timeline
- 2026-06-08 Listed $1,599,000 BNYMLS
- 2024-05-22 Price Changed $1,599,000 BNYMLS
- 2022-03-31 Sold (MLS) $1,400,000 BNYMLS
- 2022-02-24 Pending — BNYMLS
- 2021-11-01 Price Changed $1,550,000 BNYMLS
- 2021-10-27 Price Changed $1,580,000 BNYMLS
- 2021-09-02 Listed $1,590,000 BNYMLS
- 2021-08-04 Price Changed $1,690,000 BNYMLS
- 2021-07-26 Price Changed $1,590,000 BNYMLS
- 2016-09-09 Delisted — BNYMLS
- 2015-07-10 Listed $1,299,000 BNYMLS
Cash-flow waterfall
monthlySold comps — $/sqft
last 12 mo · ≤1 miLoading sold comps…