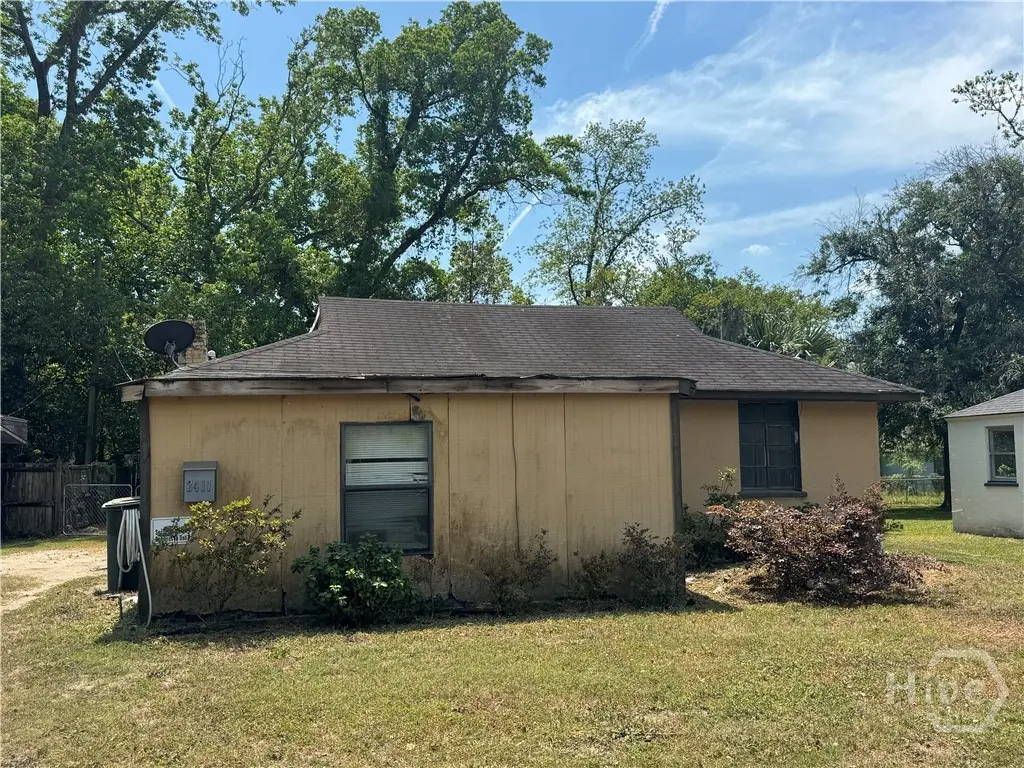
2411 New York Ave · Savannah, GA
Flood risk 1/10 · Minimal
- FEMA flood zone
- X (unshaded)
- Chance of flooding over 30 yrs
- 0.0%
- Est. flood insurance / yr
- $507 – $1,088
Fire risk 3/10 · Minor
- Est. fire insurance / yr
- $963 – $1,789
Heat risk 10/10 · Severe
- Hot days now (above 107°F)
- 7 days/yr
- Hot days in 30 yrs
- 18 days/yr
Wind risk 9/10 · Severe
- Chance of severe wind over 30 yrs
- 99.0%
Air-quality risk 5/10 · Moderate
- Unhealthy air days now
- 7 days/yr
- Unhealthy air days in 30 yrs
- 8 days/yr
Risk factors via First Street. Map © Google.
Why this score? — see what drove the B- grade
The composite is a weighted blend of 9 inputs, each scored 0–100. Each bar is that input's sub-score; the figure is the points it added to the 100-point composite (weight × sub-score).
- Cash flow +30.0/30.0
- 1% rule +10.0/10.0
- DSCR +10.0/10.0
- ARV discount +7.5/15.0
- Livability +4.3/5.0
- Rent growth +3.4/5.0
- Condition / age +2.5/5.0
- Schools +2.0/10.0
- Appreciation +0.0/10.0
$99,900
🖨 Deal sheet 📄 Offer letter ✓ Due diligence
Listing remarks MLS
This 3 bedroom, 1 bathroom home sits in Savannah’s Avondale neighborhood, and is the perfect opportunity for a savvy investor. In need of repairs, this property is ideal for a flip or buy and hold rental with strong potential. Bring your contractor and your vision to this value add opportunity.
Key facts
- 5,101 sq ft lot
- Built 1948
- Listed 63 days
Neighborhood map
What this means for you Summary
Snapshot
- This is a 2-bed/1.0-bath single-family listed at $100k.
Deal economics
- At list price, monthly cash flow is $779 ($9k/yr) — positive.
- The deal already cash-flows at list — no discount required.
- Meets the 1% rule at list price ($2k rent vs $100k).
- Recommended offer: $94k (6.0% below list) — sets the bar for market timing.
- Cap rate 15.6% vs local median 4.0% in Savannah — top-decile yield for the area; either an underpriced asset or a hidden risk that comps aren't pricing in. Stress-test before assuming the spread holds.
Location & tenants
- Location reads 86/100 on livability (#1 in GA, #397 nationally) — a professional / high-income tenant draw. Strengths: crime A+, amenities A+, commute A+; Watch: employment D, schools F.
- Savannah-Chatham County (urban): math 20% / reading 26% proficiency, ranked #134 of 174 in GA (top 77%) — low school quality limits family demand, transient renter base, plan for 1-2y turnover.
- Market conditions: Rents rising (+3.6%/yr); 226 active listings in the ZIP; 40 comparable units currently listed for rent nearby; rentals lingering (median 44d on market — plan ~5-8 weeks vacancy on turnover, expect pricing pressure); 62% of comp listings sitting > 30 days — soft ceiling on asking rent; 2,694 units permitted in Chatham County in 2024 (973 in 5+ unit buildings).
- This rent runs 39% of the median local income ($53k/yr) — at the standard rent-burdened threshold; future hikes will face affordability resistance.
Forward outlook
- Local home prices are declining (-3.0%/yr); year-one equity from $691 of loan paydown is wiped out by about $3k of value loss. Plan a longer hold.
- Chatham County population projected at +33% by 2050 — long-run rental-demand tailwind backs the buy-and-hold thesis.
- At projected returns (-3.0% appreciation + 3.6% rent growth), your $28k cash investment doubles in ~4 years — after that, you're playing with house money.
Negotiation context
- It's been on market 63 days — a 6% lower offer ($94k) is reasonable based on typical stale-listing flexibility.
- Current owner paid $76k; 31% above their basis — modest negotiation headroom, anchor on the comps not their cost.
Risks & watch-outs
- Watch-outs: built in 1948 — expect roof / HVAC / electrical / plumbing capex.
- Climate carrying-cost: severe wind risk, 99% chance of damaging wind over 30y; extreme-heat days projected 7→18/yr by 2055 (HVAC capex compounding) — expect insurance premiums to compound above CPI over the hold.
Questions for the listing agent
- It's been on market 63 days. Have you received any prior offers? Is the seller open to a 6% concession, seller financing, or rate buy-down credit?
- Built in 1948 — when were the roof, HVAC, electrical panel, plumbing, and water heater last replaced?
- Why hasn't it sold? Are there any deal-killer items the seller is aware of (foundation, flood, title, zoning, code violations)?
- Is there a deadline driving the sale (1031 exchange, divorce, estate, relocation)? That informs how much negotiation room exists.
- Schools are F-rated, which usually means shorter tenancies and higher turnover. Who's the typical renter profile here, and what's been the actual vacancy rate?
- What's the average days-on-market for RENTAL listings here right now (not sales)? A rising rental-DOM trend means longer vacancies and softer asking-rent achievability than the comps imply.
- What's the recent tenant-quality profile in this submarket — average credit score on applications, eviction rate, late-payment / NSF rate, and stable-employment percentage? A property-management company in the area should have these aggregated.
- How much new for-sale + rental construction is in the pipeline within 1–3 miles? Heavy new supply typically softens prices + rents 12–24 months out; constrained supply supports both.
Investment metrics
- 1% rule
- 1.75% ✓
- Cap rate
- 15.65%
- Cash-on-cash
- 33.42%
- DSCR
- 2.49
- GRM
- 4.8
CMA / ARV
- ARV (median comp)
- $243,557
- List price
- $99,900
- Delta
- -58.98%
- Verdict
- UNDERPRICED
- Comps
- 20 within 1.0 mi
Show comp detail 12 sales within ~0.75 mi
| Address | Dist | Beds/Ba | Sqft | Sold | Price | $/sf | Match |
|---|---|---|---|---|---|---|---|
| 2151 Mississippi Ave | 0.32mi | 2/1.0 | 984 (-4%) | 2mo | $235,500 | $239 | 77 |
| 2508 Mississippi Ave | 0.18mi | 3/2.0 (+1) | 1,040 (+2%) | 6mo | $269,000 | $259 | 75 |
| 2125 Florida Ave | 0.37mi | 2/1.0 | 1,044 (+2%) | 6mo | $265,000 | $254 | 75 |
| 2231 E Gwinnett St | 0.34mi | 3/2.0 (+1) | 996 (-3%) | 3mo | $238,256 | $239 | 68 |
| 2305 E 40th St | 0.63mi | 2/1.0 | 1,075 (+5%) | 2mo | $249,900 | $232 | 61 |
| 2409 E 37th St | 0.45mi | 2/1.0 | 948 (-8%) | 7mo | $298,000 | $314 | 61 |
| 2401 E 38th St | 0.49mi | 3/1.0 (+1) | 1,073 (+5%) | 7mo | $260,900 | $243 | 58 |
| 2130 Hanson St | 0.49mi | 3/1.0 (+1) | 1,140 (+11%) | 1mo | $253,000 | $222 | 53 |
| 2018 Bolling St | 0.57mi | 2/1.0 | 914 (-11%) | 6mo | $120,000 | $131 | 51 |
| 2237 E 42nd St | 0.70mi | 2/1.0 | 1,113 (+9%) | 6mo | $257,200 | $231 | 48 |
| 2230 Iowa St | 0.65mi | 3/1.0 (+1) | 944 (-8%) | 5mo | $235,000 | $249 | 48 |
| 2017 Vermont Ave | 0.55mi | 3/2.0 (+1) | 904 (-12%) | 2mo | $230,000 | $254 | 44 |
Match score weights: distance 35% · size 25% · config 20% · recency 20%. Top-matched comps best support the ARV.
Projected returns pro-forma
-3.0% appreciation · 3.62% rent growth · sell at horizon
- IRR
- 29.3%
- Equity multiple
- 2.23×
- Total profit
- $34,493
- Equity at exit
- $14,895
- IRR
- 37.0%
- Equity multiple
- 4.52×
- Total profit
- $98,362
- Equity at exit
- $8,638
Cash invested: $27,972 (down + closing). Projections, not guarantees.
Landlord ↔ Tenant lean methodology
- Overall (STATE)
- 90 Strongly Landlord-Friendly
- State Georgia
- 90 Strongly Landlord-Friendly · R+3
- County
- — inherits STATE
- City
- — inherits STATE
ZIP-level market 31404
- Rents YoY
- 3.6%
- Active inventory
- 226
- Price-to-rent
- 4.8×
Monthly cashflow live
- Estimated rent
- $1,747 high interval (Pro) →
- Mortgage (P&I)
- −$524
- Tax from tax record
- −$36 /mo · $428/yr
- Insurance
- −$42
- HOA
- −$0
- Vacancy / Maint / Mgmt
- −$367
- Net cashflow
- $779
Break-even live
UW: 25.0% down · 7.5% · 30yr · 1.5% tax · 5.0% vac · 8.0% maint · 8.0% mgmt
Financing live
Cash to close
- Down payment
- $24,975
- Closing costs
- $2,997
- Reserves months
- —
- Total cash needed
- —
Loan-product check · same deal, 3 products live
Conventional
25% down · 7.5% · 30yr
- Down + closing
- —
- Monthly P&I
- —
- Monthly cashflow
- —
- DSCR
- —
- Eligible?
- —
Personal DTI + credit; lowest rate.
DSCR
20% down · 8.5% · 30yr
- Down + closing
- —
- Monthly P&I
- —
- Monthly cashflow
- —
- DSCR
- —
- Eligible?
- —
No personal income docs; deal must DSCR.
Hard money
10% down · 12.0% · 12mo
- Down + closing
- —
- Monthly P&I
- —
- Monthly cashflow
- —
- DSCR
- —
- Eligible?
- —
Short-term bridge; refi at stabilization.
Rent comps 40 comps
| Address | Beds | Baths | Sqft | Rent | $/sqft | DOM | Units | Dist |
|---|---|---|---|---|---|---|---|---|
| 2503 Mississippi Ave Savannah, GA | 3.0 | 1.5 | 1373 | $1,800 | $1.31 | 44d | 1 | 0.15mi |
| 2201 Mississippi Ave Savannah, GA | 2.0 | 1.0 | 1005 | $1,595 | $1.59 | 44d | 1 | 0.30mi |
| 37 Altman Cir Savannah, GA | 2.0 | 2.0 | 879 | $1,750 | $1.99 | 44d | 1 | 0.32mi |
| 2141 New York Ave Unit A Savannah, GA | 2.0 | 1.0 | 765 | $1,750 | $2.29 | 44d | 1 | 0.35mi |
| 1110 New Jersey Ave Savannah, GA | 2.0 | 1.0 | 714 | $1,500 | $2.10 | 44d | 1 | 0.38mi |
| 2149 Vermont Ave Savannah, GA | 3.0 | 2.0 | 1213 | $1,955 | $1.61 | 44d | 1 | 0.39mi |
| 2137 Bolling St Savannah, GA | 3.0 | 1.0 | 1204 | $1,575 | $1.31 | 23d | 1 | 0.43mi |
| 375 Laurel Oak Ln Thunderbolt, GA | 3.0 | 2.5 | 1200 | $1,800 | $1.50 | 44d | 1 | 0.52mi |
| 2201 E 37th St Savannah, GA | 3.0 | 1.5 | 1424 | $1,800 | $1.26 | 23d | 1 | 0.55mi |
| 2010 Vermont Ave Savannah, GA | 2.0 | 1.0 | 892 | $1,690 | $1.89 | 44d | 1 | 0.58mi |
| 2328 E 41st St Savannah, GA | 2.0 | 1.0 | 1072 | $1,700 | $1.59 | 44d | 1 | 0.61mi |
| 2102 Auburn St Savannah, GA | 3.0 | 1.0 | 828 | $1,795 | $2.17 | 44d | 1 | 0.70mi |
| 2220 E Victory Dr #24 Savannah, GA | 2.0 | 1.5 | 1102 | $1,700 | $1.54 | 23d | 1 | 0.76mi |
| 2323 Downing Ave Savannah, GA | 2.0–3.0 | 1.5–2.0 | 1014 | $1,299 | $1.28 | 14d | 14 | 0.80mi |
| 2800 Capital St Savannah, GA | 1.0–3.0 | 1.0 | 980 | $1,412 | $1.44 | 44d | 1 | 0.86mi |
| 1810 E 32nd St Savannah, GA | 3.0 | 1.5 | 1218 | $3,000 | $2.46 | 23d | 1 | 0.88mi |
| 1704 E 31st St Savannah, GA | 3.0 | 2.0 | 1137 | $2,350 | $2.07 | 44d | 1 | 1.01mi |
| 1612 Skidaway Rd Savannah, GA | 2.0 | 1.0 | 1453 | $1,800 | $1.24 | 44d | 1 | 1.06mi |
| 2112 Clars Ave Unit A Savannah, GA | 2.0 | 1.0 | 1500 | $1,700 | $1.13 | 44d | 1 | 1.09mi |
| 2611 Dogwood Ave Savannah, GA | 2.0 | 1.0 | 822 | $1,700 | $2.07 | 23d | 1 | 1.09mi |
| 2612 Dogwood Ave Savannah, GA | 1.0–3.0 | 1.0–2.0 | 1020 | $1,522 | $1.49 | 14d | 11 | 1.09mi |
| 101 Forrest Ave Savannah, GA | 3.0 | 1.0 | 1367 | $1,895 | $1.39 | 44d | 1 | 1.09mi |
| 114 Oleander Ave Unit Na Savannah, GA | 3.0 | 1.0 | 1128 | $2,100 | $1.86 | 44d | 1 | 1.14mi |
| 1800 E 38th St Savannah, GA | 2.0 | 1.0 | 846 | $1,338 | $1.58 | 44d | 1 | 1.15mi |
| 2217 Beech St Savannah, GA | 2.0 | 1.0 | 959 | $1,850 | $1.93 | 23d | 1 | 1.16mi |
| 2211 Beech St Savannah, GA | 2.0 | 1.0 | 800 | $1,595 | $1.99 | 44d | 1 | 1.17mi |
| 1518 E Park Ave Savannah, GA | 2.0–3.0 | 1.0–2.5 | 1261 | $1,361 | $1.08 | 14d | 6 | 1.23mi |
| 1502 E 31st St Savannah, GA | 3.0 | 2.0 | 1212 | $1,700 | $1.40 | 14d | 1 | 1.26mi |
| 1513 E 37th St Savannah, GA | 3.0 | 1.0 | 1268 | $1,775 | $1.40 | 44d | 1 | 1.30mi |
| 2840 Wicklow St Savannah, GA | 1.0–3.0 | 1.0–2.0 | 1071 | $2,370 | $2.21 | 14d | 50 | 1.33mi |
| 2010 E President St Savannah, GA | 2.0 | 1.0–2.0 | 944 | $1,950 | $2.07 | 14d | 27 | 1.33mi |
| 2002 E 51st St Unit Labs Savannah, GA | 3.0 | 1.0 | 1044 | $1,680 | $1.61 | 44d | 1 | 1.34mi |
| 1403 E Anderson St Savannah, GA | 3.0 | 2.0 | 1300 | $2,400 | $1.85 | 44d | 1 | 1.36mi |
| 1401 E 33rd St Savannah, GA | 3.0 | 1.0 | 960 | $1,650 | $1.72 | 44d | 1 | 1.37mi |
| 3608 Duane Ct Savannah, GA | 2.0 | 1.0 | 975 | $1,095 | $1.12 | 23d | 1 | 1.41mi |
| 3608 Duane Ct Unit C Savannah, GA | 2.0 | 1.0 | 975 | $1,095 | $1.12 | 44d | 1 | 1.41mi |
| 16 Helmken St Savannah, GA | 3.0 | 1.0 | 924 | $1,850 | $2.00 | 14d | 1 | 1.41mi |
| 1436 E 42nd St Savannah, GA | 3.0 | 2.0 | 1447 | $2,290 | $1.58 | 14d | 1 | 1.42mi |
| 1315 E Anderson St Unit 1315 Savannah, GA | 2.0 | 2.0 | 859 | $1,500 | $1.75 | 44d | 1 | 1.43mi |
| 3601 Eastgate Dr Savannah, GA | 3.0 | 2.0 | 1400 | $2,500 | $1.79 | 44d | 1 | 1.45mi |
Listing history 23 events
-
2026-06-18price $99,900 Active 63 DOM
-
2026-06-18days on market $102,500 Active 63 DOM
-
2026-06-17days on market $102,500 Active 62 DOM
-
2026-06-16days on market $102,500 Active 61 DOM
-
2026-06-15days on market $102,500 Active 60 DOM
-
2026-06-14days on market $102,500 Active 58 DOM
-
2026-06-13days on market $102,500 Active 57 DOM
-
2026-06-10days on market $102,500 Active 55 DOM
-
2026-06-09days on market $102,500 Active 54 DOM
-
2026-06-08days on market $102,500 Active 53 DOM
-
2026-06-07days on market $102,500 Active 52 DOM
-
2026-06-05pricedays on market $102,500 Active 49 DOM
-
2026-06-03days on market $104,900 Active 48 DOM
-
2026-06-02days on market $104,900 Active 47 DOM
-
2026-06-01days on market $104,900 Active 46 DOM
-
2026-05-31days on market $104,900 Active 45 DOM
-
2026-05-30days on market $104,900 Active 44 DOM
-
2026-05-15price $112,500 301-char remark
Show marketing remark (301 chars)
This 3 bedroom, 1 bathroom home sits in Savannah’s Avondale neighborhood, and is the perfect opportunity for a savvy investor. In need of repairs, this property is ideal for a flip or buy and hold rental with strong potential. Bring your contractor and your vision to this value add opportunity.
-
2026-05-07price $114,900 301-char remark
Show marketing remark (301 chars)
This 3 bedroom, 1 bathroom home sits in Savannah’s Avondale neighborhood, and is the perfect opportunity for a savvy investor. In need of repairs, this property is ideal for a flip or buy and hold rental with strong potential. Bring your contractor and your vision to this value add opportunity.
-
2026-04-30price $119,900 301-char remark
Show marketing remark (301 chars)
This 3 bedroom, 1 bathroom home sits in Savannah’s Avondale neighborhood, and is the perfect opportunity for a savvy investor. In need of repairs, this property is ideal for a flip or buy and hold rental with strong potential. Bring your contractor and your vision to this value add opportunity.
-
2026-04-23price $124,900 301-char remark
Show marketing remark (301 chars)
This 3 bedroom, 1 bathroom home sits in Savannah’s Avondale neighborhood, and is the perfect opportunity for a savvy investor. In need of repairs, this property is ideal for a flip or buy and hold rental with strong potential. Bring your contractor and your vision to this value add opportunity.
-
2026-04-16$129,900 Active 301-char remark
Show marketing remark (301 chars)
This 3 bedroom, 1 bathroom home sits in Savannah’s Avondale neighborhood, and is the perfect opportunity for a savvy investor. In need of repairs, this property is ideal for a flip or buy and hold rental with strong potential. Bring your contractor and your vision to this value add opportunity.
-
2026-04-03soldstatus $76,312
ⓘ Source: listings_history table (triggers on properties + properties_extension) + one-shot
backfill from property_details.listing_events for pre-trigger history.
Tax reassessment forecast GA · Resets to sale price
- Current annual tax
- $428 · $36/mo
- Projected year-2 tax
- $919 · $77/mo
- Expected delta
- +$491/yr (+$41/mo · 114.6%)
ⓘ Screening estimate from a state-policy table — verify with the county assessor before closing.
Climate risk First Street
- Flood 1/10 Low FEMA zone X (unshaded) · 0% chance over 30 yrs
- Wildfire 3/10 Moderate
- Heat 10/10 Extreme 7 d/yr ≥107°F today · 18 d/yr by 30 yrs out
- Wind 9/10 Extreme 99% chance of damaging wind over 30 yrs
- Air quality 5/10 Major 7 unhealthy d/yr today · 8 by 30 yrs out
Nearby sold comps map
Loading sold comps map…
Walkable amenities ~0.75 mi
Loading nearby amenities…
Taxation est. · year 1
- Rental income
- $20,965
- − Mortgage interest
- −$5,596
- − Property taxes
- −$428
- − Insurance
- −$500
- − Repairs & maintenance
- −$1,677
- − Management
- −$1,677
- − Depreciation
- −$2,906
- Taxable income
- $8,180
- Est. tax owed @ 24.0%
- −$1,963
- After-tax cash flow
- $7,384/yr
For passive investors: Depreciation is non-cash, so a rental often shows a tax loss while cash-flowing — sheltering income. Rental losses are passive: they offset passive income freely, and up to $25,000/yr can offset ordinary (W-2) income if you actively participate and your MAGI is under $100k (phasing out to $0 by $150k); unused losses carry forward. On sale, claimed depreciation is recaptured at up to 25%, and gains may owe capital-gains tax (a 1031 exchange can defer both). Figures are a year-1 estimate at your 24.0% rate — not tax advice; consult a CPA.
Schools (NCES district)
- District
- Savannah-Chatham County
- NCES district ID
- 1301020
- Math proficiency
- 20% ▼ -11.00%
- Reading proficiency
- 26% ▼ -5.00%
- Median HH income
- $47,443
- Composite
- 20.14/100
- National rank
- #8639
- State rank
- #134 of 174 in GA
Livability — Savannah
- Score
- 86/100
- State rank
- #1
- US rank
- #397
Category grades
Schools grade is shown separately in the Schools card above.
Census & demographics
- Census place
- Savannah, GA
- County
- Chatham County · 271,602 people
- City population
- 216,564
- Metro
- Savannah, GA
- Population (ZIP)
- 30,062
- Household income
- $53,303
- Rent vs Own
- Severe rent burden
- 1649.0
Population outlook (Chatham County) Hauer SSP2
- Today (2025)
- 332,584 people
- By 2030
- 355,508 · +6.9%
- By 2040
- 400,030 · +20.3%
- By 2050
- 443,019 · +33.2%
- By 2075
- 534,579 · +60.7%
- By 2100
- 583,863 · +75.6%
Race, ethnicity, and origin ACS 2023
- Neighborhood character
- Majority Black (60%)
- Race & ethnicity
- Black 60% White 33% Two or more races 4% Hispanic / Latino 3% Asian 1%
- Common ancestry
- Romanian 2% Lithuanian 1% Slovak 1%
- Foreign-born
- 4% · Canada, Vietnam
- Languages at home
- 93% English-only · Spanish 3% Other Asian/Pacific 1% French/Haitian/Cajun 1%
Political lean MEDSL · Chatham
- 2024 margin
- D (+18.0) · D 58.6% · R 40.6%
- 2008→2024 swing
- +3.6pp toward D · 2008: 14.4pp · 2024: 18.0pp
- All cycles
- 2024: D+18.0 2020: D+18.8 2016: D+14.5 2012: D+12.0 2008: D+14.4
Not yet ingested
- Civics
- —
Market trends
- HPI YoY
- ▼ -187.86%
- Current HPI
- 310.0764
- Rent YoY
- ▲ 3.62%
- Metro
- Savannah, GA
- State GDP YoY
- ▲ 2.66%
- F500 in state
- 28
Industry mix (Fortune 500 HQ in GA)
| Industry | F500 HQs | Revenue |
|---|---|---|
| Paper / Packaging | 2 | $29B |
|
||
| Retail | 1 | $160B |
|
||
| Transportation / Logistics | 1 | $91B |
|
||
| Airlines | 1 | $62B |
|
||
| Consumer Goods | 1 | $47B |
|
||
| Utilities | 1 | $25B |
|
||
Price history
+47.4% since first listed6 events — show timeline
- 2026-05-15 Price Changed $112,500 Hive MLS
- 2026-05-07 Price Changed $114,900 Hive MLS
- 2026-04-30 Price Changed $119,900 Hive MLS
- 2026-04-23 Price Changed $124,900 Hive MLS
- 2026-04-16 Listed $129,900 Hive MLS
- 2026-04-03 Sold (Public Records) $76,312 Public Records
Property tax history
+9.8%/yrLatest (2025): $428 · +1.6% YoY. Source: county tax records.
Cash-flow waterfall
monthlySold comps — $/sqft
last 12 mo · ≤1 miLoading sold comps…