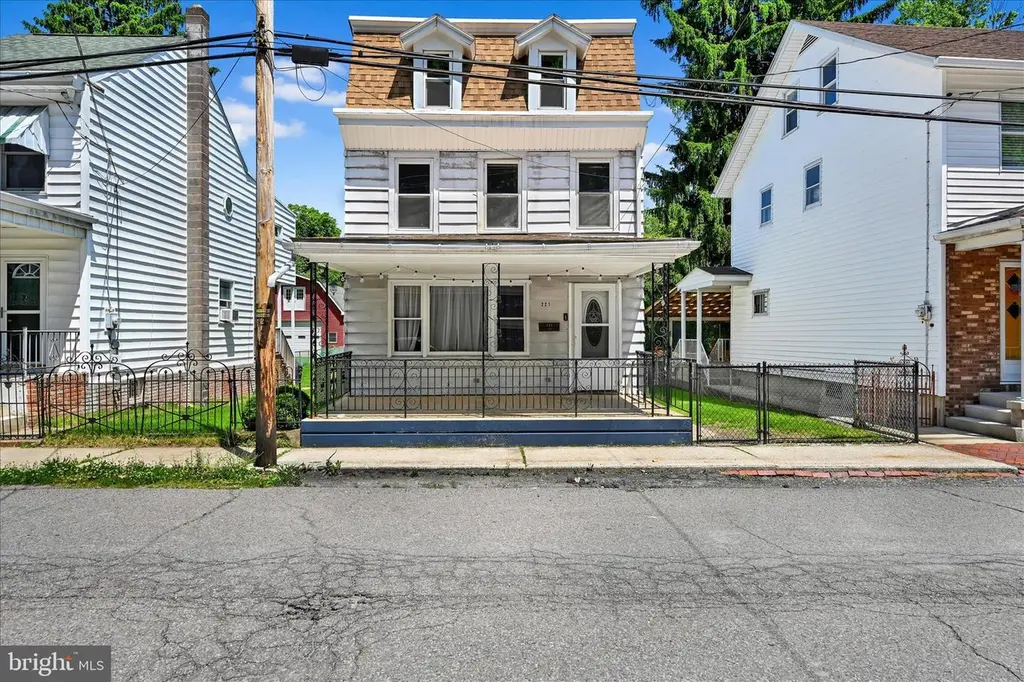
221 S Delaware Ave · Minersville, PA
Flood risk 9/10 · Severe
- FEMA flood zone
- AE
- Chance of flooding over 30 yrs
- 0.99%
- Est. flood insurance / yr
- $1,737 – $8,500
Fire risk 1/10 · Minimal
- Est. fire insurance / yr
- $511 – $949
Heat risk 4/10 · Minor
- Hot days now (above 95°F)
- 7 days/yr
- Hot days in 30 yrs
- 16 days/yr
Wind risk 4/10 · Minor
- Chance of severe wind over 30 yrs
- 8.0%
Air-quality risk 2/10 · Minimal
- Unhealthy air days now
- 1 days/yr
- Unhealthy air days in 30 yrs
- 3 days/yr
Risk factors via First Street. Map © Google.
Why this score? — see what drove the C+ grade
The composite is a weighted blend of 9 inputs, each scored 0–100. Each bar is that input's sub-score; the figure is the points it added to the 100-point composite (weight × sub-score).
- Cash flow +22.3/30.0
- ARV discount +10.7/15.0
- Appreciation +7.3/10.0
- DSCR +7.1/10.0
- 1% rule +5.5/10.0
- Livability +3.5/5.0
- Schools +3.0/10.0
- Rent growth +2.5/5.0
- Condition / age +2.5/5.0
$139,900
🖨 Deal sheet 📄 Offer letter ✓ Due diligence
Listing remarks MLS
Here is your opportunity to own a large single home on a low trafficked street in Minersville. Home features original wood work and hard wood floors. Large picture window in the living room for plenty of natural light. Two more rooms can be used for office space, dining, play room etc. Kitchen is large enough to eat in with plenty of storage areas. Convenient laundry and half bath off of the kitchen. Upstairs has 4 private bedrooms plus an additional room for various needs. And yes, there is an attic for even more storage. Large front porch and additional side porch. The yard is fenced with mature landscaping. Rubber roofs are newer and there are replacement windows. With a little TLC, make this your new home.
Key facts
- Built ins
- Covered rear porch
- 6,534 sq ft lot
Tags
Property features AI
Finance
- Financial info: Land and improvement assessed (assessor values available)
Exterior
- Parking: On-street parking
- Utilities: Public water; Public sewer; Oil heating and hot water
- Home design: Detached property; Building not winterized; Property in good condition; Fee simple ownership
- Construction: Construction includes asbestos, block and metal siding; Other foundation; Above-grade and below-grade structures; Estimated year built
- Exterior features: Fully fenced lot; Lot dimensions approximately 30 x 214; Located in a federal flood zone; No tidal water
Interior
- Kitchen: Electric oven/range; Refrigerator
- Bedrooms: Four bedrooms on the first upper level
- Flooring: Hardwood; Vinyl; Partially carpeted
- Bathrooms: One full bathroom (upper level); One half bathroom (main level)
- Heating & cooling: Hot water baseboard heating (oil-fired)
- Interior features: Partially carpeted areas with hardwood and vinyl flooring; Estimated living area; Partial poured concrete basement with partial finish; Two or more access exits
- Laundry & utility: Washer; Electric dryer; Oil hot water system
Neighborhood map
What this means for you Summary
Snapshot
- This is a 3-bed/1.0-bath single-family listed at $140k.
Deal economics
- At list price, monthly cash flow is $-196 ($-2k/yr) — negative.
- To cash-flow at today's rent, offer at most $105k (24.8% below list).
- Meets the 1% rule at list price ($1k rent vs $140k).
- Recommended offer: $105k (24.8% below list) — sets the bar for cash-flow.
Location & tenants
- Location reads 70/100 on livability (#742 in PA) — a middle-class / working-renter tenant base. Strengths: cost of living A+, health & safety A+, crime A; Watch: schools C-, commute F, employment F.
- Minersville Area SD (town): math 21% / reading 50% proficiency, ranked #420 of 539 in PA (top 78%) — families likely to look elsewhere, expect single-tenant / working-renter base with shorter leases.
- Market conditions: 38 active listings in the ZIP; 169 units permitted in Schuylkill County in 2024 (0 in 5+ unit buildings).
Forward outlook
- In year one you build about $7k of equity ($967 loan paydown + $7k appreciation (4.7% local appreciation)).
- Schuylkill County population projected at -16% by 2050 — secular population decline; favor cash flow + early exit over multi-decade hold.
- By year 5, paydown + projected appreciation supports a ~$32k cash-out refi (75% LTV) — recoverable capital for the next deal without selling this one.
Negotiation context
- Only 1 days on market — expect competitive offers; lowballing is unlikely to land.
- 4 sale attempts since 7y ago with the ask held roughly flat each time — persistent listings suggest the price (not the market) is what's stuck; bring a comps-based counter.
- Current owner paid $30k; list at $140k implies a 366% gain — meaningful room to come down on a strong offer.
Risks & watch-outs
- Watch-outs: flood insurance adds $427/mo; built in 1900 — expect roof / HVAC / electrical / plumbing capex.
- Climate carrying-cost: in FEMA flood zone AE (mandatory federal flood insurance) — expect insurance premiums to compound above CPI over the hold.
Questions for the listing agent
- What do current leases actually rent for vs. the listed asking? Can we see a recent rent roll and the last 12 months of T-12 income?
- Built in 1900 — when were the roof, HVAC, electrical panel, plumbing, and water heater last replaced?
- What's the actual annual flood-insurance premium (NFIP or private), and is the property in a SFHA with mandatory coverage?
- Is there a deadline driving the sale (1031 exchange, divorce, estate, relocation)? That informs how much negotiation room exists.
- What's the average days-on-market for RENTAL listings here right now (not sales)? A rising rental-DOM trend means longer vacancies and softer asking-rent achievability than the comps imply.
- What's the recent tenant-quality profile in this submarket — average credit score on applications, eviction rate, late-payment / NSF rate, and stable-employment percentage? A property-management company in the area should have these aggregated.
- How much new for-sale + rental construction is in the pipeline within 1–3 miles? Heavy new supply typically softens prices + rents 12–24 months out; constrained supply supports both.
Investment metrics
- 1% rule
- 1.05% ✓
- Cap rate
- 8.27%
- Cash-on-cash
- 7.05%
- DSCR
- 1.31
- GRM
- 7.9
CMA / ARV
- ARV (on-the-fly)
- $150,672
- Comps found
- 12
Show comp detail 12 sales within ~0.75 mi
| Address | Dist | Beds/Ba | Sqft | Sold | Price | $/sf | Match |
|---|---|---|---|---|---|---|---|
| 237 Laurel St | 0.27mi | 3/1.0 | 1,800 (+3%) | 10mo | $154,900 | $86 | 74 |
| 233 S South St | 0.32mi | 3/1.5 | 1,640 (-6%) | 5mo | $129,000 | $79 | 68 |
| 18 Lewis | 0.25mi | 3/1.5 | 1,828 (+4%) | 19mo | $85,000 | $46 | 64 |
| 424 Pottsville St | 0.29mi | 2/1.5 (-1) | 1,614 (-8%) | 4mo | $140,000 | $87 | 63 |
| 215 S 4th St | 0.44mi | 4/1.5 (+1) | 1,586 (-10%) | 5mo | $115,000 | $73 | 52 |
| 2 E Edgar Lewis St | 0.59mi | 3/1.5 | 1,600 (-9%) | 5mo | $243,000 | $152 | 52 |
| 314 Arlene St | 0.65mi | 3/1.5 | 1,836 (+5%) | 10mo | $249,900 | $136 | 52 |
| 622 Baker St | 0.52mi | 3/2.0 | 1,579 (-10%) | 7mo | $179,900 | $114 | 49 |
| 321 Lytle St | 0.24mi | 3/1.5 | 2,000 (+14%) | 18mo | $160,000 | $80 | 48 |
| 419 Coal St | 0.37mi | 3/1.5 | 1,490 (-15%) | 10mo | $165,000 | $111 | 48 |
| 539 School St | 0.48mi | 4/1.0 (+1) | 1,900 (+8%) | 17mo | $140,000 | $74 | 44 |
| 447-449 S 3rd St | 0.41mi | 4/2.5 (+1) | 1,525 (-13%) | 11mo | $124,000 | $81 | 39 |
Match score weights: distance 35% · size 25% · config 20% · recency 20%. Top-matched comps best support the ARV.
Projected returns pro-forma
4.65% appreciation · 3.0% rent growth · sell at horizon
- IRR
- 7.0%
- Equity multiple
- 1.44×
- Total profit
- $17,240
- Equity at exit
- $76,335
- IRR
- 9.2%
- Equity multiple
- 2.65×
- Total profit
- $64,819
- Equity at exit
- $129,372
Cash invested: $39,172 (down + closing). Projections, not guarantees.
Landlord ↔ Tenant lean methodology
- Overall (STATE)
- 62 Landlord-Friendly
- State Pennsylvania
- 62 Landlord-Friendly · EVEN
- County
- — inherits STATE
- City
- — inherits STATE
ZIP-level market 17954
- Home prices YoY
- 2.3%
- Active inventory
- 38
- Price-to-rent
- 7.9×
Monthly cashflow live
- Estimated rent
- $1,474 medium interval (Pro) →
- Mortgage (P&I)
- −$734
- Tax from tax record
- −$142 /mo · $1,703/yr
- Insurance
- −$58
- Flood insurance flood zone
- −$427 /mo · $5,118/yr
- HOA
- −$0
- Vacancy / Maint / Mgmt
- −$309
- Net cashflow
- $-196
Break-even live
UW: 25.0% down · 7.5% · 30yr · 1.5% tax · 5.0% vac · 8.0% maint · 8.0% mgmt
Financing live
Cash to close
- Down payment
- $34,975
- Closing costs
- $4,197
- Reserves months
- —
- Total cash needed
- —
Loan-product check · same deal, 3 products live
Conventional
25% down · 7.5% · 30yr
- Down + closing
- —
- Monthly P&I
- —
- Monthly cashflow
- —
- DSCR
- —
- Eligible?
- —
Personal DTI + credit; lowest rate.
DSCR
20% down · 8.5% · 30yr
- Down + closing
- —
- Monthly P&I
- —
- Monthly cashflow
- —
- DSCR
- —
- Eligible?
- —
No personal income docs; deal must DSCR.
Hard money
10% down · 12.0% · 12mo
- Down + closing
- —
- Monthly P&I
- —
- Monthly cashflow
- —
- DSCR
- —
- Eligible?
- —
Short-term bridge; refi at stabilization.
Listing history 3 events
-
2026-06-01status $139,900 Pending 1 DOM
-
2026-05-31remarks 693-char remark
-
2026-05-31$139,900 Active 1 DOM
ⓘ Source: listings_history table (triggers on properties + properties_extension) + one-shot
backfill from property_details.listing_events for pre-trigger history.
Tax reassessment forecast PA · Partial reset (capped growth)
- Current annual tax
- $1,703 · $142/mo
- Projected year-2 tax
- $1,956 · $163/mo
- Expected delta
- +$254/yr (+$21/mo · 14.9%)
ⓘ Screening estimate from a state-policy table — verify with the county assessor before closing.
Climate risk First Street
- Flood 9/10 Extreme FEMA zone AE · 99% chance over 30 yrs
- Wildfire 1/10 Low
- Heat 4/10 Moderate 7 d/yr ≥95°F today · 16 d/yr by 30 yrs out
- Wind 4/10 Moderate 8% chance of damaging wind over 30 yrs
- Air quality 2/10 Low 1 unhealthy d/yr today · 3 by 30 yrs out
Nearby sold comps map
Loading sold comps map…
Walkable amenities ~0.75 mi
Loading nearby amenities…
Taxation est. · year 1
- Rental income
- $17,682
- − Mortgage interest
- −$7,837
- − Property taxes
- −$1,703
- − Insurance
- −$5,818
- − Repairs & maintenance
- −$1,415
- − Management
- −$1,415
- − Depreciation
- −$4,070
- Taxable loss
- −$4,574
- Est. tax savings @ 24.0%
- +$1,098
- After-tax cash flow
- $-1,258/yr
For passive investors: Depreciation is non-cash, so a rental often shows a tax loss while cash-flowing — sheltering income. Rental losses are passive: they offset passive income freely, and up to $25,000/yr can offset ordinary (W-2) income if you actively participate and your MAGI is under $100k (phasing out to $0 by $150k); unused losses carry forward. On sale, claimed depreciation is recaptured at up to 25%, and gains may owe capital-gains tax (a 1031 exchange can defer both). Figures are a year-1 estimate at your 24.0% rate — not tax advice; consult a CPA.
Schools (NCES district)
- District
- Minersville Area SD
- NCES district ID
- 4215510
- Math proficiency
- 21% ▼ -12.00%
- Reading proficiency
- 50% ▼ -8.00%
- Median HH income
- $40,865
- Composite
- 29.77/100
- National rank
- #6433
- State rank
- #420 of 539 in PA
Livability — Minersville
- Score
- 70/100
- State rank
- #742
- US rank
- #7439
Category grades
Schools grade is shown separately in the Schools card above.
Census & demographics
- Census place
- Minersville, PA
- City population
- 27,121
- Population (ZIP)
- 4,564
Population outlook (Schuylkill County) Hauer SSP2
- Today (2025)
- 137,447 people
- By 2030
- 133,121 · -3.1%
- By 2040
- 124,172 · -9.7%
- By 2050
- 115,611 · -15.9%
- By 2075
- 100,796 · -26.7%
- By 2100
- 86,667 · -36.9%
Race, ethnicity, and origin ACS 2023
- Neighborhood character
- Predominantly White (81%)
- Race & ethnicity
- White 81% Two or more races 15% Hispanic / Latino 12%
- Hispanic origin (detail)
- Puerto Rican 11%
- Common ancestry
- Polish 5% Romanian 5% Subsaharan African 4%
- Foreign-born
- 3% · Canada, China
- Languages at home
- 97% English-only · Spanish 2%
Political lean MEDSL · Schuylkill
- 2024 margin
- Solid R (+42.1) · D 28.5% · R 70.6%
- 2008→2024 swing
- -33.4pp toward R · 2008: -8.7pp · 2024: -42.1pp
- All cycles
- 2024: R+42.1 2020: R+39.9 2016: R+43.4 2012: R+13.4 2008: R+8.7
Not yet ingested
- Civics
- —
Market trends
- HPI YoY
- ▲ 4.65%
- Current HPI
- 209.7647
- Rent YoY
- —
- Metro
- —
- State GDP YoY
- ▲ 1.68%
- F500 in state
- 34
Industry mix (Fortune 500 HQ in PA)
| Industry | F500 HQs | Revenue |
|---|---|---|
| Healthcare | 2 | $309B |
|
||
| Insurance | 2 | $27B |
|
||
| Telecommunications / Media | 1 | $124B |
|
||
| Industrial Distribution | 1 | $22B |
|
||
| Financial Services | 1 | $20B |
|
||
| Chemicals / Materials | 1 | $18B |
|
||
Price history
+139.1% since first listed12 events — show timeline
- 2026-05-30 Listed $139,900 BRIGHT MLS
- 2020-07-07 Listing Removed — BRIGHT MLS
- 2020-07-06 Sold (MLS) $30,000 BRIGHT MLS
- 2020-06-16 Pending — BRIGHT MLS
- 2020-06-02 Relisted — BRIGHT MLS
- 2020-05-08 Pending — BRIGHT MLS
- 2020-04-06 Contingent — BRIGHT MLS
- 2020-03-20 Relisted — BRIGHT MLS
- 2020-02-28 Pending — BRIGHT MLS
- 2020-02-18 Price Changed $39,900 BRIGHT MLS
- 2020-01-08 Price Changed $49,000 BRIGHT MLS
- 2019-12-01 Listed $58,500 BRIGHT MLS
Property tax history
+2.7%/yrLatest (2025): $1,703 · +5.6% YoY. Source: county tax records.
Cash-flow waterfall
monthlySold comps — $/sqft
last 12 mo · ≤1 miLoading sold comps…