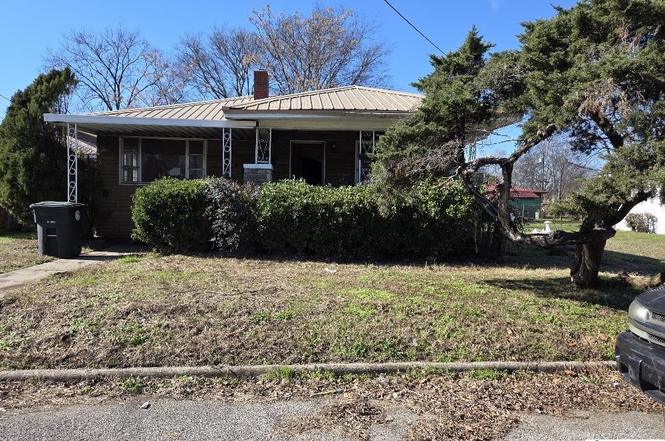
3020 33rd Way N · Birmingham, AL
Flood risk 6/10 · Moderate
- FEMA flood zone
- AE
- Chance of flooding over 30 yrs
- 0.63%
- Est. flood insurance / yr
- $1,737 – $8,500
Fire risk 1/10 · Minimal
- Est. fire insurance / yr
- $916 – $1,700
Heat risk 6/10 · Moderate
- Hot days now (above 106°F)
- 7 days/yr
- Hot days in 30 yrs
- 19 days/yr
Wind risk 6/10 · Moderate
- Chance of severe wind over 30 yrs
- 27.0%
Air-quality risk 5/10 · Moderate
- Unhealthy air days now
- 9 days/yr
- Unhealthy air days in 30 yrs
- 10 days/yr
Risk factors via First Street. Map © Google.
Why this score? — see what drove the B- grade
The composite is a weighted blend of 9 inputs, each scored 0–100. Each bar is that input's sub-score; the figure is the points it added to the 100-point composite (weight × sub-score).
- Cash flow +30.0/30.0
- 1% rule +10.0/10.0
- DSCR +10.0/10.0
- Appreciation +10.0/10.0
- Livability +3.4/5.0
- Rent growth +2.5/5.0
- Condition / age +2.5/5.0
- Schools +0.9/10.0
- ARV discount +0.0/15.0
$39,900
🖨 Deal sheet (PDF) 📄 Offer letter ✓ Due diligence
Listing remarks
Opportunity awaits! A classic Birmingham home offering timeless character and room to make it your own. This property features a covered front porch, mature yard, and traditional layout that reflects the charm of its era. Inside, you’ll find original hardwood flooring, generously sized living areas, and ample natural light throughout. The kitchen provides a functional footprint with space to reimagine storage and finishes, while the overall layout offers flexibility for customization. Whether you’re an investor or a buyer with vision, this home presents a strong canvas for creative updates and long-term value. Conveniently located near major routes, local amenities, and downtown
Key facts
- Covered front porch
- Ample natural light
- Functional footprint
Tags
Neighborhood map
What this means for you Summary
Snapshot
- This is a 3-bed/1.0-bath single-family listed at $40k.
Deal economics
- At list price, monthly cash flow is $165 ($2k/yr) — positive.
- The deal already cash-flows at list — no discount required.
- Meets the 1% rule at list price ($1k rent vs $40k).
- Recommended offer: $36k (9.0% below list) — sets the bar for market timing.
- Cap rate 24.1% vs local median 6.2% in Birmingham — top-decile yield for the area; either an underpriced asset or a hidden risk that comps aren't pricing in. Stress-test before assuming the spread holds.
Location & tenants
- Location reads 67/100 on livability (#78 in AL) — a middle-class / working-renter tenant base. Strengths: commute A+, cost of living A+, housing A+; Watch: amenities C-, crime F, employment F.
- Birmingham City (urban): math 4% / reading 20% proficiency, ranked #116 of 129 in AL (top 90%) — low school quality limits family demand, transient renter base, plan for 1-2y turnover; 82% free/reduced lunch — lower-income household profile, screen leases tightly.
- Zoned schools: Hudson Keight School (math 0% / reading 7%, grade F, #627 of 627 statewide, top 100%, 633 students, 94% FRL).
- Market conditions: 44 active listings in the ZIP; 35 comparable units currently listed for rent nearby; rentals at typical pace (median 25d on market — plan ~3-4 weeks tenant-placement turnaround); 40% of comp listings sitting > 30 days — soft ceiling on asking rent; 2,114 units permitted in Jefferson County in 2024 (556 in 5+ unit buildings).
Forward outlook
- In year one you build about $4k of equity ($276 loan paydown + $4k appreciation (10.0% local appreciation)).
- Jefferson County population projected to shrink 4% by 2050 — rents likely to lag national; underwrite the cash flow, not the appreciation.
- At projected returns (10.0% appreciation + 3.0% rent growth), your $11k cash investment doubles in ~2 years — after that, you're playing with house money.
- By year 7, paydown + projected appreciation supports a ~$31k cash-out refi (75% LTV) — recoverable capital for the next deal without selling this one.
Negotiation context
- It's been on market 97 days — a 9% lower offer ($36k) is reasonable based on typical stale-listing flexibility.
Risks & watch-outs
- Watch-outs: flood insurance adds $427/mo; built in 1951 — expect roof / HVAC / electrical / plumbing capex.
- Climate carrying-cost: in FEMA flood zone AE (mandatory federal flood insurance); major wind risk, 27% chance of damaging wind over 30y; extreme-heat days projected 7→19/yr by 2055 (HVAC capex compounding) — expect insurance premiums to compound above CPI over the hold.
Questions for the listing agent
- It's been on market 97 days. Have you received any prior offers? Is the seller open to a 9% concession, seller financing, or rate buy-down credit?
- Built in 1951 — when were the roof, HVAC, electrical panel, plumbing, and water heater last replaced?
- What's the actual annual flood-insurance premium (NFIP or private), and is the property in a SFHA with mandatory coverage?
- Why hasn't it sold? Are there any deal-killer items the seller is aware of (foundation, flood, title, zoning, code violations)?
- Is there a deadline driving the sale (1031 exchange, divorce, estate, relocation)? That informs how much negotiation room exists.
- Schools are F-rated, which usually means shorter tenancies and higher turnover. Who's the typical renter profile here, and what's been the actual vacancy rate?
- Crime grade is F in this area — have there been break-ins, vandalism, or insurance claims at this property in the last 3 years? What carrier currently insures it and at what premium?
- What's the average days-on-market for RENTAL listings here right now (not sales)? A rising rental-DOM trend means longer vacancies and softer asking-rent achievability than the comps imply.
- What's the recent tenant-quality profile in this submarket — average credit score on applications, eviction rate, late-payment / NSF rate, and stable-employment percentage? A property-management company in the area should have these aggregated.
- How much new for-sale + rental construction is in the pipeline within 1–3 miles? Heavy new supply typically softens prices + rents 12–24 months out; constrained supply supports both.
Investment metrics
- 1% rule
- 2.76% ✓
- Cap rate
- 24.08%
- Cash-on-cash
- 63.53%
- DSCR
- 3.83
- GRM
- 3.0
CMA / ARV
- ARV (on-the-fly)
- $30,861
- Comps found
- 3
Show comp detail 3 sales within ~0.75 mi
| Address | Dist | Beds/Ba | Sqft | Sold | Price | $/sf | Match |
|---|---|---|---|---|---|---|---|
| 3311 33rd Pl N | 0.16mi | 3/1.0 | 1,200 (+5%) | 12mo | $80,000 | $67 | 74 |
| 3429 31st Pl | 0.51mi | 2/2.0 (-1) | 1,120 (-2%) | 19mo | $30,000 | $27 | 48 |
| 3426 31st Pl N | 0.52mi | 3/1.0 | 1,008 (-12%) | 23mo | $8,500 | $8 | 37 |
Match score weights: distance 35% · size 25% · config 20% · recency 20%. Top-matched comps best support the ARV.
Projected returns pro-forma
10.0% appreciation · 3.0% rent growth · sell at horizon
- IRR
- 37.7%
- Equity multiple
- 3.91×
- Total profit
- $32,515
- Equity at exit
- $35,945
- IRR
- 32.6%
- Equity multiple
- 8.88×
- Total profit
- $88,046
- Equity at exit
- $77,517
Cash invested: $11,172 (down + closing). Projections, not guarantees.
Landlord ↔ Tenant lean methodology
- Overall (STATE)
- 90 Strongly Landlord-Friendly
- State Alabama
- 90 Strongly Landlord-Friendly · R+15
- County
- — inherits STATE
- City
- — inherits STATE
ZIP-level market 35207
- Home prices YoY
- 18.7%
- Active inventory
- 44
- Price-to-rent
- 3.0×
Monthly cashflow live
- Estimated rent
- $1,100 high interval (Pro) →
- Mortgage (P&I)
- −$209
- Tax from tax record
- −$51 /mo · $617/yr
- Insurance
- −$17
- Flood insurance flood zone
- −$427 /mo · $5,118/yr
- HOA
- −$0
- Vacancy / Maint / Mgmt
- −$231
- Net cashflow
- $165
Break-even live
Sensitivity live
| Price | -10% $188 | -5% $176 | +0% $165 | +5% $154 | +10% $142 |
|---|---|---|---|---|---|
| Rent | -10% $78 | -5% $121 | +0% $165 | +5% $208 | +10% $252 |
| Rate | -1.0pp $185 | -0.5pp $175 | base $165 | +0.5pp $155 | +1.0pp $144 |
UW: 25.0% down · 7.5% · 30yr · 1.5% tax · 5.0% vac · 8.0% maint · 8.0% mgmt
Financing live
Cash to close
- Down payment
- $9,975
- Closing costs
- $1,197
- Reserves months
- —
- Total cash needed
- —
Loan-product check · same deal, 3 products live
Conventional
25% down · 7.5% · 30yr
- Down + closing
- —
- Monthly P&I
- —
- Monthly cashflow
- —
- DSCR
- —
- Eligible?
- —
Personal DTI + credit; lowest rate.
DSCR
20% down · 8.5% · 30yr
- Down + closing
- —
- Monthly P&I
- —
- Monthly cashflow
- —
- DSCR
- —
- Eligible?
- —
No personal income docs; deal must DSCR.
Hard money
10% down · 12.0% · 12mo
- Down + closing
- —
- Monthly P&I
- —
- Monthly cashflow
- —
- DSCR
- —
- Eligible?
- —
Short-term bridge; refi at stabilization.
Rent comps 35 comps
| Address | Beds | Baths | Sqft | Rent | $/sqft | DOM | Units | Dist |
|---|---|---|---|---|---|---|---|---|
| 3373 33rd Pl N Birmingham, AL | 3.0 | 1.0 | 912 | $1,150 | $1.26 | 4d | 1 | 0.34mi |
| 3376 34th St N Birmingham, AL | 3.0 | 1.0 | 928 | $1,200 | $1.29 | 13d | 1 | 0.35mi |
| 3376 34th St N Birmingham, AL | 3.0 | 2.0 | 928 | $1,200 | $1.29 | 25d | 1 | 0.35mi |
| 3376 34th Ave N Birmingham, AL | 3.0 | 2.0 | 928 | $1,200 | $1.29 | 4d | 1 | 0.37mi |
| 2129 30th Pl N Birmingham, AL | 3.0 | 1.0 | 1042 | $1,000 | $0.96 | 25d | 1 | 0.58mi |
| 3016 33rd Ct N Birmingham, AL | 3.0 | 1.0 | 1012 | $1,100 | $1.09 | 45d | 1 | 0.59mi |
| 3311 16th Ave N Unit 3323 Birmingham, AL | 2.0 | 1.0 | 750 | $850 | $1.13 | 3d | 1 | 0.80mi |
| 3311 16th Ave N Unit 3321 Birmingham, AL | 2.0 | 1.0 | 750 | $850 | $1.13 | 25d | 1 | 0.80mi |
| 3311 16th Ave N Unit 3317 Birmingham, AL | 2.0 | 1.0 | 750 | $850 | $1.13 | 45d | 1 | 0.80mi |
| 1515 36th Pl N Birmingham, AL | 3.0 | 2.0 | 1204 | $1,273 | $1.06 | 45d | 1 | 0.88mi |
| 3509 Norwood Blvd Birmingham, AL | 2.0 | 1.0 | 943 | $1,100 | $1.17 | 4d | 1 | 0.89mi |
| 3001 Norwood Blvd Birmingham, AL | 2.0 | 2.0 | 1092 | $1,500 | $1.37 | 4d | 1 | 0.92mi |
| 3708 42nd Ave N Birmingham, AL | 3.0 | 1.0 | 876 | $950 | $1.08 | 45d | 1 | 0.96mi |
| 1405 33rd St N Birmingham, AL | 3.0 | 1.0 | 952 | $990 | $1.04 | 25d | 1 | 0.99mi |
| 1444 31st St N Birmingham, AL | 4.0 | 1.0 | 1014 | $1,295 | $1.28 | 25d | 1 | 1.04mi |
| 2608 20th Ave N Birmingham, AL | 2.0 | 1.0 | 750 | $895 | $1.19 | 45d | 1 | 1.12mi |
| 2608 20th Ave N Unit 5 Birmingham, AL | 2.0 | 1.0 | 750 | $875 | $1.17 | 45d | 1 | 1.12mi |
| 4316 Gadsden St Birmingham, AL | 2.0 | 1.0 | 1048 | $1,100 | $1.05 | 4d | 1 | 1.19mi |
| 2108 25th St N Birmingham, AL | 4.0 | 2.0 | 1446 | $1,300 | $0.90 | 45d | 1 | 1.22mi |
| 2428 21st Ave N Birmingham, AL | 2.0 | 1.0 | 700 | $975 | $1.39 | 3d | 1 | 1.24mi |
| 2428 21st Ave N Birmingham, AL | 2.0 | 1.0 | 700 | $975 | $1.39 | 4d | 1 | 1.24mi |
| 2428 21st Ave N Birmingham, AL | 2.0 | 1.0 | 700 | $975 | $1.39 | 12d | 1 | 1.24mi |
| 1303 Main St Birmingham, AL | 4.0 | 2.0 | 1432 | $1,300 | $0.91 | 45d | 1 | 1.27mi |
| 3823 43rd Ave N Birmingham, AL | 3.0 | 2.0 | 1500 | $1,200 | $0.80 | 25d | 1 | 1.27mi |
| 3823 43rd Ave N Birmingham, AL | 3.0 | 2.0 | 1500 | $1,200 | $0.80 | 45d | 1 | 1.27mi |
| 3920 11th Ave N Birmingham, AL | 3.0 | 2.0 | 1200 | $1,025 | $0.85 | 3d | 1 | 1.30mi |
| 2400 19th Ave N Unit B Birmingham, AL | 2.0 | 1.0 | 750 | $850 | $1.13 | 23d | 1 | 1.32mi |
| 4244 Jackson St Birmingham, AL | 3.0 | 1.0 | 858 | $1,100 | $1.28 | 45d | 1 | 1.37mi |
| 4028 40th Ave N Birmingham, AL | 3.0 | 1.0 | 1186 | $950 | $0.80 | 45d | 1 | 1.37mi |
| 2300 21st Ave N Birmingham, AL | 2.0 | 1.0 | 700 | $880 | $1.26 | 45d | 2 | 1.38mi |
| 1017 Cahaba St Birmingham, AL | 2.0 | 2.0 | 1035 | $1,350 | $1.30 | 4d | 1 | 1.38mi |
| 2000 Stouts Rd Birmingham, AL | 2.0 | 1.0 | 700 | $880 | $1.26 | 45d | 2 | 1.43mi |
| 2129 30th Ave N Birmingham, AL | 3.0 | 1.0 | 1042 | $1,000 | $0.96 | 45d | 1 | 1.45mi |
| 4301 Greenwood St Birmingham, AL | 3.0 | 1.0 | 1140 | $1,025 | $0.90 | 4d | 1 | 1.46mi |
| 1911 19th Ct N Apt 1 Birmingham, AL | 2.0 | 1.0 | 750 | $845 | $1.13 | 13d | 1 | 1.49mi |
Listing history 5 events
-
2026-04-22status Pending
-
2026-04-14historical Contingent
-
2026-03-19price $39,900
-
2026-02-17price $44,900
-
2026-01-14$50,900 Active
ⓘ Source: listings_history table (triggers on properties + properties_extension) + one-shot
backfill from property_details.listing_events for pre-trigger history.
Tax reassessment forecast AL · Resets to sale price
- Current annual tax
- $617 · $51/mo
- Projected year-2 tax
- $617 · $51/mo
- Expected delta
- $0/yr ($0/mo · 0.0%)
ⓘ Screening estimate from a state-policy table — verify with the county assessor before closing.
Climate risk First Street
- Flood 6/10 Major FEMA zone AE · 63% chance over 30 yrs
- Wildfire 1/10 Low
- Heat 6/10 Major 7 d/yr ≥106°F today · 19 d/yr by 30 yrs out
- Wind 6/10 Major 27% chance of damaging wind over 30 yrs
- Air quality 5/10 Major 9 unhealthy d/yr today · 10 by 30 yrs out
Nearby sold comps map
Loading sold comps map…
Walkable amenities ~0.75 mi
Loading nearby amenities…
Taxation est. · year 1
- Rental income
- $13,196
- − Mortgage interest
- −$2,235
- − Property taxes
- −$617
- − Insurance
- −$5,318
- − Repairs & maintenance
- −$1,056
- − Management
- −$1,056
- − Depreciation
- −$1,161
- Taxable income
- $1,754
- Est. tax owed @ 24.0%
- −$421
- After-tax cash flow
- $1,558/yr
For passive investors: Depreciation is non-cash, so a rental often shows a tax loss while cash-flowing — sheltering income. Rental losses are passive: they offset passive income freely, and up to $25,000/yr can offset ordinary (W-2) income if you actively participate and your MAGI is under $100k (phasing out to $0 by $150k); unused losses carry forward. On sale, claimed depreciation is recaptured at up to 25%, and gains may owe capital-gains tax (a 1031 exchange can defer both). Figures are a year-1 estimate at your 24.0% rate — not tax advice; consult a CPA.
Schools (NCES district)
- District
- Birmingham City
- NCES district ID
- 0100390
- Math proficiency
- 4% ▼ -17.00%
- Reading proficiency
- 20% ▼ -4.00%
- Median HH income
- $31,988
- Composite
- 9.49/100
- National rank
- #9850
- State rank
- #116 of 129 in AL
Livability — Birmingham
- Score
- 67/100
- State rank
- #78
- US rank
- #10412
Category grades
Schools grade is shown separately in the Schools card above.
Census & demographics
- Census place
- Birmingham, AL
- City population
- 210,422
- Population (ZIP)
- 6,824
Population outlook (Jefferson County) Hauer SSP2
- Today (2025)
- 669,185 people
- By 2030
- 669,694 · +0.1%
- By 2040
- 661,388 · -1.2%
- By 2050
- 643,086 · -3.9%
- By 2075
- 577,267 · -13.7%
- By 2100
- 474,758 · -29.1%
Race, ethnicity, and origin ACS 2023
- Neighborhood character
- Predominantly Black (86%)
- Race & ethnicity
- Black 86% White 7% Hispanic / Latino 6%
- Hispanic origin (detail)
- Mexican 5%
- Common ancestry
- Romanian 1% Hispanic 1%
- Foreign-born
- 3% · Canada
- Languages at home
- 92% English-only · Spanish 6% French/Haitian/Cajun 1%
Political lean MEDSL · Jefferson
- 2024 margin
- D (+10.4) · D 54.6% · R 44.2% · Other 1.2%
- 2008→2024 swing
- +5.4pp toward D · 2008: 5.1pp · 2024: 10.4pp
- All cycles
- 2024: D+10.4 2020: D+13.2 2016: D+7.2 2012: D+6.0 2008: D+5.1
Not yet ingested
- Civics
- —
Market trends
- HPI YoY
- ▲ 35.95%
- Current HPI
- 228.5664
- Rent YoY
- —
- Metro
- —
- State GDP YoY
- ▲ 2.94%
- F500 in state
- 4
Industry mix (Fortune 500 HQ in AL)
| Industry | F500 HQs | Revenue |
|---|---|---|
| Financial Services | 1 | $8B |
|
||
| Healthcare | 1 | $5B |
|
||
Price history
-21.6% since first listed5 events — show timeline
- 2026-04-22 Pending — Greater Alabama MLS
- 2026-04-14 Contingent — Greater Alabama MLS
- 2026-03-19 Price Changed $39,900 Greater Alabama MLS
- 2026-02-17 Price Changed $44,900 Greater Alabama MLS
- 2026-01-14 Listed $50,900 Greater Alabama MLS
Property tax history
+8.8%/yrLatest (2025): $617 · +0.0% YoY. Source: county tax records.
Cash-flow waterfall
monthlySold comps — $/sqft
last 12 mo · ≤1 miLoading sold comps…