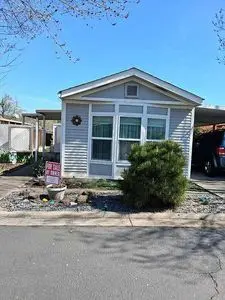
4624 S Pacific Hwy · Phoenix, OR
Flood risk 1/10 · Minimal
- FEMA flood zone
- X (unshaded)
- Chance of flooding over 30 yrs
- 0.0%
- Est. flood insurance / yr
- $507 – $1,088
Fire risk 7/10 · Major
- Est. fire insurance / yr
- $498 – $926
Heat risk 6/10 · Moderate
- Hot days now (above 96°F)
- 7 days/yr
- Hot days in 30 yrs
- 15 days/yr
Wind risk 1/10 · Minimal
- Chance of severe wind over 30 yrs
- —
Air-quality risk 10/10 · Severe
- Unhealthy air days now
- 27 days/yr
- Unhealthy air days in 30 yrs
- 30 days/yr
Risk factors via First Street. Map © Google.
Why this score? — see what drove the B- grade
The composite is a weighted blend of 9 inputs, each scored 0–100. Each bar is that input's sub-score; the figure is the points it added to the 100-point composite (weight × sub-score).
- Cash flow +30.0/30.0
- 1% rule +10.0/10.0
- DSCR +10.0/10.0
- ARV discount +7.5/15.0
- Livability +4.2/5.0
- Rent growth +2.5/5.0
- Condition / age +2.5/5.0
- Schools +1.9/10.0
- Appreciation +0.0/10.0
$101,000
🖨 Deal sheet (PDF) 📄 Offer letter ✓ Due diligence
Listing remarks
HOME FOR SALE BY OWNER 4624 S. PACIFIC HWY. #25 PHOENIX, OR 97535 2bdrm/2bth manufactured home located in a highly sought-after senior living community. The property was constructed in 1985 by Glenriver Ind, Inc. , and underwent renovation in 2010. This home is fully furnished, turn-key and move-in ready. Just bring your clothes and other necessities. The kitchen has been completely rebuilt and has large tiled center island, an added skylight. Bamboo hardwood flooring in the kitchen, hallway, and main bedroom, while the living room and guest bedroom are carpeted. Solar lighting in both bathrooms. The rwalls are drywalled and insulated, and all windows are vinyl sliding types equipped wit
Key facts
- Renovation in 2010
- Fully furnished
- Added skylight
Tags
Neighborhood map
What this means for you Summary
Snapshot
- This is a 2-bed/2.0-bath other listed at $101k.
Deal economics
- At list price, monthly cash flow is $581 ($7k/yr) — positive.
- The deal already cash-flows at list — no discount required.
- Meets the 1% rule at list price ($2k rent vs $101k).
- Recommended offer: $98k (3.0% below list) — sets the bar for market timing.
- Cap rate 13.2% vs local median 5.0% in Phoenix — top-decile yield for the area; either an underpriced asset or a hidden risk that comps aren't pricing in. Stress-test before assuming the spread holds.
Location & tenants
- Location reads 83/100 on livability (#38 in OR, #884 nationally) — a professional / high-income tenant draw. Strengths: amenities A+, commute A+, health & safety A+; Watch: crime C-, employment D+.
- Phoenix-Talent SD 4 (suburban): math 14% / reading 32% proficiency, ranked #58 of 58 in OR (top 100%) — low school quality limits family demand, transient renter base, plan for 1-2y turnover.
- Zoned schools: Phoenix Elementary School (math 15% / reading 15%, grade F, #392 of 412 statewide, top 96%, 300 students, 87% FRL); Talent Middle School (math 10% / reading 33%, grade F, #122 of 128 statewide, top 95%, 473 students, 79% FRL); Phoenix High School (math 24% / reading 70%, grade D-, #56 of 143 statewide, top 41%, 700 students, 79% FRL) — zoned schools average 82% FRL vs 60% district-wide (22 pts higher); higher-poverty schools than district average — tighter screening recommended.
- Market conditions: 65 active listings in the ZIP; 5 comparable units currently listed for rent nearby; rentals at typical pace (median 23d on market — plan ~3-4 weeks tenant-placement turnaround); 904 units permitted in Jackson County in 2024 (212 in 5+ unit buildings).
Forward outlook
- Local home prices are declining (-3.0%/yr); year-one equity from $698 of loan paydown is wiped out by about $3k of value loss. Plan a longer hold.
- Jackson County population projected at +17% by 2050 — long-run rental-demand tailwind backs the buy-and-hold thesis.
- At projected returns (-3.0% appreciation + 3.0% rent growth), your $28k cash investment doubles in ~5 years — after that, you're playing with house money.
Negotiation context
- It's been on market 40 days — a 3% lower offer ($98k) is reasonable based on typical stale-listing flexibility.
- 26 sale attempts since 30y ago with the ask held roughly flat each time — persistent listings suggest the price (not the market) is what's stuck; bring a comps-based counter.
- Current owner paid $65k; list at $101k implies a 55% gain — meaningful room to come down on a strong offer.
Risks & watch-outs
- Climate carrying-cost: major wildfire risk; extreme-heat days projected 7→15/yr by 2055 (HVAC capex compounding) — expect insurance premiums to compound above CPI over the hold.
Questions for the listing agent
- It's been on market 40 days. Have you received any prior offers? Is the seller open to a 3% concession, seller financing, or rate buy-down credit?
- Is there a deadline driving the sale (1031 exchange, divorce, estate, relocation)? That informs how much negotiation room exists.
- Schools are D-rated, which usually means shorter tenancies and higher turnover. Who's the typical renter profile here, and what's been the actual vacancy rate?
- What's the average days-on-market for RENTAL listings here right now (not sales)? A rising rental-DOM trend means longer vacancies and softer asking-rent achievability than the comps imply.
- What's the recent tenant-quality profile in this submarket — average credit score on applications, eviction rate, late-payment / NSF rate, and stable-employment percentage? A property-management company in the area should have these aggregated.
- How much new for-sale + rental construction is in the pipeline within 1–3 miles? Heavy new supply typically softens prices + rents 12–24 months out; constrained supply supports both.
Investment metrics
- 1% rule
- 1.60% ✓
- Cap rate
- 13.19%
- Cash-on-cash
- 24.63%
- DSCR
- 2.10
- GRM
- 5.2
CMA / ARV
No comps found within radius.
Projected returns pro-forma
-3.0% appreciation · 3.0% rent growth · sell at horizon
- IRR
- 18.0%
- Equity multiple
- 1.73×
- Total profit
- $20,634
- Equity at exit
- $15,059
- IRR
- 26.5%
- Equity multiple
- 3.32×
- Total profit
- $65,680
- Equity at exit
- $8,733
Cash invested: $28,280 (down + closing). Projections, not guarantees.
Landlord ↔ Tenant lean methodology
- Overall (STATE)
- 28 Tenant-Leaning
- State Oregon
- 28 Tenant-Leaning · D+6
- County
- — inherits STATE
- City
- — inherits STATE
ZIP-level market 97535
- Home prices YoY
- -26.5%
- Active inventory
- 65
- Price-to-rent
- 5.2×
Monthly cashflow live
- Estimated rent
- $1,618 high interval (Pro) →
- Mortgage (P&I)
- −$530
- Tax est. 1.5%
- −$126 /mo · $1,515/yr
- Insurance
- −$42
- HOA
- −$0
- Vacancy / Maint / Mgmt
- −$340
- Net cashflow
- $581
Break-even live
Sensitivity live
| Price | -10% $650 | -5% $615 | +0% $581 | +5% $546 | +10% $511 |
|---|---|---|---|---|---|
| Rent | -10% $453 | -5% $517 | +0% $581 | +5% $644 | +10% $708 |
| Rate | -1.0pp $631 | -0.5pp $606 | base $581 | +0.5pp $554 | +1.0pp $528 |
UW: 25.0% down · 7.5% · 30yr · 1.5% tax · 5.0% vac · 8.0% maint · 8.0% mgmt
Financing live
Cash to close
- Down payment
- $25,250
- Closing costs
- $3,030
- Reserves months
- —
- Total cash needed
- —
Loan-product check · same deal, 3 products live
Conventional
25% down · 7.5% · 30yr
- Down + closing
- —
- Monthly P&I
- —
- Monthly cashflow
- —
- DSCR
- —
- Eligible?
- —
Personal DTI + credit; lowest rate.
DSCR
20% down · 8.5% · 30yr
- Down + closing
- —
- Monthly P&I
- —
- Monthly cashflow
- —
- DSCR
- —
- Eligible?
- —
No personal income docs; deal must DSCR.
Hard money
10% down · 12.0% · 12mo
- Down + closing
- —
- Monthly P&I
- —
- Monthly cashflow
- —
- DSCR
- —
- Eligible?
- —
Short-term bridge; refi at stabilization.
Rent comps 5 comps
| Address | Beds | Baths | Sqft | Rent | $/sqft | DOM | Units | Dist |
|---|---|---|---|---|---|---|---|---|
| 600 W 1st St Phoenix, OR | 2.0 | 1.0 | 864 | $1,395 | $1.61 | 22d | 1 | 0.66mi |
| 110 6th St Phoenix, OR | 3.0 | 1.0 | 1040 | $1,895 | $1.82 | 22d | 1 | 0.89mi |
| 110 6th St Phoenix, OR | 3.0 | 1.0 | 1040 | $1,895 | $1.82 | 15d | 1 | 0.89mi |
| 310 Independence Cir Apt D Phoenix, OR | 2.0 | 1.0 | 850 | $1,595 | $1.88 | 15d | 1 | 0.93mi |
| 204 Cheryl Ln Unit J Phoenix, OR | 2.0 | 1.5 | 1008 | $1,350 | $1.34 | 45d | 1 | 1.16mi |
Listing history 50 events
-
2026-06-21days on market $101,000 Active 40 DOM
-
2026-06-19days on market $101,000 Active 38 DOM
-
2026-06-18days on market $101,000 Active 37 DOM
-
2026-06-17days on market $101,000 Active 36 DOM
-
2026-06-16pricedays on market $101,000 Active 35 DOM
-
2026-06-15days on market $104,777 Active 34 DOM
-
2026-06-14days on market $104,777 Active 32 DOM
-
2026-06-13days on market $104,777 Active 31 DOM
-
2026-06-10days on market $104,777 Active 29 DOM
-
2026-06-09days on market $104,777 Active 28 DOM
-
2026-06-08days on market $104,777 Active 27 DOM
-
2026-06-07days on market $104,777 Active 26 DOM
-
2026-06-02days on market $104,777 Active 21 DOM
-
2026-06-01days on market $104,777 Active 20 DOM
-
2026-05-31days on market $104,777 Active 19 DOM
-
2026-05-30days on market $104,777 Active 18 DOM
-
2026-05-12$104,777 Active 1375-char remark
-
2020-04-26historical
-
2020-04-25historical
-
2020-04-25historical
-
2020-04-25historical
-
2020-04-25historical
-
2020-04-25historical
-
2007-08-01$34,900
-
2004-05-14soldstatus $65,000
-
2004-03-01$69,900
-
2003-05-15soldstatus $24,900
-
2002-12-30$27,900
-
2002-09-25$27,500
-
2002-04-08$43,250
-
2002-02-18soldstatus $62,500
-
2001-12-14soldstatus $29,500
-
2001-09-19$65,000
-
2001-09-17$49,900
-
2001-08-14soldstatus $27,800
-
2001-07-17$49,900
-
2001-07-09soldstatus $25,000
-
2001-06-21$32,500
-
2001-06-12$29,900
-
2000-08-25$29,500
-
2000-08-08soldstatus $66,000
-
2000-05-01$67,700
-
2000-03-25soldstatus $59,000
-
2000-03-23$59,900
-
2000-03-09soldstatus $47,000
-
2000-03-06soldstatus $50,000
-
2000-01-21$54,900
-
2000-01-19$49,000
-
1999-08-01soldstatus $46,000
-
1999-06-25$49,000
ⓘ Source: listings_history table (triggers on properties + properties_extension) + one-shot
backfill from property_details.listing_events for pre-trigger history.
Climate risk First Street
- Flood 1/10 Low FEMA zone X (unshaded) · 0% chance over 30 yrs
- Wildfire 7/10 Severe
- Heat 6/10 Major 7 d/yr ≥96°F today · 15 d/yr by 30 yrs out
- Wind 1/10 Low
- Air quality 10/10 Extreme 27 unhealthy d/yr today · 30 by 30 yrs out
Nearby sold comps map
Loading sold comps map…
Walkable amenities ~0.75 mi
Loading nearby amenities…
Taxation est. · year 1
- Rental income
- $19,421
- − Mortgage interest
- −$5,658
- − Property taxes
- −$1,515
- − Insurance
- −$505
- − Repairs & maintenance
- −$1,554
- − Management
- −$1,554
- − Depreciation
- −$2,938
- Taxable income
- $5,698
- Est. tax owed @ 24.0%
- −$1,368
- After-tax cash flow
- $5,599/yr
For passive investors: Depreciation is non-cash, so a rental often shows a tax loss while cash-flowing — sheltering income. Rental losses are passive: they offset passive income freely, and up to $25,000/yr can offset ordinary (W-2) income if you actively participate and your MAGI is under $100k (phasing out to $0 by $150k); unused losses carry forward. On sale, claimed depreciation is recaptured at up to 25%, and gains may owe capital-gains tax (a 1031 exchange can defer both). Figures are a year-1 estimate at your 24.0% rate — not tax advice; consult a CPA.
Schools (NCES district)
- District
- Phoenix-Talent SD 4
- NCES district ID
- 4109630
- Math proficiency
- 14% ▼ -9.00%
- Reading proficiency
- 32% ▼ -8.00%
- Median HH income
- $38,625
- Composite
- 19.24/100
- National rank
- #8809
- State rank
- #58 of 58 in OR
Livability — Phoenix
- Score
- 83/100
- State rank
- #38
- US rank
- #884
Category grades
Schools grade is shown separately in the Schools card above.
Census & demographics
- Census place
- Phoenix, OR
- City population
- 4,766
- Population (ZIP)
- 4,766
Population outlook (Jackson County) Hauer SSP2
- Today (2025)
- 234,433 people
- By 2030
- 243,834 · +4.0%
- By 2040
- 259,717 · +10.8%
- By 2050
- 273,269 · +16.6%
- By 2075
- 300,624 · +28.2%
- By 2100
- 305,256 · +30.2%
Race, ethnicity, and origin ACS 2023
- Neighborhood character
- Predominantly White (77%)
- Race & ethnicity
- White 77% Hispanic / Latino 13% Two or more races 6%
- Hispanic origin (detail)
- Mexican 11%
- Common ancestry
- Italian 3% Lithuanian 3% Slovak 2%
- Foreign-born
- 5% · Canada
- Languages at home
- 90% English-only · Spanish 8% Russian/Polish/Slavic 1%
Political lean MEDSL · Jackson
- 2024 margin
- Lean R (+6.4) · D 45.5% · R 51.9% · Other 2.6%
- 2008→2024 swing
- -6.5pp toward R · 2008: 0.1pp · 2024: -6.4pp
- All cycles
- 2024: R+6.4 2020: R+3.5 2016: R+9.2 2012: R+5.0 2008: D+0.1
Not yet ingested
- Civics
- —
Market trends
- HPI YoY
- ▼ -94.62%
- Current HPI
- 262.1708
- Rent YoY
- —
- Metro
- —
- State GDP YoY
- ▲ 2.05%
- F500 in state
- 2
Industry mix (Fortune 500 HQ in OR)
| Industry | F500 HQs | Revenue |
|---|---|---|
| Consumer Goods | 1 | $51B |
|
||
Price history
-89.9% since first listed52 events — show timeline
- 2026-06-16 Price Changed $101,000 FSBO.com
- 2026-05-12 Listed $104,777 FSBO.com
- 2020-04-26 Listing Removed — MLSCO
- 2020-04-25 Listing Removed — MLSCO
- 2020-04-25 Listing Removed — MLSCO
- 2020-04-25 Listing Removed — MLSCO
- 2020-04-25 Listing Removed — MLSCO
- 2020-04-25 Listing Removed — MLSCO
- 2007-08-01 Listed $34,900 MLSCO
- 2004-05-14 Sold (MLS) $65,000 MLSCO
- 2004-03-01 Listed $69,900 MLSCO
- 2003-05-15 Sold (MLS) $24,900 MLSCO
- 2002-12-30 Listed $27,900 MLSCO
- 2002-09-25 Listed $27,500 MLSCO
- 2002-04-08 Listed $43,250 MLSCO
- 2002-02-18 Sold (MLS) $62,500 MLSCO
- 2001-12-14 Sold (MLS) $29,500 MLSCO
- 2001-09-19 Listed $65,000 MLSCO
- 2001-09-17 Listed $49,900 MLSCO
- 2001-08-14 Sold (MLS) $27,800 MLSCO
- 2001-07-17 Listed $49,900 MLSCO
- 2001-07-09 Sold (MLS) $25,000 MLSCO
- 2001-06-21 Listed $32,500 MLSCO
- 2001-06-12 Listed $29,900 MLSCO
- 2000-08-25 Listed $29,500 MLSCO
- 2000-08-08 Sold (MLS) $66,000 MLSCO
- 2000-05-01 Listed $67,700 MLSCO
- 2000-03-25 Sold (MLS) $59,000 MLSCO
- 2000-03-23 Listed $59,900 MLSCO
- 2000-03-09 Sold (MLS) $47,000 MLSCO
- 2000-03-06 Sold (MLS) $50,000 MLSCO
- 2000-01-21 Listed $54,900 MLSCO
- 2000-01-19 Listed $49,000 MLSCO
- 1999-08-01 Sold (MLS) $46,000 MLSCO
- 1999-06-25 Listed $49,000 MLSCO
- 1999-02-05 Listed $62,000 MLSCO
- 1998-07-31 Listed $63,000 MLSCO
- 1998-07-30 Sold (MLS) $63,000 MLSCO
- 1997-09-20 Sold (MLS) $44,000 MLSCO
- 1997-09-02 Listed $48,900 MLSCO
- 1997-06-16 Listed $49,900 MLSCO
- 1997-04-10 Sold (MLS) $42,500 MLSCO
- 1997-02-14 Listed $42,500 MLSCO
- 1997-01-27 Sold (MLS) $31,000 MLSCO
- 1997-01-20 Sold (MLS) $55,000 MLSCO
- 1997-01-15 Sold (MLS) $63,500 MLSCO
- 1997-01-08 Listed $31,500 MLSCO
- 1996-10-27 Listed $56,900 MLSCO
- 1996-10-16 Listed $67,900 MLSCO
- 1996-07-27 Sold (MLS) $28,000 MLSCO
- 1996-05-04 Listed $31,500 MLSCO
- 1989-10-12 Sold (Public Records) $1,000,000 Public Records
Property tax history
+2.4%/yrLatest (2025): $17 · +2.2% YoY. Source: county tax records.
Cash-flow waterfall
monthlySold comps — $/sqft
last 12 mo · ≤1 miLoading sold comps…