31046 Pine Knot Rd · Pinehurst, TX
Flood risk 1/10 · Minimal
- FEMA flood zone
- X (unshaded)
- Chance of flooding over 30 yrs
- 0.0%
- Est. flood insurance / yr
- $507 – $1,088
Fire risk 3/10 · Minor
- Est. fire insurance / yr
- $1,222 – $2,270
Heat risk 8/10 · Major
- Hot days now (above 111°F)
- 7 days/yr
- Hot days in 30 yrs
- 23 days/yr
Wind risk 8/10 · Major
- Chance of severe wind over 30 yrs
- 99.0%
Air-quality risk 2/10 · Minimal
- Unhealthy air days now
- 2 days/yr
- Unhealthy air days in 30 yrs
- 2 days/yr
Risk factors via First Street. Map © Google.
Why this score? — see what drove the C+ grade
The composite is a weighted blend of 9 inputs, each scored 0–100. Each bar is that input's sub-score; the figure is the points it added to the 100-point composite (weight × sub-score).
- Cash flow +22.7/30.0
- Appreciation +10.0/10.0
- DSCR +7.3/10.0
- 1% rule +5.2/10.0
- ARV discount +4.0/15.0
- Schools +3.9/10.0
- Livability +2.8/5.0
- Rent growth +2.6/5.0
- Condition / age +2.5/5.0
$185,000
🖨 Deal sheet 📄 Offer letter ✓ Due diligence
Listing remarks
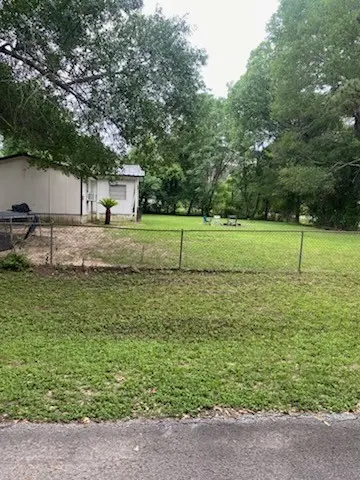
Welcome to 31046 Pine Knot Rd in Magnolia, TX a unique opportunity offering space, privacy, and endless potential! Situated on a generous lot, this property provides the peaceful country feel buyers are searching for while still being conveniently located near FM 1488, Hwy 249, shopping, dining, and everyday essentials. The property features a mobile home with plenty of room to customize, expand, or enjoy as-is. Whether you're looking for a primary residence, investment opportunity, or a place to enjoy wide open spaces, this property delivers flexibility and value. The expansive outdoor area is perfect for entertaining, gardening, parking equipment, or simply relaxing and enjoying the quiet
Key facts
- Generous lot
- Versatile property
- Mature trees
Tags
Property features AI
Finance
- Financial info: Lease not considered
Exterior
- Parking: Attached garage; Additional parking
- Utilities: Public water; Public sewer
- Home design: Residential property; Built in 1973
- Construction: Construction materials: Unknown
- Exterior features: Corner lot
Interior
- Kitchen: Dishwasher; Electric oven; Electric range; Microwave
- Bedrooms: Bedroom on the first level (approx. 12 x 11)
- Bathrooms: 2 full bathrooms
- Heating & cooling: Heating present (window unit); Window unit(s) for cooling
- Interior features: Washer hookup available; Disposal
- Laundry & utility: Washer hookup
Neighborhood map
What this means for you Summary
Snapshot
- This is a 3-bed/2.0-bath manufactured listed at $185k.
Deal economics
- At list price, monthly cash flow is $317 ($4k/yr) — positive.
- The deal already cash-flows at list — no discount required.
- Meets the 1% rule at list price ($2k rent vs $185k).
- Recommended offer: $179k (3.0% below list) — sets the bar for market timing.
- Cap rate 8.3% vs local median 2.0% in Pinehurst — top-decile yield for the area; either an underpriced asset or a hidden risk that comps aren't pricing in. Stress-test before assuming the spread holds.
Location & tenants
- Location reads 55/100 on livability (#1,350 in TX) — a working-class tenant base; expect higher turnover. Strengths: cost of living A+, housing B+; Watch: employment C-, crime D-, amenities F.
- Magnolia ISD (rural): math 42% / reading 45% proficiency, ranked #247 of 826 in TX (top 30%) — families likely to look elsewhere, expect single-tenant / working-renter base with shorter leases.
- Zoned schools: Willie E Williams El (math 46% / reading 41%, grade F, #1,269 of 4,322 statewide, top 30%, 869 students, 70% FRL); Magnolia West H S (math 41% / reading 53%, grade D-, #591 of 1,632 statewide, top 38%, 2,208 students, 52% FRL) — zoned schools average 61% FRL vs 39% district-wide (22 pts higher); higher-poverty schools than district average — tighter screening recommended.
- Market conditions: Rents flat; 1604 active listings in the ZIP; high-income renter base; 13,259 units permitted in Montgomery County in 2024 (1,402 in 5+ unit buildings).
Forward outlook
- In year one you build about $20k of equity ($1k loan paydown + $18k appreciation (10.0% local appreciation)).
- Montgomery County population projected at +65% by 2050 — long-run rental-demand tailwind backs the buy-and-hold thesis.
- At projected returns (10.0% appreciation + 0.3% rent growth), your $52k cash investment doubles in ~3 years — after that, you're playing with house money.
- By year 2, paydown + projected appreciation supports a ~$32k cash-out refi (75% LTV) — recoverable capital for the next deal without selling this one.
Negotiation context
- It's been on market 35 days — a 3% lower offer ($179k) is reasonable based on typical stale-listing flexibility.
Risks & watch-outs
- Climate carrying-cost: severe wind risk, 99% chance of damaging wind over 30y; extreme-heat days projected 7→23/yr by 2055 (HVAC capex compounding) — expect insurance premiums to compound above CPI over the hold.
Questions for the listing agent
- It's been on market 35 days. Have you received any prior offers? Is the seller open to a 3% concession, seller financing, or rate buy-down credit?
- Built in 1973 — when were the roof, HVAC, electrical panel, plumbing, and water heater last replaced?
- Is there a deadline driving the sale (1031 exchange, divorce, estate, relocation)? That informs how much negotiation room exists.
- Schools are F-rated, which usually means shorter tenancies and higher turnover. Who's the typical renter profile here, and what's been the actual vacancy rate?
- Crime grade is D in this area — have there been break-ins, vandalism, or insurance claims at this property in the last 3 years? What carrier currently insures it and at what premium?
- What's the average days-on-market for RENTAL listings here right now (not sales)? A rising rental-DOM trend means longer vacancies and softer asking-rent achievability than the comps imply.
- What's the recent tenant-quality profile in this submarket — average credit score on applications, eviction rate, late-payment / NSF rate, and stable-employment percentage? A property-management company in the area should have these aggregated.
- How much new for-sale + rental construction is in the pipeline within 1–3 miles? Heavy new supply typically softens prices + rents 12–24 months out; constrained supply supports both.
Investment metrics
- 1% rule
- 1.02% ✓
- Cap rate
- 8.35%
- Cash-on-cash
- 7.34%
- DSCR
- 1.33
- GRM
- 8.2
CMA / ARV
- ARV (median comp)
- $171,553
- List price
- $185,000
- Delta
- 7.84%
- Verdict
- FAIR
- Comps
- 4 within 1.0 mi
Show comp detail 3 sales within ~0.75 mi
| Address | Dist | Beds/Ba | Sqft | Sold | Price | $/sf | Match |
|---|---|---|---|---|---|---|---|
| 31002 Misty Meadow Dr | 0.15mi | 3/2.0 | 1,320 (+8%) | 3mo | $150,000 | $114 | 77 |
| 37118 Gossamer Ln | 0.39mi | 3/2.0 | 1,056 (-13%) | 8mo | $225,000 | $213 | 53 |
| 30927 Honeysuckle Ln | 0.69mi | 4/2.0 (+1) | 1,320 (+8%) | 1mo | $176,900 | $134 | 48 |
Match score weights: distance 35% · size 25% · config 20% · recency 20%. Top-matched comps best support the ARV.
Projected returns pro-forma
10.0% appreciation · 0.32% rent growth · sell at horizon
- IRR
- 28.6%
- Equity multiple
- 3.24×
- Total profit
- $115,940
- Equity at exit
- $166,663
- IRR
- 24.2%
- Equity multiple
- 7.11×
- Total profit
- $316,493
- Equity at exit
- $359,414
Cash invested: $51,800 (down + closing). Projections, not guarantees.
Landlord ↔ Tenant lean methodology
- Overall (STATE)
- 87 Strongly Landlord-Friendly
- State Texas
- 87 Strongly Landlord-Friendly · R+5
- County
- — inherits STATE
- City
- — inherits STATE
ZIP-level market 77354
- Home prices YoY
- 2.4%
- Rents YoY
- 0.3%
- Active inventory
- 1604
- Price-to-rent
- 8.2×
Monthly cashflow live
- Estimated rent
- $1,887 medium interval (Pro) →
- Mortgage (P&I)
- −$970
- Tax from tax record
- −$127 /mo · $1,521/yr
- Insurance
- −$77
- HOA
- −$0
- Vacancy / Maint / Mgmt
- −$396
- Net cashflow
- $317
Break-even live
UW: 25.0% down · 7.5% · 30yr · 1.5% tax · 5.0% vac · 8.0% maint · 8.0% mgmt
Financing live
Cash to close
- Down payment
- $46,250
- Closing costs
- $5,550
- Reserves months
- —
- Total cash needed
- —
Loan-product check · same deal, 3 products live
Conventional
25% down · 7.5% · 30yr
- Down + closing
- —
- Monthly P&I
- —
- Monthly cashflow
- —
- DSCR
- —
- Eligible?
- —
Personal DTI + credit; lowest rate.
DSCR
20% down · 8.5% · 30yr
- Down + closing
- —
- Monthly P&I
- —
- Monthly cashflow
- —
- DSCR
- —
- Eligible?
- —
No personal income docs; deal must DSCR.
Hard money
10% down · 12.0% · 12mo
- Down + closing
- —
- Monthly P&I
- —
- Monthly cashflow
- —
- DSCR
- —
- Eligible?
- —
Short-term bridge; refi at stabilization.
Listing history 16 events
-
2026-06-18days on market $185,000 Active 35 DOM
-
2026-06-17days on market $185,000 Active 34 DOM
-
2026-06-16days on market $185,000 Active 33 DOM
-
2026-06-15days on market $185,000 Active 32 DOM
-
2026-06-13days on market $185,000 Active 30 DOM
-
2026-06-09days on market $185,000 Active 26 DOM
-
2026-06-08days on market $185,000 Active 25 DOM
-
2026-06-07days on market $185,000 Active 24 DOM
-
2026-06-04days on market $185,000 Active 21 DOM
-
2026-06-03days on market $185,000 Active 20 DOM
-
2026-06-02days on market $185,000 Active 19 DOM
-
2026-06-01days on market $185,000 Active 18 DOM
-
2026-05-31days on market $185,000 Active 17 DOM
-
2026-05-14$185,000 Active 926-char remark
-
2010-05-20soldstatus
-
2009-08-31soldstatus
ⓘ Source: listings_history table (triggers on properties + properties_extension) + one-shot
backfill from property_details.listing_events for pre-trigger history.
Tax reassessment forecast TX · Resets to sale price
- Current annual tax
- $1,521 · $127/mo
- Projected year-2 tax
- $3,386 · $282/mo
- Expected delta
- +$1,865/yr (+$155/mo · 122.6%)
ⓘ Screening estimate from a state-policy table — verify with the county assessor before closing.
Climate risk First Street
- Flood 1/10 Low FEMA zone X (unshaded) · 0% chance over 30 yrs
- Wildfire 3/10 Moderate
- Heat 8/10 Severe 7 d/yr ≥111°F today · 23 d/yr by 30 yrs out
- Wind 8/10 Severe 99% chance of damaging wind over 30 yrs
- Air quality 2/10 Low 2 unhealthy d/yr today · 2 by 30 yrs out
Nearby sold comps map
Loading sold comps map…
Walkable amenities ~0.75 mi
Loading nearby amenities…
Taxation est. · year 1
- Rental income
- $22,644
- − Mortgage interest
- −$10,363
- − Property taxes
- −$1,521
- − Insurance
- −$925
- − Repairs & maintenance
- −$1,812
- − Management
- −$1,812
- − Depreciation
- −$5,382
- Taxable income
- $831
- Est. tax owed @ 24.0%
- −$199
- After-tax cash flow
- $3,602/yr
For passive investors: Depreciation is non-cash, so a rental often shows a tax loss while cash-flowing — sheltering income. Rental losses are passive: they offset passive income freely, and up to $25,000/yr can offset ordinary (W-2) income if you actively participate and your MAGI is under $100k (phasing out to $0 by $150k); unused losses carry forward. On sale, claimed depreciation is recaptured at up to 25%, and gains may owe capital-gains tax (a 1031 exchange can defer both). Figures are a year-1 estimate at your 24.0% rate — not tax advice; consult a CPA.
Schools (NCES district)
- District
- Magnolia ISD
- NCES district ID
- 4828740
- Math proficiency
- 42% ▼ -7.00%
- Reading proficiency
- 45% ▼ -4.00%
- Median HH income
- $71,692
- Composite
- 39.46/100
- National rank
- #3958
- State rank
- #247 of 826 in TX
Livability — Pinehurst
- Score
- 55/100
- State rank
- #1350
- US rank
- #23272
Category grades
Schools grade is shown separately in the Schools card above.
Census & demographics
- Census place
- Pinehurst, TX
- County
- Montgomery County · 663,713 people
- Metro
- Houston-The Woodlands-Sugar Land, TX
- Population (ZIP)
- 44,900
- Household income
- $112,504
- Rent vs Own
- Severe rent burden
- 586.0
Population outlook (Montgomery County) Hauer SSP2
- Today (2025)
- 713,896 people
- By 2030
- 805,263 · +12.8%
- By 2040
- 992,708 · +39.1%
- By 2050
- 1,179,590 · +65.2%
- By 2075
- 1,628,084 · +128.1%
- By 2100
- 1,937,880 · +171.5%
Race, ethnicity, and origin ACS 2023
- Neighborhood character
- Predominantly White (66%)
- Race & ethnicity
- White 66% Hispanic / Latino 25% Two or more races 18% Black 3% Asian 1%
- Hispanic origin (detail)
- Mexican 14% Puerto Rican 1%
- Common ancestry
- Lithuanian 4% Slovak 2% Italian 2%
- Foreign-born
- 11% · Canada, Vietnam
- Languages at home
- 83% English-only · Spanish 15% Other Indo-European 1% German/W. Germanic 1%
Political lean MEDSL · Montgomery
- 2024 margin
- Solid R (+45.5) · D 26.8% · R 72.3%
- 2008→2024 swing
- +7.2pp toward D · 2008: -52.7pp · 2024: -45.5pp
- All cycles
- 2024: R+45.5 2020: R+43.8 2016: R+51.4 2012: R+60.7 2008: R+52.7
Not yet ingested
- Civics
- —
Market trends
- HPI YoY
- ▲ 12.09%
- Current HPI
- 512.87
- Rent YoY
- ▲ 0.32%
- Metro
- Houston-The Woodlands-Sugar Land, TX
- State GDP YoY
- ▲ 3.95%
- F500 in state
- 110
Industry mix (Fortune 500 HQ in TX)
| Industry | F500 HQs | Revenue |
|---|---|---|
| Energy | 16 | $1,198B |
|
||
| Technology | 5 | $198B |
|
||
| Engineering / Construction | 4 | $72B |
|
||
| Energy Services | 3 | $60B |
|
||
| Utilities | 3 | $41B |
|
||
| Healthcare | 2 | $330B |
|
||
Price history
3 events — show timeline
- 2026-05-14 Listed $185,000 HARMLS
- 2010-05-20 Sold (Public Records) — Public Records
- 2009-08-31 Sold (Public Records) — Public Records
Property tax history
+10.9%/yrLatest (2025): $1,521 · -13.0% YoY. Source: county tax records.
Cash-flow waterfall
monthlySold comps — $/sqft
last 12 mo · ≤1 miLoading sold comps…