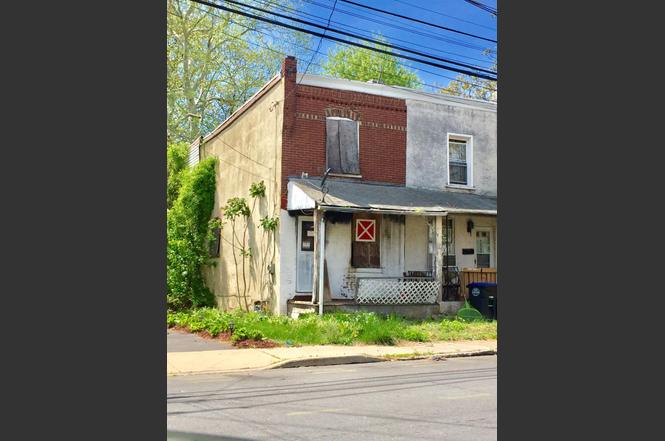
1108 Central Ave · Chester, PA
Flood risk 1/10 · Minimal
- FEMA flood zone
- X (unshaded)
- Chance of flooding over 30 yrs
- 0.0%
- Est. flood insurance / yr
- $473 – $860
Fire risk 1/10 · Minimal
- Est. fire insurance / yr
- $511 – $949
Heat risk 7/10 · Major
- Hot days now (above 105°F)
- 7 days/yr
- Hot days in 30 yrs
- 15 days/yr
Wind risk 6/10 · Moderate
- Chance of severe wind over 30 yrs
- 27.0%
Air-quality risk 4/10 · Minor
- Unhealthy air days now
- 4 days/yr
- Unhealthy air days in 30 yrs
- 7 days/yr
Risk factors via First Street. Map © Google.
Why this score? — see what drove the B+ grade
The composite is a weighted blend of 9 inputs, each scored 0–100. Each bar is that input's sub-score; the figure is the points it added to the 100-point composite (weight × sub-score).
- Cash flow +30.0/30.0
- ARV discount +15.0/15.0
- 1% rule +10.0/10.0
- DSCR +10.0/10.0
- Rent growth +4.2/5.0
- Livability +3.7/5.0
- Condition / age +2.5/5.0
- Schools +0.8/10.0
- Appreciation +0.0/10.0
$43,000
🖨 Deal sheet 📄 Offer letter ✓ Due diligence
Listing remarks
Location Location Location! Looking to make $$$ on your next Total Reno Project, this one is for you! This Twin home is located in a well sought after area of the City and is situated on a sizable lot that is 15 Feet Wide and runs 140 Feet in Length. Neighboring homes include Singles and Twins on this Quiet street. Homes for sale in this pocket are rare and sell very quickly when they become available . This area also generates good rental income. Under the Chester Housing Program, a 3 Bedroom rental can receive up to $1,953.00 a month. Without the program, a 3 bedroom home recently leased at $1,600.00 a month and A similar property totally renovated with Only 2 Bedrooms is pending for
Key facts
- Quiet street
- Large amount of land
- Public driveway
Tags
Property features AI
Finance
- Other: Ground rent paid annually
Exterior
- Parking: On-street parking
- Utilities: Public water; Public sewer
- Home design: Semi-detached property; Fee simple ownership; Property needs major rehabilitation
- Construction: Brick construction; Brick/mortar foundation; Above-grade and below-grade structures; Above-grade finished area about 962 (per assessor)
- Exterior features: Level lot with a rear yard; Lot dimensions approximately 15 x 140
Interior
- Bedrooms: Three bedrooms on the first upper level
- Bathrooms: One full bathroom (all upper levels)
- Interior features: Basement with interior access; Living area per assessor
Neighborhood map
What this means for you Summary
Snapshot
- This is a 3-bed/1.0-bath townhouse listed at $43k.
Deal economics
- At list price, monthly cash flow is $808 ($10k/yr) — positive.
- The deal already cash-flows at list — no discount required.
- Meets the 1% rule at list price ($1k rent vs $43k).
- Cap rate 28.8% vs local median 7.5% in Chester — top-decile yield for the area; either an underpriced asset or a hidden risk that comps aren't pricing in. Stress-test before assuming the spread holds.
Location & tenants
- Location reads 73/100 on livability (#540 in PA) — a middle-class / working-renter tenant base. Strengths: amenities A+, commute A+, cost of living A+; Watch: schools F, crime F, employment F.
- Chester-Upland SD (suburban): math 4% / reading 17% proficiency, ranked #533 of 539 in PA (top 99%) — low school quality limits family demand, transient renter base, plan for 1-2y turnover; 81% free/reduced lunch — lower-income household profile, screen leases tightly.
- Market conditions: Rents rising fast (+6.9%/yr); 138 active listings in the ZIP; 10 comparable units currently listed for rent nearby; rentals at typical pace (median 25d on market — plan ~3-4 weeks tenant-placement turnaround); lower-income renter base — watch delinquency; 299 units permitted in Delaware County in 2024 (5 in 5+ unit buildings).
- This rent runs 41% of the median local income ($41k/yr) — at the standard rent-burdened threshold; future hikes will face affordability resistance.
Forward outlook
- Local home prices are declining (-3.0%/yr); year-one equity from $297 of loan paydown is wiped out by about $1k of value loss. Plan a longer hold.
- At projected returns (-3.0% appreciation + 6.9% rent growth), your $12k cash investment doubles in ~2 years — after that, you're playing with house money.
Negotiation context
- Only 1 days on market — expect competitive offers; lowballing is unlikely to land.
Risks & watch-outs
- Watch-outs: built in 1920 — expect roof / HVAC / electrical / plumbing capex.
- Climate carrying-cost: major wind risk, 27% chance of damaging wind over 30y; extreme-heat days projected 7→15/yr by 2055 (HVAC capex compounding) — expect insurance premiums to compound above CPI over the hold.
Questions for the listing agent
- Built in 1920 — when were the roof, HVAC, electrical panel, plumbing, and water heater last replaced?
- Is there a deadline driving the sale (1031 exchange, divorce, estate, relocation)? That informs how much negotiation room exists.
- Schools are F-rated, which usually means shorter tenancies and higher turnover. Who's the typical renter profile here, and what's been the actual vacancy rate?
- Crime grade is F in this area — have there been break-ins, vandalism, or insurance claims at this property in the last 3 years? What carrier currently insures it and at what premium?
- What's the average days-on-market for RENTAL listings here right now (not sales)? A rising rental-DOM trend means longer vacancies and softer asking-rent achievability than the comps imply.
- What's the recent tenant-quality profile in this submarket — average credit score on applications, eviction rate, late-payment / NSF rate, and stable-employment percentage? A property-management company in the area should have these aggregated.
- How much new for-sale + rental construction is in the pipeline within 1–3 miles? Heavy new supply typically softens prices + rents 12–24 months out; constrained supply supports both.
Investment metrics
- 1% rule
- 3.25% ✓
- Cap rate
- 28.84%
- Cash-on-cash
- 80.53%
- DSCR
- 4.58
- GRM
- 2.6
CMA / ARV
- ARV (on-the-fly)
- $84,656
- Comps found
- 12
Show comp detail 12 sales within ~0.75 mi
| Address | Dist | Beds/Ba | Sqft | Sold | Price | $/sf | Match |
|---|---|---|---|---|---|---|---|
| 1213 W 9th St | 0.36mi | 3/1.0 | 992 (+3%) | 7mo | $135,000 | $136 | 72 |
| 1120 W 9th St | 0.40mi | 3/1.0 | 932 (-3%) | 5mo | $45,000 | $48 | 72 |
| 930 Pennell St | 0.35mi | 3/1.0 | 932 (-3%) | 8mo | $76,000 | $82 | 72 |
| 1124 W 9th St | 0.39mi | 3/1.0 | 932 (-3%) | 7mo | $56,500 | $61 | 71 |
| 1308 Central Ave | 0.13mi | 2/1.0 (-1) | 844 (-12%) | 1mo | $140,000 | $166 | 68 |
| 920 Pennell St | 0.35mi | 3/1.0 | 1,042 (+8%) | 5mo | $55,000 | $53 | 66 |
| 1018 W 8th St | 0.48mi | 3/1.5 | 954 (-1%) | 12mo | $55,000 | $58 | 64 |
| 920 Butler St | 0.64mi | 3/1.0 | 1,024 (+6%) | 3mo | $143,100 | $140 | 57 |
| 917 Pennell St | 0.37mi | 3/1.0 | 1,100 (+14%) | 10mo | $97,000 | $88 | 50 |
| 1122 W 8th St | 0.42mi | 3/1.5 | 1,062 (+10%) | 14mo | $75,000 | $71 | 49 |
| 1330 W 2nd St | 0.65mi | 3/2.0 | 1,008 (+5%) | 13mo | $145,000 | $144 | 47 |
| 29 Upland Ave | 0.57mi | 2/1.0 (-1) | 840 (-13%) | 11mo | $145,000 | $173 | 38 |
Match score weights: distance 35% · size 25% · config 20% · recency 20%. Top-matched comps best support the ARV.
Projected returns pro-forma
-3.0% appreciation · 6.88% rent growth · sell at horizon
- IRR
- 85.1%
- Equity multiple
- 5.17×
- Total profit
- $50,187
- Equity at exit
- $6,411
- IRR
- 89.2%
- Equity multiple
- 12.24×
- Total profit
- $135,272
- Equity at exit
- $3,718
Cash invested: $12,040 (down + closing). Projections, not guarantees.
Landlord ↔ Tenant lean methodology
- Overall (STATE)
- 62 Landlord-Friendly
- State Pennsylvania
- 62 Landlord-Friendly · EVEN
- County
- — inherits STATE
- City
- — inherits STATE
ZIP-level market 19013
- Rents YoY
- 6.9%
- Active inventory
- 138
- Price-to-rent
- 2.6×
Monthly cashflow live
- Estimated rent
- $1,399 high interval (Pro) →
- Mortgage (P&I)
- −$225
- Tax est. 1.5%
- −$54 /mo · $645/yr
- Insurance
- −$18
- HOA
- −$0
- Vacancy / Maint / Mgmt
- −$294
- Net cashflow
- $808
Break-even live
UW: 25.0% down · 7.5% · 30yr · 1.5% tax · 5.0% vac · 8.0% maint · 8.0% mgmt
Financing live
Cash to close
- Down payment
- $10,750
- Closing costs
- $1,290
- Reserves months
- —
- Total cash needed
- —
Loan-product check · same deal, 3 products live
Conventional
25% down · 7.5% · 30yr
- Down + closing
- —
- Monthly P&I
- —
- Monthly cashflow
- —
- DSCR
- —
- Eligible?
- —
Personal DTI + credit; lowest rate.
DSCR
20% down · 8.5% · 30yr
- Down + closing
- —
- Monthly P&I
- —
- Monthly cashflow
- —
- DSCR
- —
- Eligible?
- —
No personal income docs; deal must DSCR.
Hard money
10% down · 12.0% · 12mo
- Down + closing
- —
- Monthly P&I
- —
- Monthly cashflow
- —
- DSCR
- —
- Eligible?
- —
Short-term bridge; refi at stabilization.
Rent comps 10 comps
| Address | Beds | Baths | Sqft | Rent | $/sqft | DOM | Units | Dist |
|---|---|---|---|---|---|---|---|---|
| 1127 Ward St Chester, PA | 2.0 | 1.0 | 800 | $1,250 | $1.56 | 7d | 1 | 0.64mi |
| 425 Highland Ave Apt A Chester, PA | 2.0 | 1.5 | 990 | $1,000 | $1.01 | 20d | 1 | 0.91mi |
| 3312 W 13th St Chester, PA | 2.0 | 1.0 | 936 | $1,499 | $1.60 | 22d | 1 | 1.12mi |
| 908 Keystone Rd Chester, PA | 2.0 | 1.0 | 750 | $1,200 | $1.60 | 43d | 1 | 1.15mi |
| 906 Keystone Rd Chester, PA | 2.0 | 1.0 | 800 | $1,200 | $1.50 | 22d | 1 | 1.15mi |
| 906 Keystone Rd Unit 1 Chester, PA | 2.0 | 1.0 | 800 | $1,200 | $1.50 | 24d | 1 | 1.15mi |
| 1107-1115 Keystone Rd Chester, PA | 2.0 | 1.0 | 700 | $1,250 | $1.79 | 43d | 1 | 1.15mi |
| 1006 Keystone Rd Chester, PA | 2.0 | 1.0 | 750 | $1,200 | $1.60 | 24d | 1 | 1.17mi |
| 280 Bridgewater Rd Brookhaven, PA | 1.0–2.0 | 1.0–2.0 | 775 | $1,695 | $2.19 | 5d | 4 | 1.31mi |
| 280 Bridgewater Rd Brookhaven, PA | 1.0–2.0 | 1.0–1.5 | 775 | $1,800 | $2.32 | 24d | 2 | 1.31mi |
Listing history 2 events
-
2026-06-18remarks 699-char remark
-
2026-06-18$43,000 Coming Soon 1 DOM
ⓘ Source: listings_history table (triggers on properties + properties_extension) + one-shot
backfill from property_details.listing_events for pre-trigger history.
Climate risk First Street
- Flood 1/10 Low FEMA zone X (unshaded) · 0% chance over 30 yrs
- Wildfire 1/10 Low
- Heat 7/10 Severe 7 d/yr ≥105°F today · 15 d/yr by 30 yrs out
- Wind 6/10 Major 27% chance of damaging wind over 30 yrs
- Air quality 4/10 Moderate 4 unhealthy d/yr today · 7 by 30 yrs out
Nearby sold comps map
Loading sold comps map…
Walkable amenities ~0.75 mi
Loading nearby amenities…
Taxation est. · year 1
- Rental income
- $16,787
- − Mortgage interest
- −$2,409
- − Property taxes
- −$645
- − Insurance
- −$215
- − Repairs & maintenance
- −$1,343
- − Management
- −$1,343
- − Depreciation
- −$1,251
- Taxable income
- $9,581
- Est. tax owed @ 24.0%
- −$2,299
- After-tax cash flow
- $7,396/yr
For passive investors: Depreciation is non-cash, so a rental often shows a tax loss while cash-flowing — sheltering income. Rental losses are passive: they offset passive income freely, and up to $25,000/yr can offset ordinary (W-2) income if you actively participate and your MAGI is under $100k (phasing out to $0 by $150k); unused losses carry forward. On sale, claimed depreciation is recaptured at up to 25%, and gains may owe capital-gains tax (a 1031 exchange can defer both). Figures are a year-1 estimate at your 24.0% rate — not tax advice; consult a CPA.
Schools (NCES district)
- District
- Chester-Upland SD
- NCES district ID
- 4205860
- Math proficiency
- 4% ▼ -3.00%
- Reading proficiency
- 17% ▼ -6.00%
- Median HH income
- $29,790
- Composite
- 8.05/100
- National rank
- #9918
- State rank
- #533 of 539 in PA
Livability — Chester
- Score
- 73/100
- State rank
- #540
- US rank
- #5053
Category grades
Schools grade is shown separately in the Schools card above.
Census & demographics
- Census place
- Chester, PA
- County
- Delaware County · 399,863 people
- City population
- 35,064
- Metro
- Philadelphia-Camden-Wilmington, PA-NJ-DE-MD
- Population (ZIP)
- 35,064
- Household income
- $41,261
- Rent vs Own
- Severe rent burden
- 2668.0
Population outlook (Delaware County) Hauer SSP2
- Today (2025)
- 577,490 people
- By 2030
- 581,243 · +0.6%
- By 2040
- 584,700 · +1.2%
- By 2050
- 586,581 · +1.6%
- By 2075
- 598,706 · +3.7%
- By 2100
- 590,823 · +2.3%
Race, ethnicity, and origin ACS 2023
- Neighborhood character
- Predominantly Black (71%)
- Race & ethnicity
- Black 71% White 14% Hispanic / Latino 9% Two or more races 4%
- Hispanic origin (detail)
- Puerto Rican 6%
- Common ancestry
- Romanian 2%
- Foreign-born
- 4% · Canada
- Languages at home
- 92% English-only · Spanish 6%
Political lean MEDSL · Delaware
- 2024 margin
- Strong D (+23.7) · D 61.4% · R 37.6% · Other 1.0%
- 2008→2024 swing
- +2.3pp toward D · 2008: 21.4pp · 2024: 23.7pp
- All cycles
- 2024: D+23.7 2020: D+26.7 2016: D+22.0 2012: D+21.8 2008: D+21.4
Not yet ingested
- Civics
- —
Market trends
- HPI YoY
- ▼ -149.69%
- Current HPI
- 219.5173
- Rent YoY
- ▲ 6.88%
- Metro
- Philadelphia-Camden-Wilmington, PA-NJ-DE-MD
- State GDP YoY
- ▲ 1.68%
- F500 in state
- 34
Industry mix (Fortune 500 HQ in PA)
| Industry | F500 HQs | Revenue |
|---|---|---|
| Healthcare | 2 | $309B |
|
||
| Insurance | 2 | $27B |
|
||
| Telecommunications / Media | 1 | $124B |
|
||
| Industrial Distribution | 1 | $22B |
|
||
| Financial Services | 1 | $20B |
|
||
| Chemicals / Materials | 1 | $18B |
|
||
Price history
+0.0% since first listed2 events — show timeline
- 2026-06-19 Listed $43,000 BRIGHT MLS
- 2026-06-18 Coming Soon $43,000 BRIGHT MLS
Property tax history
-6.1%/yrLatest (2026): $41 · +143.4% YoY. Source: county tax records.
Cash-flow waterfall
monthlySold comps — $/sqft
last 12 mo · ≤1 miLoading sold comps…